 Open Access Article
Creative Commons Attribution 3.0 Unported Licence
Development of portable defocusing micro-scale spatially offset Raman spectroscopy
Marco
Realini
a,
Alessandra
Botteon
a,
Claudia
Conti
*a,
Chiara
Colombo
a and
Pavel
Matousek
*b
aConsiglio Nazionale delle Ricerche, Istituto per la Conservazione e la Valorizzazione dei Beni Culturali (ICVBC), Via Cozzi 53, 20125, Milano, Italy. E-mail: conti@icvbc.cnr.it
bCentral Laser Facility, Research Complex at Harwell, STFC Rutherford Appleton Laboratory, Harwell Oxford, OX11 0QX, UK. E-mail: pavel.matousek@stfc.ac.uk
First published on 8th April 2016
Abstract
We present, for the first time, portable defocusing micro-Spatially Offset Raman Spectroscopy (micro-SORS). Micro-SORS is a concept permitting the analysis of thin, highly turbid stratified layers beyond the reach of conventional Raman microscopy. The technique is applicable to the analysis of painted layers in cultural heritage (panels, canvases and mural paintings, painted statues and decorated objects in general) as well as in many other areas including polymer, biological and biomedical applications, catalytic and forensics sciences where highly turbid stratified layers are present and where invasive analysis is undesirable or impossible. So far the technique has been demonstrated only on benchtop Raman microscopes precluding the non-invasive analysis of larger samples and samples in situ. The new set-up is characterised conceptually on a range of artificially assembled two-layer systems demonstrating its benefits and performance across several application areas. These included stratified polymer sample, pharmaceutical tablet and layered paint samples. The same samples were also analysed by a high performance (non-portable) benchtop Raman microscope to provide benchmarking against our earlier research. The realisation of the vision of delivering portability to micro-SORS has a transformative potential spanning across multiple disciplines as it fully unlocks, for the first time, the non-invasive and non-destructive aspects of micro-SORS enabling it to be applied also to large and non-portable samples in situ without recourse to removing samples, or their fragments, for laboratory analysis on benchtop Raman microscopes.
Introduction
Non-invasive analysis of thin stratified turbid (diffusely scattering) layers is an analytical challenge commonly present in a wide range of disciplines. For instance, many analytical problems in art require non-invasive probing of thin stratified layers of paint that may lie beyond the reach of conventional methods such as confocal Raman microscopy. The sublayer chemical information is crucially important, for example, in restoration and conservation processes or to elucidate technique of the artist in question. The key goal in all these applications is to avoid cross sectional analysis which is either highly undesirable or not permissible due to the uniqueness and high cultural value of the object analysed. Examples of such matrices in cultural heritage include artworks such as panels, canvases and mural paintings, painted statues and other decorated objects in art. Painted layers, in general, are by their nature highly turbid and typically only a few tens of micrometres thick, commonly spreading in multiple stratigraphy leaving them often out of reach of conventional Raman microscopy, which is frequently the technique of choice in cross-sectional analysis, where permitted.1,2 This is only one area on which we are exemplifying the analytical need but there are many other disciplines having similar requirements including polymer, catalytic, biological and biomedical applications and forensic sciences where highly turbid stratified layers can be present and where invasive analysis may be undesirable or impossible.Recently a new concept in Raman microscopy possessing considerably higher penetration depth than that of conventional Raman microscopy and capable of overcoming the above limitations in a number of situations has emerged – micro-SORS.1,2 The method builds on earlier advances of its parent technique, (macro-scale) Spatially Offset Raman Spectroscopy (SORS)3 and relies on diffusion properties of photons in turbid media. The most basic variant of micro-SORS is defocusing micro-SORS.1 Although this is not the most effective micro-SORS concept in existence,4 by not involving fully separated laser illumination and Raman collection zones as in classical SORS, it is undoubtedly the most practical as it can be practised on existing benchtop Raman microscopes without any modifications.5,6
Nevertheless, to date the technique has only been demonstrated on benchtop Raman microscopes. As such the method has not delivered fully on its non-invasive and non-destructive potential as samples need to be mobile and of adequately small size in order to fit under a Raman microscope. Many applications in the abovementioned disciplines, however, do not fulfill these criteria. Taking again the example of cultural heritage where only small portable objects can be analysed in this manner unless a fragment of a large or non-portable art objects can be taken away, which by its nature breaches the requirement for non-invasiveness. The work presented here concerns the development of a transformative capability facilitating portability and permitting operation outside specialized laboratory. This was accomplished by converting an existing conventional commercial portable Raman instrument to micro-SORS by equipping it with a microscopic capability. This article describes the instrument design and characterises its performance on several examples of artificially assembled two-layer samples. The same samples have also been characterised on our existing micro-SORS Raman benchtop system to provide benchmarking against our previous research.
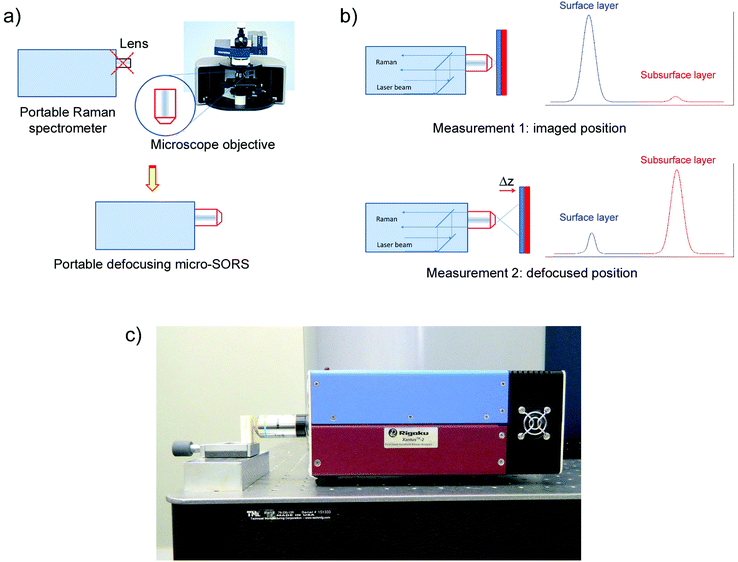
The concept of defocusing micro-SORS and implemented modifications are illustrated in Fig. 1. A conventional portable Raman instrument was fitted with a microscope objective. In general, the basic micro-SORS measurement of a two layer turbid sample relies on collecting at least two Raman spectra: (i) the first spectrum is acquired with the sample at a standard ‘imaged’ position and corresponds to a standard Raman microscopy surface Raman measurement, (ii) the second measurement is taken with the sample moved away from the microscope objective by a ‘defocusing distance Δz’ to a ‘defocused position’. The effect of sample displacement is the enlargement (‘defocusing’) of both the laser illumination and Raman collection zones on sample surface.5 The larger the defocusing distance Δz the greater the enlargement of both the laser illumination and Raman collection zones on sample surface. The ‘imaged’ position measurement typically yields a Raman spectrum dominated by the surface layer1 and would correspond conceptually to a zero-spatially offset measurement in conventional SORS analysis. The measurement carried out in the ‘defocused’ position produces a Raman spectrum which has a significantly higher degree of Raman contribution from sublayers relative to the surface layer with stratified turbid samples, in analogy with a non-zero spatially offset spectrum acquired in a conventional SORS measurement. That is the contrast of the sublayer improves (although the overall Raman intensity of both the layers diminishes). The relative intensity change within spectral subcomponents signifies the presence of multiple layers in sample and permits the recovery of pure Raman components of individual layers.
In the case of a two layer sample, only a very simple mathematical manipulation of the ‘imaged’ and ‘defocused’ spectra can then be performed to retrieve a pure Raman spectrum of sublayer. This process comprises a scaled subtraction of the ‘imaged’ spectrum from the ‘defocused’ spectrum cancelling the contribution of the top layer. More defocused spectra need to be acquired for the separation of layers in a system consisting of more than 2 layers.5 The concept of scaled subtraction was first applied to confocal Raman microscopy with transparent samples by the Morris group.7,8 Micro-SORS uses similar approaches but instead of direct imaging it utilises diffuse component of light.
In general, the limitations of the micro-SORS technique include inapplicability to highly absorbing, extremely thin sublayers, compounds with low Raman cross sections at the subsurface position and highly fluorescing samples. In addition, samples possessing very high heterogeneity across their surface or within sublayers are also challenging without recourse to a more complex data acquisition methodology.2 It should also be noted that the spatial resolution of micro-SORS is, in general, significantly inferior to that of conventional Raman microscopy as it relies on diffused component of light and as such it should only be used at depths where conventional confocal Raman microscopy is inapplicable. Surface roughness can however be dealt with as the roughness will manifest itself as a variation of Raman signal intensities between different layers and as such it will subtract away in the scaled subtraction when retrieving individual layer signals. The effect could however confuse the interpretation of the order in which layers are laid derived typically from the signal dependencies on the degree of defocusing.4 A study by Conti et al.9 further contrasts the conventional confocal Raman microscopy with micro-SORS pointing at differences and commonalities between the two techniques and underlying processes.
Experimental
Portable defocusing micro-SORS
The measurements were carried out using a portable Xantus-2™ (Rigaku, Boston, USA) Raman spectrometer with 2000 × 256 pixels, thermoelectrically cooled CCD and a selected excitation wavelengths of 785 nm. The instrument was modified by removing the end collection and focusing lens with its tubular housing and replacing it with a standard microscope 20× objective (WD 1.3 mm, NA 0.4, Olympus) placed in contact with the front cover plate of the instrument. No other modifications were implemented. This step was important equipping the instrument with micro-scale sampling capability and enabling it to perform effective micro-SORS measurements.The micro-SORS spectra were acquired with a laser power at the sample of up to nominal 250 mW and a spectral resolution of 7–10 cm−1. Both the ‘imaged’ and ‘defocused’ spectra were acquired with acquisition times ranging from 3 to 5 s with 7 accumulations used (i.e. the total acquisition time per sample position was 21–35 s). The instrument was operated from an external computer (laptop). Combined sample illumination and collection area of the modified instrument was estimated to be approximately 40 μm in diameter by scanning across an edge of sample. In this measurement a sharp edge of sample was moved across the interaction zone perpendicular to the optical axis of the instrument. The Raman intensity of the surface layer was recorded as a function of position of sample. The diameter of the interaction area was estimated as the separation of the 10 to 90% intensity points.
Except for the painted layer system, raw spectra are presented with no background correction; all the spectra were normalized to a Raman band of respective top layer. The subtracted pure Raman spectra of individual layers were rescaled relative to each other for clarity. The sample was placed on a manual micro-positioning stage to facilitate measurements at different distances from the objective. In analogous way, the portable instrument could, to an equal effect, also be located itself on a micro-positioning stage and moved in front of sample permitting the analysis of larger, non-moveable objects.
Benchtop defocusing micro-SORS
The measurements were carried out using a Senterra dispersive micro-Raman spectrometer (Bruker Optik GmbH) that includes a standard confocal optical microscope (Olympus BX51). The Raman spectra were acquired using the same objective as that used in the portable instrument (20×, WD 1.3 mm, NA 0.4) and a laser 785 nm excitation wavelength with a nominal power of 100 mW. The detection system consisted of a Peltier cooled CCD detector (1024 × 256 pixels), 1200 grooves per mm grating and the largest confocal slit (50 μm × 1000 μm) was used. Its spectral resolution was 3–5 cm−1. The spectra were acquired with total acquisition time of 5 s and accumulations ranging from 5 to 25 (i.e. the total acquisition time per sample position was 25–125 s). Combined sample illumination and collection area with the 20× objective was estimated to be approximately 4 μm in diameter by scanning across an edge of sample as above.Except for painted layer system, raw Raman spectra are presented with no background correction. All the spectra are normalized to a Raman band of respective top layer. The subtracted spectra are rescaled relative to each other for clarity.
Specimens
Multiple layers of different polymers are used in a number of fields, for example in food packaging. This application area is conceptually represented by our first specimen (S1) comprising artificially assembled two-layer polymeric system. Both layers were highly turbid and opaque in appearance, like many polymer materials present in our daily lives. The top layer was a polytetrafluoroethylene (PTFE) tape (75 μm thick) placed over a 1 mm thick sublayer of a plastic spoon made of polystyrene (PS).Many pharmaceutical products are prepared using different micrometric highly diffusely scattering layers. Our second specimen (S2) representing this area is a pharmaceutical tablet consisting of an external coating layer containing anatase (TiO2, 70 μm thick) followed by a 4 mm thick pharmaceutical formulation (naproxen acid and excipients).
The third example (S3) is an artificially prepared two-layer system simulating application of a real spray paint on stone: PY151 acrylic spray colorant was spread with a thickness of ∼50 μm on a marble stone (1 cm thick), consisting of calcite (CaCO3).
The fourth example (S4) consists of painted layers simulating a real artistic stratigraphy: two pigments were used, red ochre (hematite – Fe2O3) (60 μm thick) on top of phthalocyanine blue (C32H16N8Cu – 50 μm thick), both deposited on a sheet of paper. The preparation of the last two specimens was suggested from the critical need in conservation of cultural heritage to obtain information on the composition of painted stratigraphy applied on panel, canvas or statue and on the conservation state of substrates in mural paintings (Table 1).
| Sample | Top layer | Bottom layer |
|---|---|---|
| Stratified plastic (S1) | Polytetrafluoroethylene (PTFE – 75 μm) | Polystyrene (PS – 1 mm) |
| Pharmaceutical tablet (S2) | Anatase (70 μm) | Naproxen acid and excipients (4 mm) |
| Spray paint on stone (S3) | PY151 (50 μm) | Stone (calcite) (1 cm) |
| Painted stratigraphy (S4) | Red ochre (60 μm) | Phthalocyanine blue (50 μm) |
Results and discussion
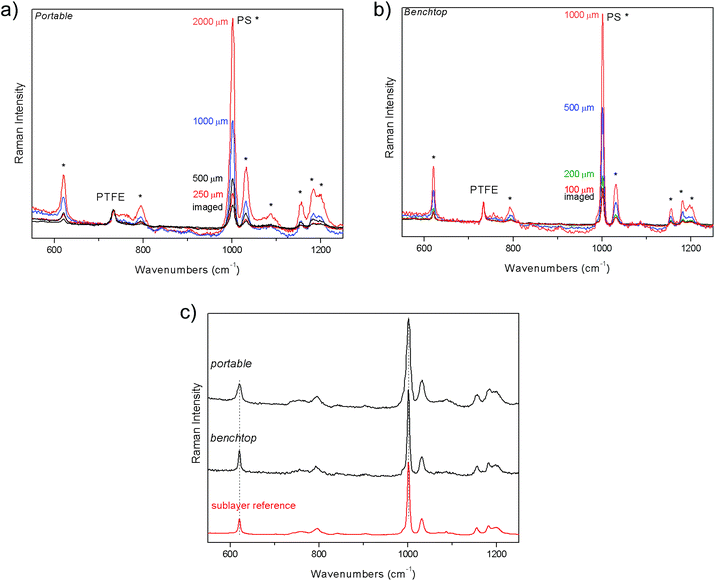
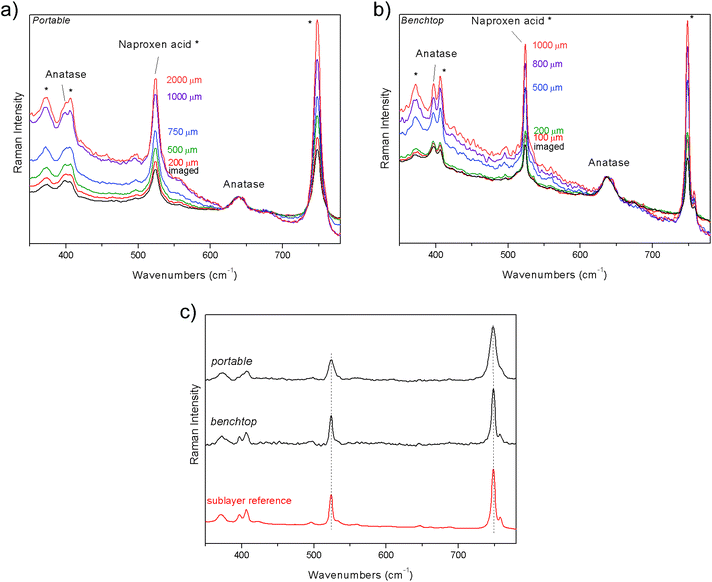
The first demonstration of the performance of portable defocusing micro-SORS was carried out on a stratified plastic system (S1) composed of PS spoon covered with a PTFE tape. Fig. 2 shows the results of the measurements acquired both with portable and benchtop instruments. Raman spectra of the sample when sharply imaged (“0”, zero position) yield the contribution of both layers, clearly visible through their characteristic and intense bands at 1001 cm−1 and 731 cm−1 for PS and PTFE, respectively. As the sample is displaced from the zero position, moved farther away from the microscope objective, the contribution from the sublayer relative to the top layer dramatically increases. To recover the pure Raman spectrum of the sub-layer, the zero spectrum was subtracted from the defocused one, cancelling the Raman contribution from the top layer (Fig. 2c). The resulting pure component of the bottom layer compares well with the reference spectrum of this layer, both with portable and benchtop instruments.Portable defocusing micro-SORS method is illustrated on another example of a two layer system, coming from the pharmaceutical field. The tablet (S2) is composed of naproxen acid coated by a thin film of anatase. Selected Raman spectra from the zero to 1–2 mm defocused positions are shown in Fig. 3 where the evolution of the signals of individual layers with the defocused positions is evidenced. The two layers change the relative intensity with respect to each other, as can be seen by observing in particular the strong bands of naproxen acid at 748 and 524 cm−1 and the band of anatase at 639 cm−1. By applying the same scaling method to the two raw spectra one is able to recover the estimates of the pure Raman sublayer component, as shown in Fig. 3c; the spectra of the sublayer fit again well with the reference spectrum, both for portable and benchtop measurements. The higher spectral resolution of the benchtop instrument turns out to be essential to discriminate the doublet at 396 cm−1 and at 406 cm−1, belonging to anatase and naproxen acid respectively, which is confused in a single band with portable instrument.
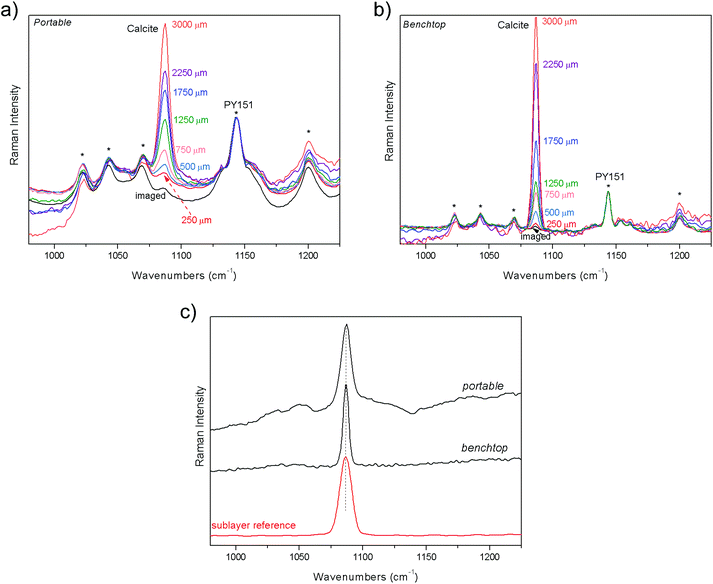
The third specimen mimics a spray paint on mural subsurface; the artificial two-layer system (S3) consists of a deposition of a yellow colorant (in acrylic media) on marble surface. At the “imaged” position the spectrum is dominated by contribution from the top layer, yellow spray, while calcite, the main component of the bottom layer, is detectable only through a very small band at 1086 cm−1 (Fig. 4). Moving the sample farther away from the microscope objective accentuates the inner layer: the increase of calcite is unequivocal from the zero to 3 mm of defocused positions, both for portable and benchtop measurements. The Raman spectra of sublayer recovered from the measurements are shown in Fig. 4c. Again, good agreement is reached with the reference spectrum in both the measurements.
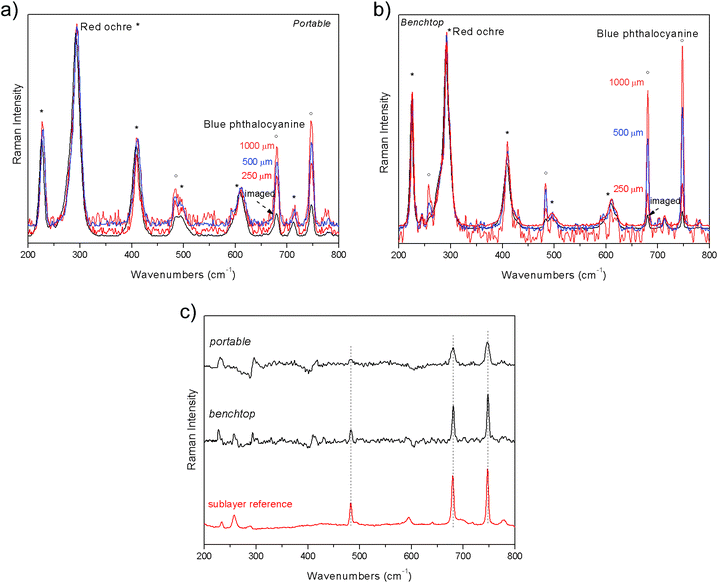
The final example is the demonstration of the applicability of portable defocusing micro-SORS to a painted stratigraphy. The artificial sample is composed of red ochre micrometric layer spread on top of a phthalocyanine blue layer; a paper sheet was used as substrate. The evolution of the signals with the defocused position is shown in Fig. 5. In line with expectations, at the “imaged” position the spectrum is dominated by contribution from the top layer, red ochre. At the same position, phthalocyanine blue bands are more intense in the measurement acquired with portable instrument than that with benchtop one, most likely due to the larger laser spot size. In fact, the larger the spot size the higher the contribution of the bottom layer in the initial, “imaged” position. As shown in Fig. 5, with the increase of the defocused distances with the portable system the contribution of phthalocyanine blue (sublayer) becomes larger, even though to a minor extent when compared with the same evolution observed with the benchtop instrument. Nevertheless, the substrate spectrum was successfully recovered from both with portable and benchtop measurements (Fig. 5c).
It should be noted that the original, unmodified portable Raman instrument (prior to fitting it with microscope objective) was also amenable to micro-SORS analysis as its original collection lens (f = 21 mm, N.A. 0.21) in part also acted as a lower magnification microscope objective. Nevertheless its performance was lower than that of the modified instrument. The unmodified design exhibited 1.6-times and 2.3-times lower enhancement for marble with spray (S3) and painted stratigraphy sample (S4), respectively, compared with the modified instrument (i.e. instrument equipped with a microscope objective). Also the initial contrast (the ratio of subsurface to surface layer Raman signal intensities) at the imaged position between the sublayer and surface layer was 3.3-times and 2.0-times smaller for marble with spray (S3) and painted stratigraphy sample (S4), respectively, for the unmodified instrument. The smaller enhancement was present due to the fact that initial contrast was lower for the unmodified instrument and also as it possessed a lower numerical aperture leading to smaller diameter change with axial displacement.
In conclusion, it is interesting to note that the performance of the portable micro-SORS instrument is broadly speaking as good as that of the benchtop Raman microscope micro-SORS – both in terms of data quality of the retrieved sublayer spectra as well as the magnitude of the achieved contrast improvement between the subsurface and surface layers. Although some variations depending on type of sample are present due to the different nature of the optical layer and the two experimental setups (for example, the spectral resolution of the portable instrument is lower to that of the benchtop system). This exceptionally positive outcome of the experiments bodes well for practical deployment of the instrument on real samples planned in the near future as the next phase of our systematic development programme of work.
Conclusions
A concept of portable non-invasive micro-SORS measurements to elucidate hidden stratigraphy was demonstrated conceptually for a number of artificially prepared samples exemplifying a range of potential applications across multiple disciplines. The portability unlocks fully the non-invasive and non-destructive potential of micro-SORS. Given the wide applicability of the technique and potential for further improvements by introducing fully separated illumination and collection micro-SORS modality4 the concept is expected to find a number of practical application niches in a number of areas providing a beneficial complementary analytical capability to conventional Raman microscopy in situations where the accessible depths of conventional Raman microscopy are inadequate. Such areas include art, archaeology, forensics, catalytic research, biology and biomedical sciences.References
- C. Conti, C. Colombo, M. Realini, G. Zerbi and P. Matousek, Appl. Spectrosc., 2014, 68, 686–691 CrossRef CAS PubMed.
- C. Conti, M. Realini, C. Colombo and P. Matousek, J. Raman Spectrosc., 2015, 46, 476–482 CrossRef CAS.
- P. Matousek, I. P. Clark, E. R. C. Draper, M. D. Morris, A. E. Goodship, N. Everall, M. Towrie, W. F. Finney and A. W. Parker, Appl. Spectrosc., 2005, 59, 393–400 CrossRef CAS PubMed.
- C. Conti, C. Colombo, M. Realini and P. Matousek, Analyst, 2015, 140, 8127–8133 RSC.
- P. Matousek, C. Conti, M. Realini and C. Colombo, Analyst, 2016, 141, 731–739 RSC.
- C. Conti, M. Realini, C. Colombo, K. Sowoidnich, N. K. Afseth, M. Bertasa, A. Botteon and P. Matousek, Anal. Chem., 2015, 87, 5810–5815 CrossRef CAS PubMed.
- A. Govil, D. M. Pallister and M. D. Morris, Appl. Spectrosc., 1991, 45, 1604–1606 CrossRef CAS.
- A. Govil, D. M. Pallister and M. D. Morris, Appl. Spectrosc., 1993, 47, 75–79 CrossRef.
- C. Conti, M. Realini, C. Colombo, A. Botteon and P. Matousek, J. Raman Spectrosc., 2015 DOI:10.1002/jrs.4851.
| This journal is © The Royal Society of Chemistry 2016 |

