
 Open Access Article
 This Open Access Article is licensed under a
 Creative Commons Attribution 3.0 Unported Licence
Pencil it in: pencil drawn electrochemical sensing platforms†
Christopher W.
Foster
a,
Dale A. C.
Brownson
a,
Ana P.
Ruas de Souza
b,
Elena
Bernalte
ac,
Jesus
Iniesta
d,
Mauro
Bertotti
b and
Craig E.
Banks
*a
aFaculty of Science and Engineering, Manchester Metropolitan University, Chester Street, Manchester M15 GD, UK. E-mail: c.banks@mmu.ac.uk; Web: http://www.craigbanksresearch.com Fax: +44 (0)1612476831; Tel: +44 (0)1612471196
bInstituto de Química – Universidade de São Paulo, 05508-900, São Paulo, SP, Brazil
cDepartamento de Química Analítica e IACYS, Facultad de Ciencias, Universidad de Extremadura, Avda. de Elvas s/n, 06006, Badajoz, Spain
dPhysical Chemistry Department and Institute of Electrochemistry, University of Alicante, 03690 San Vicente del Raspeig, Alicante, Spain
First published on 26th May 2016
Abstract
Inspired by recent reports concerning the utilisation of hand drawn pencil macroelectrodes (PDEs), we report the fabrication, characterisation (physicochemical and electrochemical) and implementation (electrochemical sensing) of various PDEs drawn upon a flexible polyester substrate. Electrochemical characterisation reveals that there are no quantifiable electrochemical responses upon utilising these PDEs with an electroactive analyte that requires an electrochemical oxidation step first, therefore the PDEs have been examined towards the electroactive redox probes hexaammineruthenium(III) chloride, potassium ferricyanide and ammonium iron(II) sulfate. For the first time, characterisation of the number of drawn pencil layers and the grade of pencil are examined; these parameters are commonly overlooked when utilising PDEs. It is demonstrated that a PDE drawn ten times with a 6B pencil presented the most advantageous electrochemical platform, in terms of electrochemical reversibility and peak height/analytical signal. In consideration of the aforementioned limitation, analytes requiring an electrochemical reduction as the first process were solely analysed. We demonstrate the beneficial electroanalytical capabilities of these PDEs towards p-benzoquinone and the simultaneous detection of heavy metals, namely lead(II) and cadmium(II), all of which are explored for the first time utilising PDEs. Initially, the detection limits of this system were higher than desired for electroanalytical platforms, however upon implementation of the PDEs in a back-to-back configuration (in which two PDEs are placed back-to-back sharing a single connection to the potentiostat), the detection limits for lead(II) and cadmium(II) correspond to 10 μg L−1 and 98 μg L−1 respectively within model aqueous (0.1 M HCl) solutions.
1. Introduction
There is currently an enormous global interest towards the design, synthesis and fabrication of improved analytical sensing platforms. Electrochemical derived sensors attract attention due to their ability to convert chemical information into an electrical signal and through careful design can give rise to sensitive, selective, experimentally simple and low cost sensors.1 Over recent decades the expansion of carbon based electrochemistry has received significant focus due to these materials satisfying the aforementioned demands, with a particularly large wealth of knowledge being obtained within the fields of highly ordered pyrolytic graphite,2,3 mono- and few-layer graphene,4–6 and carbon nanotubes.7,8 The utilisation of ‘popular’ carbon based materials offers exciting advances within electrochemistry, such as the cost effective production of electrodes that exhibit a similar or enhanced performance to that of the traditional noble metal based alternatives.9 With electrochemists constantly searching for new electrode configurations, focus has now turned to the readily available hand-drawn pencil graphitic electrodes (PDEs),10 where one can potentially draw their own electrode, providing a rapid and extremely cost-effective approach for the production of electrochemical sensing platforms.Commercial pencils (and consequently PDEs) contain a high percentage of graphite, making these an excellent ‘cheap’ electrode material, where the pencil itself is used as an electrode.10,11 Previous literature has been orientated around pencils being used as static standalone electrodes, with many electrochemical applications reported, such as towards the detection of ascorbic acid,12 dopamine,13 flavonoids,14 and morphine.15 However, utilising such standalone pencils as working electrodes is not without its drawbacks, such as their large/bulky nature and the lack of tailorability within the design and control of the working area. One innovative solution is to utilise PDEs, which satisfy the mass requirement for the miniaturisation of electrochemical systems, in addition to allowing vast adaptability and regulation of the working area; the potential ability to draw one's electrode onto a variety of surfaces is extremely attractive. As such, the nature of PDEs potentially allows for extremely simple, effective, low cost and portable sensors to be developed.
Recently, the interest in utilising PDEs has grown and this is evident through the emergence of literature reports which are overviewed in Table 1, with many research groups focusing on either characterising the electrochemical properties of the PDEs, or utilising them towards specific sensing applications,10,12,15 with insufficient/inadequate characterisation being provided in each case. Table 1 provides a thorough literature overview, where for example, Dossi et al.16 have studied the performance of PDEs upon paper substrates towards the detection of ascorbic acid. Additional work involved utilising cobalt(II) phthalocyanine doped-PDEs, in which a bespoke pencil has been fabricated (rather than taking commercially available pencils) where cobalt(II) phthalocyanine has been mixed within the bulk pencil “lead”, sodium bentonite and potassium silicate mixture, and placed within a similar pencil setup and explored for the electrocatalytic detection of cysteine and hydrogen peroxide.16 Other work from this group has explored the detection of analytes such as potassium ferrocyanide,17 1,2-hydroxybenzene,18 dopamine and paracetamol.19 Honeychurch has elegantly demonstrated the electrochemical detection of lead(II) within real canal water samples using PDEs hand-drawn upon polyvinylchloride substrates.10 Although such studies highlight the use of PDEs as a potentially plausible option towards future reproducible, cost effective and simple sensors, many of the examples highlighted in Table 1 fail to adequately characterise the underlying electrochemical (and physicochemical) properties present and overlook the use of control experiments. Another key point to note is that in cases where it is claimed that PDEs are being utilised, in actual fact in the case mentioned previously, a homemade graphite paste electrode type set-up (for example see: ref. 16 and 20) is being implemented, with incorporation of the ‘lead’ from a pencil, which as such should not strictly be classified as a PDE.
| Electrode fabrication | Pencil and substrate utilised | Number of layers drawn | Target analytes | Analytical method | Ref. |
|---|---|---|---|---|---|
| Pencil-drawn counter electrode only | Bulk pencil “lead” working electrode with the counter electrode drawn using Pental (grade ‘H’ only) pencil upon paper substrates | Not stated | p-Nitrophenol | Differential pulse voltammetry | 38 |
| Pencil-drawn working macroelectrode | Staedtler Mars (grade ‘3B’ only) upon paper substrates | Not stated | Potassium ferrocyanide and 1,2-hydroxybenzene | Cyclic voltammetry | 18 |
| Pencil-drawn immune device | 6B-type Black Pencil (only) upon a paper substrate | Not stated | Carbohydrate antigen 199 | Electro-chemiluminescence | 39 |
| Pencil-drawn working macroelectrode | Derwent (grade ‘6B’ only) upon polyvinyl chloride substrate | Not stated | Lead(II) | Anodic stripping voltammetry | 10 |
| Pencil-drawn macroelectrodes | Derwent, Staedtler Mars Lumograph, FILA and Koh-i-Noor Hardtmuth (HB, B, 2B, 3B, 4B, 6B, 8B explored) upon paper substrates | Not stated | Potassium ferrocyanide, ascorbic acid and sunset yellow | Cyclic voltammetry and hydrodynamic voltammetry | 17 |
| Pencil-drawn strain electrode and Chemresistor | Blick pencils (9H, 2H, HB, 2B, 6B, 9B explored) upon paper substrates | Not stated | Toluene, THF, ethyl acetate, methanol, hexane to acetone | Solvent vapour measured | 40 |
| Pencil-drawn dual electrode with pseudo reference electrode | Staedtler Mars (grade ‘3B’ only) upon paper substrates | Not stated | Ascorbic acid, dopamine and paracetamol | Thin-layer chromatography and cyclic voltammetry | 19 |
| Pencil-drawn working macroelectrode with pseudo reference and counter electrode | Working electrode was a bespoke “pencil” manufactured utilising a mixture of graphite, sodium bentonite and potassium silicate, then doped with decamethylferrocene or cobalt(II) phthalocyanine and drawn upon paper substrates. Additional counter and reference electrodes are also drawn onto the substrate. | 4 draws | Cysteine and hydrogen peroxide | Linear sweep voltammetry and cyclic voltammetry | 16 |
| Pencil-drawn working macroelectrode | Commercially available Staedtler Mars tradition pencils upon an ultra-flexible polyester substrate (6B, 5B, 4B, 3B, 2B, B, HB, H, 2H explored) | 1–10 draws | Hexaammineruthenium(III) chloride, ammonium iron(II) sulfate, potassium ferricyanide, p-benzoquinone and simultaneous detection of lead(II) and cadmium(II) ions | Cyclic voltammetry and anodic stripping voltammetry | This work |
Inspired by the recent reports of utilising PDEs (see Table 1) and the considerations noted above, in this paper we report the fabrication, characterisation (physicochemical and electrochemical) and implementation (electrochemical sensing) of various PDEs upon a flexible polyester substrate. We explore the electron transfer properties of our hand-drawn electrodes towards hexaammineruthenium(III) chloride and potassium ferricyanide. We perform control experiments to achieve the optimum performance in terms of the number of ‘draws’ when fabricating a specific PDE and varying the pencil graphite content/composition used to draw the PDEs, namely, 6B, 5B, 4B, 3B, 2B, B, HB, H, and 2H; such control experiments are rarely performed in the literature. Finally, we critically assess and report the electroanalytical performance of our PDEs towards the detection of p-benzoquinone and the simultaneous detection of lead(II) and cadmium(II), which are explored for the first time utilising PDEs.
2. Experimental
All chemicals used were of analytical grade and were used as received without any further purification from Sigma-Aldrich. The solutions were prepared with deionised water of resistivity not less than 18 MΩ cm and were thoroughly degassed with nitrogen before analysis. All measurements were performed with a Palmsens EMSTAT (Palm Instruments BV, The Netherlands) potentiostat.The pencil drawn electrodes (PDEs) were fabricated by hand-drawing a 4 mm diameter circle onto a flexible polyester substrate (Autotex AM 150 μm (F157L)) using a bespoke stainless steel stencil (see Fig. 1) and a range of pencil grades (6B, 5B, 4B, 3B, 2B, B, HB, H, 2H) from a commercially available box of STAEDTLER tradition®110 pencils.
 | ||
| Fig. 1 Optical image of the bespoke metallic stencil used throughout this work (A) to fabricate the PDEs. Shown in (B) is the PDE after one draw, and the completed PDE with a connecting strip is shown in (C). Sellotape® was applied to each individual electrode to cover the conductive carbon connections and define the 4 mm working area. | ||
Upon referring to ‘one draw’ within this paper, this stipulates that we have moved the pencil whilst in contact with the substrate such that the complete area within the 4 mm diameter circle/disc (to be defined as the working area) is drawn as shown in Fig. 1. After defining the surface area, a connecting strip from the top of the circle allows for a crocodile clip connection to be employed to the potentiostat.21 Sellotape® was applied to each individual electrode to cover the conductive carbon connections. In all experiments utilising the PDEs, a platinum wire electrode and saturated calomel electrode (SCE) were used as the counter and reference respectively for comparative purposes.
Scanning electron microscope (SEM) images were obtained with a JEOL JSM-5600LV (JEOL, Tokyo, Japan) model. For the high-resolution transmission electron microscope (TEM) images a JEOL JEM 2100F was used. Raman analysis was carried out using the Thermo Scientific™ DXR Raman (Themo Scientific™, Waltham, MA, USA) spectrometer equipped with an argon laser (532 nm excitation). X-ray Photoelectron Spectroscopy (XPS) chemical analysis was performed with a VG-Microtech Multilab electron spectrometer, using the Mg K−1 (1253.6 eV) radiation of a twin anode in constant analyser energy mode with a pass energy of 50 eV.
The Nicholson method is routinely used to estimate the observed heterogeneous electron transfer rate constant, k0, for quasi-reversible systems using the following equation:22
| ϕ = k0[πDnνF/(RT)]−1/2 | (1) |
| ϕ = (−0.0628 + 0.0021X)/(1 − 0.017X) | (2) |
| k0 = [2.18(DαnFv/RT)0.5]exp[−((a2nF)/RT)×ΔEp] | (3) |
3. Results and discussion
As exhibited in Table 1, the majority of current literature concerning PDEs either does not identify or optimise the layers/draws of the pencil required for the construction of the PDE, nor do they explore the range of pencils that can be used to fabricate the PDEs. In many of the cases reported within Table 1, the PDEs are fabricated from carbon paste electrodes, which consist of the bulk pencil “lead” as the source of graphite. They are then used to draw the PDE. In this paper we utilise commercially available pencils themselves, where ‘one draw’ stipulates that we have moved the pencil whilst in contact with the substrate such that the complete area within the 4 mm diameter circle/disk (to be defined as the working area) is “pencilled in” as shown in Fig. 1.3.1 Electrochemical characterisation of the pencil drawn electrode (PDEs)
The PDEs were electrochemically characterised using 1 mM hexaammineruthenium(III) chloride/0.1 M KCl solution via cyclic voltammetry. First, comparisons were made between the pencil grades 6B, 5B, 4B, 3B, 2B, B, HB, H, and 2H to analyse which grade gives rise to the best electrochemical properties; this is generally overlooked in the academic literature and little reasoning is given why certain pencils are chosen. Additionally, in this work, the amount of pencil “drawn” onto the substrate was analysed with the electrode being “pencilled in” one, three, five and ten times to see what effect this would have upon the electrochemical properties of the resultant electrode.Fig. 2A shows cyclic voltammograms recorded using the redox probe hexaammineruthenium(III) chloride with PDEs which have been drawn just once. Generally, the observed responses are typical of that expected for graphitic-based electrochemical sensors where useful voltammetric signatures are observed, with the 6B found to exhibit the largest peak current; however, the 5B shows the best electrochemical reversibility. To further explore this, Fig. 2B–D shows the PDEs drawn three, five and ten times respectively, where it is clear that as the number of layers are increased, the magnitude of the electrochemical response/peak current also increases. Note the 6B PDE drawn ten times gives rise to a clear decrease in the peak-to-peak separation and an increase of the voltammetric peak current over that of the other PDEs (see Fig. 2), indicating a more beneficial electrode surface with relatively improved/faster electrochemical reversibility and a larger effective area, making this PDE the most suited for further electrochemical analysis. The effect of pencil type and number of draws is presented in Fig. 3, where plots of peak height vs. pencil type are summarised. It is clear that the 6B (in all cases) exhibits the optimal electrochemical response as evaluated using this redox probe, in particular for the PDE drawn ten times. Thus, herein the PDEs for all further studies are drawn ten times with a 6B pencil in order to ensure maximum electrochemical performance.
 | ||
| Fig. 2 Typical cyclic voltammograms utilising different pencil grades drawn one (A), three (B), five (C) and ten (D) times, recorded in 1 mM hexaammineruthenium(III) chloride/0.1 M KCl. Scan rate: 50 mV s−1 (vs. SCE). | ||
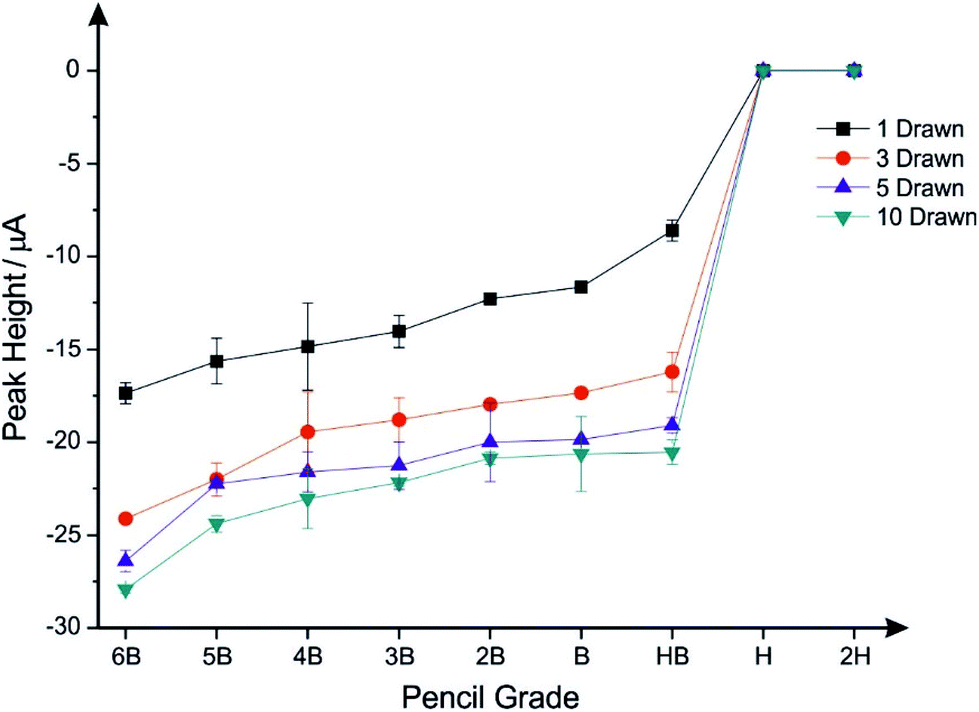 | ||
| Fig. 3 Plots of pencil composition/grade vs. peak height (cathodic current) recorded in 1 mM hexaammineruthenium(III) chloride/0.1 M KCl as a result of increasing the number of draws. Scan rate: 50 mV s−1 (vs. SCE). Data shown is an average and corresponding standard deviation (N = 3). | ||
The electrochemical profiles of the PDEs using the outer-sphere redox couple hexaammineruthenium(III) chloride were explored over a range of voltammetric scan rates (as presented within ESI Fig. 1A†) where a plot of peak height vs. square root of scan rate was constructed and found to be linear, indicating that the electrochemical process at PDEs is diffusionally controlled. Electrochemical characterisation was next explored using the inner-sphere potassium ferricyanide redox probe (ESI Fig. 1B†).27 It is clear, that an unexpected response is observed for this redox couple, suggesting that there is potentially contamination present within the clay (which is a component of the pencil used to draw/construct the PDE) giving rise to an oxidation peak at ∼+0.20 V. As previously reported, the polyester substrate does not affect the overall electrochemical response.28,29 Further analysis of this redox probe was carried out over a range of scan rates; with a plot of peak height vs. square root of scan rate found to being linear, indicating a diffusional controlled electrochemical process.
Next (presented in ESI Fig. 2†), an attempt to electrochemically oxidise potassium ferrocyanide (in 0.1 M KCl) is unsuccessful, and a featureless voltammetric signature is observed, even after carrying out extensive electrochemical pretreatment/cycling of the electrode. Such responses are unlike those seen within the literature by Dossi et al.,17,18 which highlights the variation between different batches of pencils used to fabricated PDEs. It is important to note, that within preliminary experiments the electrochemical oxidation of many electroactive species are successful if an electrochemical reduction step occurs first, (unless the probe is sensitive to surface groups upon the electrode – which is not the case here) severely limiting the overall application of these electrodes. In an attempt to gain a further understanding of the surface characteristics of the PDEs, the redox probe, Fe2+/3+ was considered. This is an inner-sphere probe that is known to be very sensitive to the electrode's surface and its functional groups, especially carbonyl groups. ESI Fig. 3† presents a typical cyclic voltammetric profile of this probe where this PDE platform exhibits a large peak-to-peak separation, ΔEp, of ∼1.0 V. It is postulated that such a large ΔEp, indicates a low percentage of carbonyl groups upon the electrode surface.30,31 This is confirmed with XPS analysis of the PDE (ESI Table 1†) where carbonyl groups correspond to ∼4 atomic%. Thus in summary, the PDEs provide useful electrochemical signatures when outer-sphere probes are utilised (which are sensitive only to the electronic structure of the electrode surface) but are limited in the case of inner-sphere probes (which are sensitive predominately to surface composition, surface groups/surface oxides) due to the composition/surface of the PDEs as evidenced/demonstrated above.
Last, the standard heterogeneous rate constant, k0, was estimated using the PDE established above (6B, ten draws) and was found to correspond to 7.51 × 10⁻⁴ cm s−1 and 4.00 × 10⁻⁷ cm s−1 for hexaammineruthenium(III) chloride and potassium ferricyanide respectively. Such values are extraordinarily slow for potassium ferricyanide, which is likely due to the lack of surface groups available upon this electrode and additionally, the contamination seen in the cyclic voltammograms is likely a contributing factor to the extremely slow electrochemical properties of this PDE.
3.2 Physicochemical characterisation: bulk pencil “lead” and pencil drawn electrode (PDE)
First, characterisation of the bulk 6B pencil “lead” (later used for the fabrication of the PDEs) utilising TEM imaging is shown in Fig. 4. It is clear that the sheets of graphite within the pencil are folded and contain many defects, which could potentially provide useful electrochemical properties. Fig. 4B also shows some areas of potential contamination from the clay utilised within the manufacture process of these pencils. Additionally, indicated within Fig. 4D are areas of few-layer graphene, which may indicate that multi-layer graphene could be potentially fabricated upon the drawing of these electrode systems. Depicted within Fig. 5 are typical SEM images of the hand drawn graphitic surfaces of 6B PDEs, drawn once and ten times, where it is clear that upon the ten layers of pencil the amount of graphite transferred is increased, and upon further magnification the flakes of graphite are visible.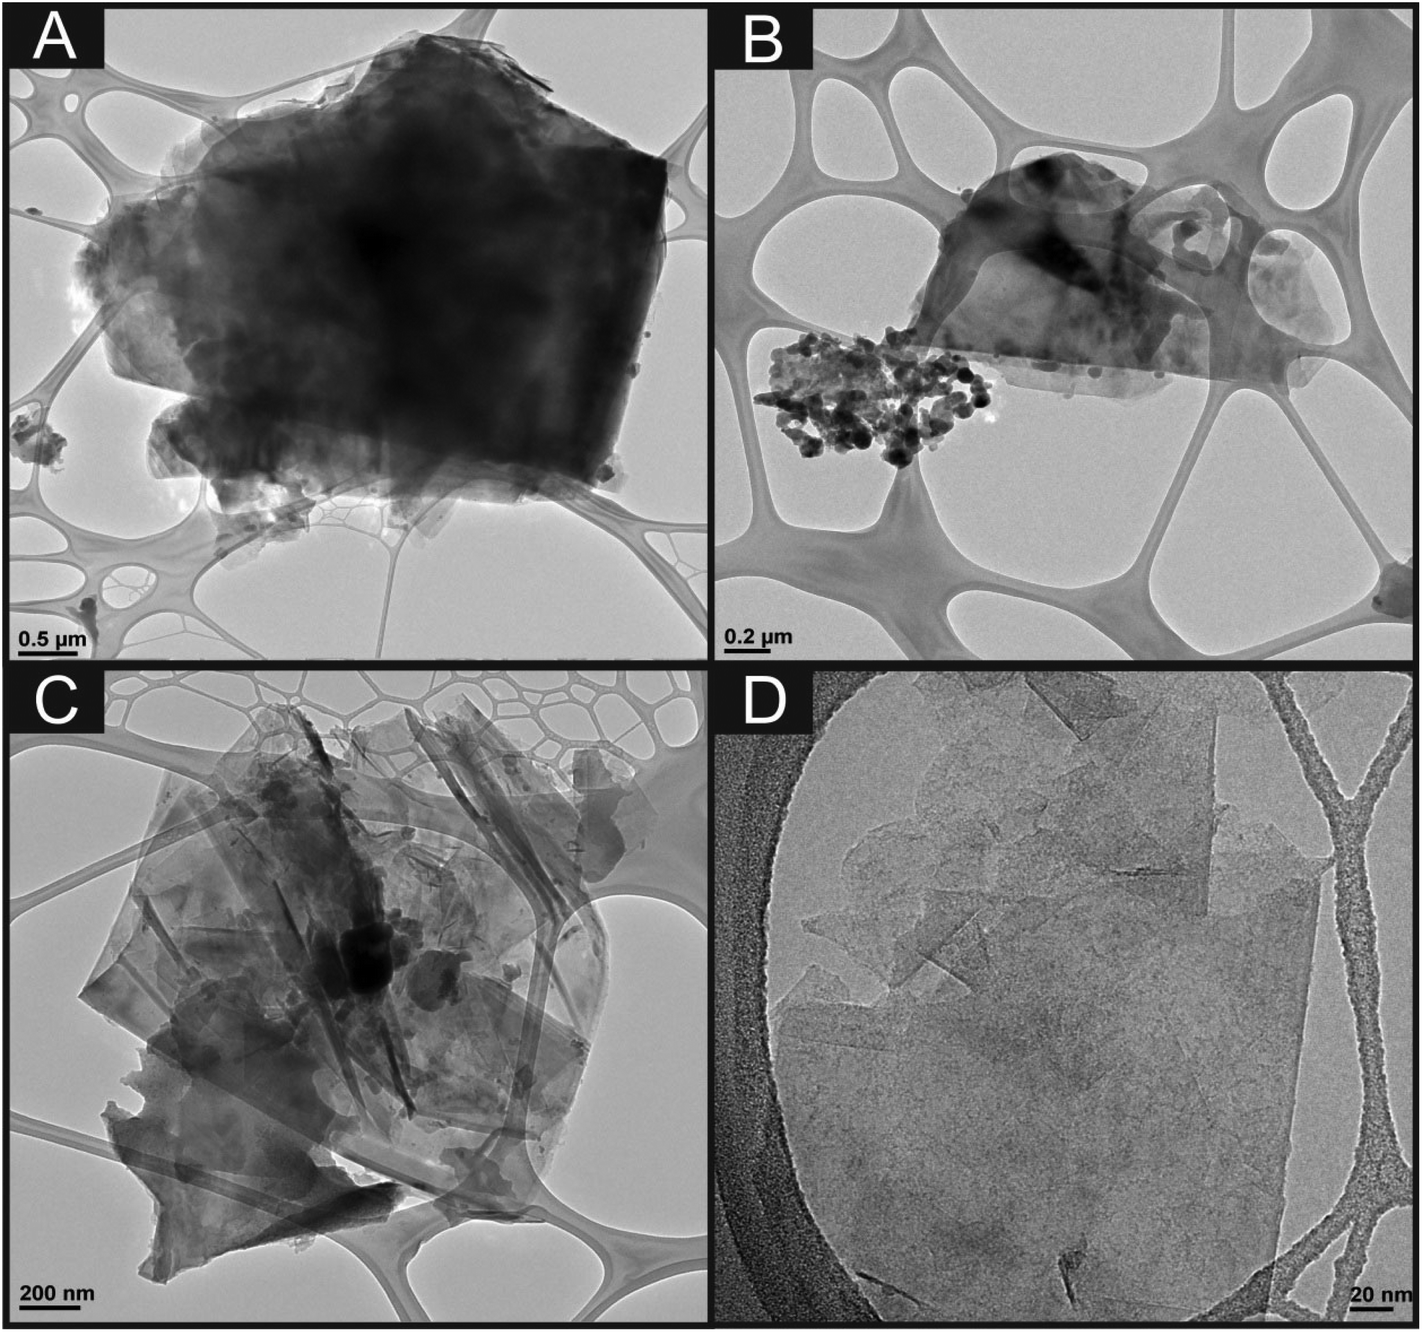 | ||
| Fig. 4 TEM images of the bulk 6B pencil ‘lead’ (used for the fabrication of the PDEs) at increasing magnifications. | ||
 | ||
| Fig. 5 SEM images of 6B PDEs drawn one (A and B) and ten times (C and D). | ||
Raman analysis was next performed and depicted within ESI Fig. 4† where comparative Raman spectra for the bulk 6B pencil “lead” (used to fabricated the PDEs but analysed “as is”) and PDEs drawn once and ten times are presented. Clearly, the transfer of graphite from the pencil to the substrate successfully occurs as electrodes are pencilled in/drawn, which is indicated by the Raman spectra showing high quality graphite, with characteristic D, G and 2D peaks at 1340, 1580 and 2700 cm−1 respectively. In the case of the bulk 6B pencil “lead”, there is a shift of the 2D peak within the Raman spectra to 2980 cm−1, which could be associated with compounds present within the clay/binder support within the pencil. To understand further the transfer of graphite onto the supporting substrate, Raman maps were obtained over a large area of two different 6B PDEs. Fig. 6A and D represent variations within the intensity of the 2D peak at 2750 cm−1 over the area of interest, where it is clear that upon the 6B PDE being drawn ten times the amount of ‘black spots’ are reduced, as the increase of clay/binder from the pencil lead is deposited upon the substrate surface. This is also evident within Fig. 6B and E, where the response from the intensity of the Raman peak has created a three dimensional reconstruction of the 6B PDE surface, representing a relatively smoother surface when the 6B PDE has been drawn ten times, likely from an increase of the binder/clay which is also transferred.
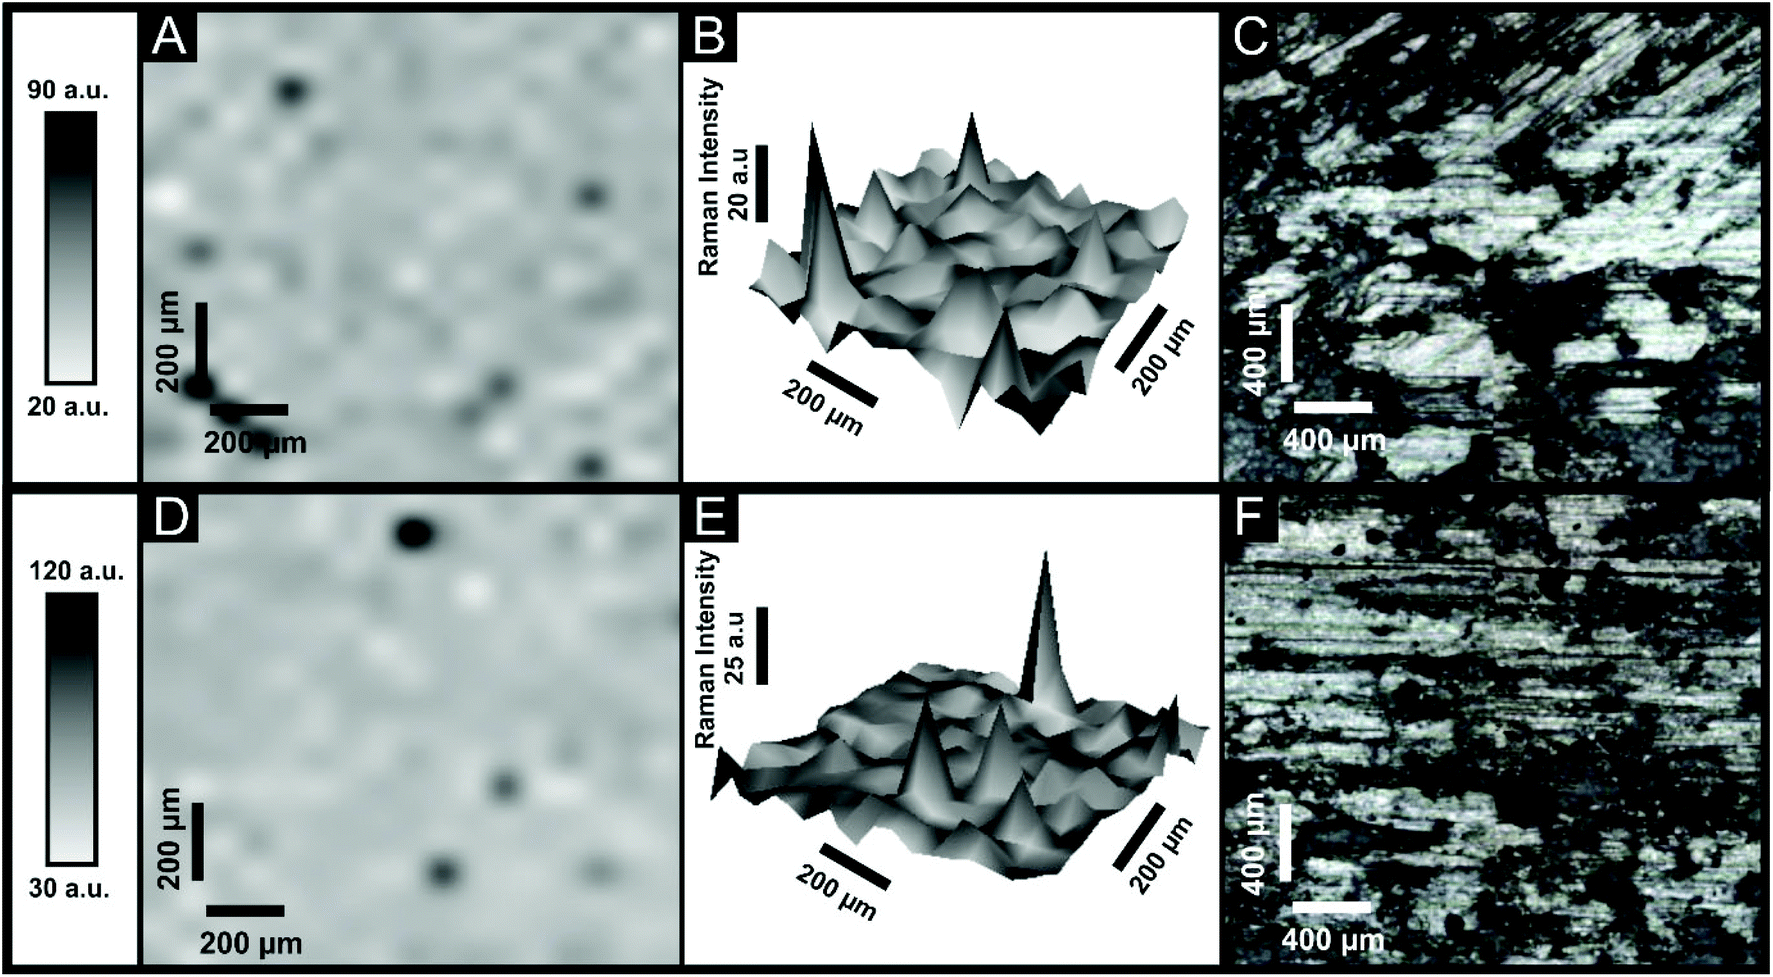 | ||
| Fig. 6 2D (A and D) and 3D (B and E) schematic Raman maps generated from analysis of 6B PDEs drawn one (A, B and C) and ten (D, E and F) times respectively and their corresponding optical images (C and F). Raman intensities were recorded at the characteristic 2D peak occurring ca. 2750 cm−1. | ||
XPS was performed on the bulk 6B pencil lead that is used to fabricate the PDEs, the analysis is reported in ESI Table 1.† Deconvolution of the XPS reveals 91.92% carbon and 7.90% oxygen. Analysis of the spectra (as presented in ESI Table 1†) reveals that the PDEs are dominated by the presence of C–O/C–OH and, to a lesser extent, carboxylic groups. Such analyses agree with the aforementioned electrochemical characterisation. As a benchmark, we consider the XPS analysis of graphitic screen-printed electrodes, as reported by Gomis-Berenguer et al.32 who examined the surface of an edge-plane ‘like’ graphitic screen-printed electrode and revealed the presence of graphitic, C–O and carbonyl functional groups at 284.5 (65.3%), 285.7 (10.5%) and 286.6 (10.1%) eV.32 In comparison to our PDEs there is a clear difference in the composition and the atom percentages. We also note that there are other elements present on the PDEs that possibly originate from within the clay (not identified by XPS). These factors are likely to be the underlying reason that these PDEs can only be explored towards electrochemically reducing probes (see above) and additionally these observations agree with the voltammetric profiles presented in ESI Fig. 1B.†
3.3 Electroanalytical capabilities of the 6B PDE towards p-benzoquinone
Attention was next turned towards utilising the electroactive analyte p-benzoquinone, which is a toxic metabolite of benzene.33,34 It is also important to note that due to its role within biological redox processes, it is a common redox mediator within electrochemistry.35Fig. 7A exhibits a typical cyclic voltammogram utilising the 6B PDE drawn 10 times, where it is apparent that there are oxidation and reduction peaks present at +0.40 V and −0.30 V respectively, that are characteristic of the electrochemical redox process of p-benzoquinone to hydroquinone.35 A plot of peak height vs. the concentration of p-benzoquinone is depicted in Fig. 5B, where the response is found to be linear over the range of 100 to 1000 μM (Ip/μA = 1.50 × 10⁻² μA μM−1 + 1.13 μA; R2 = 0.99; N = 10). The limit of detection (3σ) is found to correspond to 0.31 μM, which is extremely low for this type of electrode system. To our knowledge this is the first study utilising PDEs for the analytical detection of p-benzoquinone.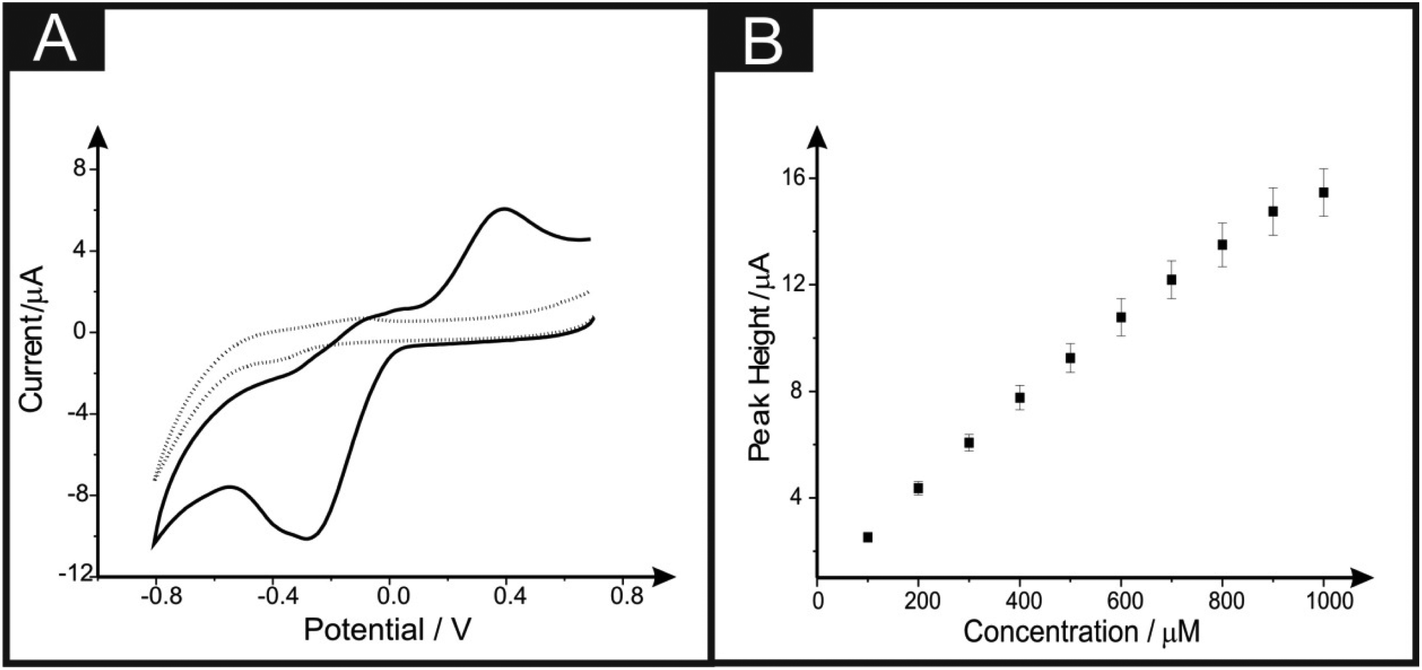 | ||
| Fig. 7 Typical cyclic voltammograms (A) recorded in the absence (dotted line) and presence of 500 μM p-benzoquinone (solid line) within a pH 7.4 phosphate buffer solution. Typical calibration plot (B) corresponding to additions of p-benzoquinone over the range of 100 to 1000 μM into a pH 7.4 phosphate buffer solution. Recorded using a 6B PDE drawn ten times. Error bars indicate the average response and standard deviation (N = 3). Scan rate: 50 mV s−1 (vs. SCE). | ||
3.4 Application of 6B PDE towards the simultaneous sensing of Pb(II) and Cd(II)
The 6B PDE systems are next considered towards the simultaneous sensing of lead(II) and cadmium(II). The reproducibility of the 6B PDEs (drawn 10 ten times) are first explored towards the simultaneous detection of lead(II) and cadmium(II) at concentrations of 150 μg L−1 and 250 μg L−1 respectively, within a model 0.1 M HCl solution. It is clear from ESI Table 2,† that the 6B PDE drawn ten times offers a larger peak current for the electrochemical detection of both analytes when contrasted to the lesser-drawn 6B PDEs. It is also apparent, that such electrodes are extremely reproducible, offering values as low as 4.8% deviation within the peak current.To improve the electrochemical performance of these sensors, inspiration from a recent publication, where the utilisation of a back-to-back design (within model 0.1 M HCl solutions) was undertaken, thus increasing the effective electrode area available for the electrodeposition of lead(II).36Fig. 8 depicts the utilisation of a back-to-back 6B PDE (drawn ten times) towards the simultaneous detection of lead(II) and cadmium(II) over the linear ranges of 10–150 μg L−1 and 98–375 μg L−1 respectively. Calibration plots are linear for both of the chosen analytes: (Pb(II): Ip/μA = 0.042 μA/μg L−1 − 0.275 μA; R2 = 0.99; N = 11; Cd(II) Ip/μA = 0.006 μA/μg L−1 − 0.694 μA; R2 = 0.90; N = 6). Interpretation of these plots indicate that the detection of cadmium(II) is not as sensitive as in the case of the lead(II), however, an improvement within the sensing capabilities is offered, as a response is found at a concentration of 98 μg L−1. This proof-of-concept also shows an improvement within the detection of lead(II), allowing for a detection limit within the range set by the world health organisation37 (10 μg L−1 in model aqueous samples), expressing that this PDE setup has merit for further examination as an electrochemical sensing platform in the future.
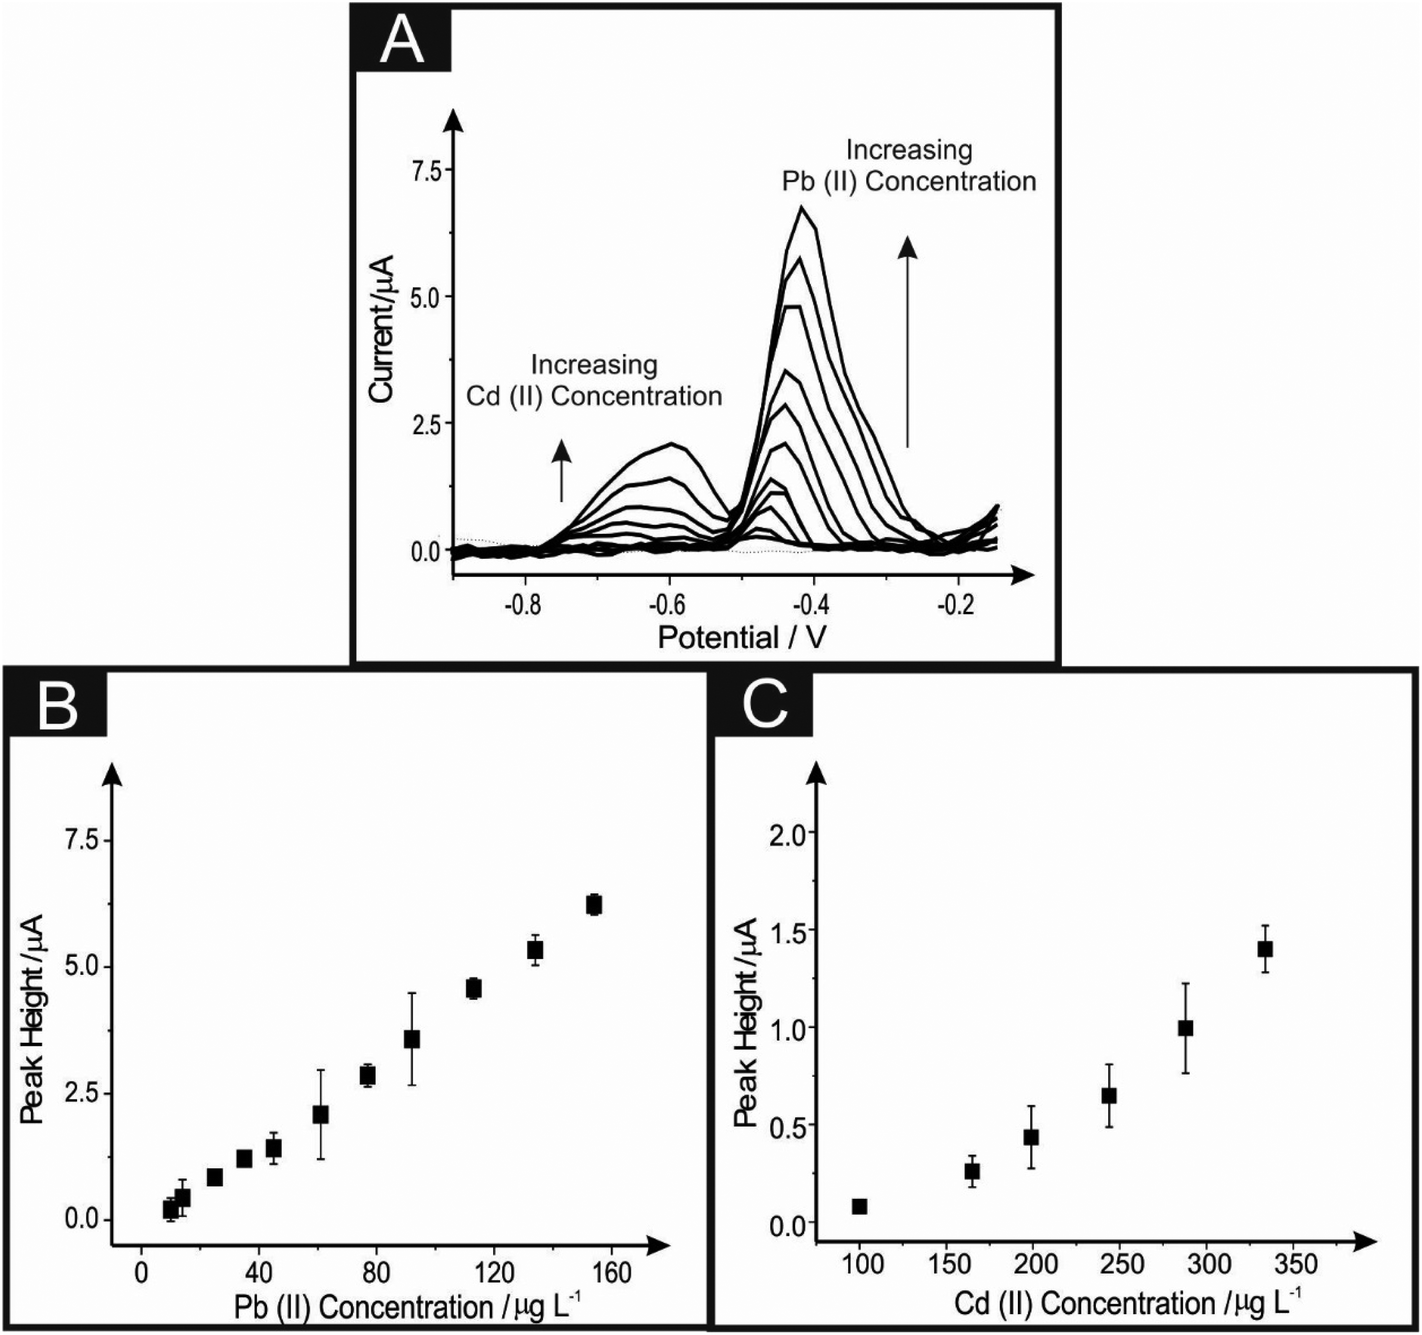 | ||
| Fig. 8 Simultaneous determination of Pb(II) and Cd(II) recorded in 0.1 M HCl (dotted line) utilising a back-to-back 6B PDE drawn ten times. Shown in (A) are the corresponding linear sweep voltammograms with corresponding calibration plots (B) and (C) respectively. Error bars indicate the standard deviation of N = 3. Deposition potential and time: −1.2 V (vs. SCE) and 120 seconds respectively. | ||
4. Conclusions
In this paper, the fabrication, characterisation and implementation of hand-drawn PDE sensors have been considered. This proof-of-concept paper shows that the bulk pencil ‘lead’ can be utilised to create an electrochemical surface, which adheres to a flexible polyester substrate. For the first time, characterisation of the number of drawn pencil layers and the grade of pencil are examined; this is something that is not routinely explored within the literature. Beneficial electroanalytical capabilities were demonstrated towards p-benzoquinone and the simultaneous detection of heavy metals, namely, lead(II) and cadmium(II). Inspired by a recent publication, which utilised a novel back-to-back screen-printed sensor for the enhanced electroanalytical detection of heavy metals (within a model aqueous 0.1 M HCl solution), the exploration of this electrode configuration allowed for these PDE systems to simultaneously detect lead(II) and cadmium(II), at concentrations of 10 μg L−1 and 98 μg L−1 respectively in model aqueous buffer solutions. Such proof-of-concept is promising for potential implementation within the analysis of real world samples; future work is underway. Importantly, limitations are reported herein. Upon reflection of which, these bulk pencil “leads” are not manufactured for the purpose of electrochemical studies and may contain contaminants, which can contribute/hinder the electrochemical signatures available at these PDEs. However, in this report these PDEs provide relatively good electrochemical properties, in a low cost and simplistic fashion, giving them promise as a competitor to similar electrode platforms in the future.Acknowledgements
The authors would like to thank CAPES (Coordenação de Aperfeiçoamento de Pessoal de Nível Superior, process number 4220/14-5) and a British Council Institutional Link grant (no. 172726574) for funding. D. A. C. Brownson acknowledges funding from the Ramsay Memorial Fellowships Trust. E. Bernalte acknowledges funding from Junta de Extremadura (Spain, PO 14021).References
- L. C. S. Figueiredo-Filho, D. A. C. Brownson, O. Fatibello-Filho and C. E. Banks, Analyst, 2013, 138, 4436–4442 RSC.
- K. K. Cline, M. T. McDermott and R. L. McCreery, J. Phys. Chem., 1994, 98, 5314–5319 CrossRef CAS.
- R. J. Bowling, R. T. Packard and R. L. McCreery, J. Am. Chem. Soc., 1989, 111, 1217–1223 CrossRef CAS.
- D. A. C. Brownson, S. A. Varey, F. Hussain, S. J. Haigh and C. E. Banks, Nanoscale, 2014, 6, 1607–1621 RSC.
- D. A. C. Brownson and C. E. Banks, Electrochem. Commun., 2011, 13, 111–113 CrossRef CAS.
- W. Li, C. Tan, M. A. Lowe, H. D. Abruña and D. C. Ralph, ACS Nano, 2011, 5, 2264–2270 CrossRef CAS PubMed.
- I. Dumitrescu, P. R. Unwin and J. V. Macpherson, Chem. Commun., 2009, 6886–6901 RSC.
- M. Pumera, Chem. – Eur. J., 2009, 15, 4970–4978 CrossRef CAS PubMed.
- D. A. C. Brownson, D. K. Kampouris and C. E. Banks, Chem. Soc. Rev., 2012, 41, 6944–6976 RSC.
- K. C. Honeychurch, Anal. Methods, 2015, 7, 2437–2443 RSC.
- N. Vishnu and A. S. Kumar, Anal. Methods, 2015, 7, 1943–1950 RSC.
- D. King, J. Friend and J. Kariuki, J. Chem. Educ., 2010, 87, 507–509 CrossRef CAS.
- J. K. Kariuki, J. Electrochem. Soc., 2012, 159, H747–H751 CrossRef CAS.
- M. d. Vestergaard, K. Kerman and E. Tamiya, Anal. Chim. Acta, 2005, 538, 273–281 CrossRef CAS.
- E. Alipour and S. Gasemlou, Anal. Methods, 2012, 4, 2962–2969 RSC.
- N. Dossi, R. Toniolo, F. Impellizzieri and G. Bontempelli, J. Electroanal. Chem., 2014, 722–723, 90–94 CrossRef CAS.
- N. Dossi, R. Toniolo, A. Pizzariello, F. Impellizzieri, E. Piccin and G. Bontempelli, Electrophoresis, 2013, 34, 2085–2091 CrossRef CAS PubMed.
- N. Dossi, R. Toniolo, F. Terzi, F. Impellizzieri and G. Bontempelli, Electrochim. Acta, 2014, 146, 518–524 CrossRef CAS.
- N. Dossi, R. Toniolo, E. Piccin, S. Susmel, A. Pizzariello and G. Bontempelli, Electroanalysis, 2013, 25, 2515–2522 CrossRef CAS.
- L. C. S. Figueiredo-Filho, D. A. C. Brownson, M. Gomez-Mingot, J. Iniesta, O. Fatibello-Filho and C. E. Banks, Analyst, 2013, 138, 6354–6364 RSC.
- F. E. Galdino, C. W. Foster, J. A. Bonacin and C. E. Banks, Anal. Methods, 2015, 7, 1208–1214 RSC.
- R. S. Nicholson, Anal. Chem., 1965, 37, 1351–1355 CrossRef CAS.
- J. P. Metters, S. M. Houssein, D. K. Kampouris and C. E. Banks, Anal. Methods, 2013, 5, 103–110 RSC.
- I. Lavagnini, R. Antiochia and F. Magno, Electroanalysis, 2004, 16, 505–506 CrossRef CAS.
- C. E. Banks, R. G. Compton, A. C. Fisher and I. E. Henley, Phys. Chem. Chem. Phys., 2004, 6, 3147–3152 RSC.
- Y. S. Grewal, M. J. A. Shiddiky, S. A. Gray, K. M. Weigel, G. A. Cangelosi and M. Trau, Chem. Commun., 2013, 49, 1551–1553 RSC.
- X. Ji, C. E. Banks, A. Crossley and R. G. Compton, ChemPhysChem, 2006, 7, 1337 CrossRef CAS PubMed.
- C. W. Foster, J. P. Metters and C. E. Banks, Electroanalysis, 2013, 25, 2275–2282 CAS.
- C. W. Foster, J. P. Metters, D. K. Kampouris and C. E. Banks, Electroanalysis, 2014, 26, 262–274 CrossRef CAS.
- P. Chen and R. L. McCreery, Anal. Chem., 1996, 68, 3958–3965 CrossRef CAS.
- L. R. Cumba, C. W. Foster, D. A. C. Brownson, J. P. Smith, J. Iniesta, B. Thakur, D. R. do Carmo and C. E. Banks, Analyst, 2016, 141, 2791–2799 RSC.
- A. Gomis-Berenguer, M. Gomez-Mingot, V. Montiel, A. Canals, T. Thiemann, R. O. Kadara, C. E. Banks and J. Iniesta, RSC Adv., 2012, 2, 7735–7742 RSC.
- E. S. Johnson, S. Langård and Y.-S. Lin, Sci. Total Environ., 2007, 374, 183–198 CrossRef CAS PubMed.
- Y. S. Lin, W. McKelvey, S. Waidyanatha and S. M. Rappaport, Biomarkers, 2006, 11, 14–27 CrossRef CAS PubMed.
- D. A. C. Brownson, C. W. Foster and C. E. Banks, Analyst, 2012, 137, 1815–1823 RSC.
- A. P. Ruas de Souza, C. W. Foster, A. V. Kolliopoulos, M. Bertotti and C. E. Banks, Analyst, 2015, 140, 4130–4136 RSC.
- World Health Organisation, Exposure to Lead: A major public health concern, Public Health and Environment, WHO Document Production Services, Geneva, 2010 Search PubMed.
- M. Santhiago, C. S. Henry and L. T. Kubota, Electrochim. Acta, 2014, 130, 771–777 CrossRef CAS.
- H. Yang, Q. Kong, S. Wang, J. Xu, Z. Bian, X. Zheng, C. Ma, S. Ge and J. Yu, Biosens. Bioelectron., 2014, 61, 21–27 CrossRef CAS PubMed.
- C.-W. Lin, Z. Zhao, J. Kim and J. Huang, Sci. Rep., 2014, 4, 3812 Search PubMed.
Footnote |
| † Electronic supplementary information (ESI) available. See DOI: 10.1039/c6an00402d |
| This journal is © The Royal Society of Chemistry 2016 |