 Open Access Article
Development of a new in situ analysis technique applying luminescence of local coordination sensors: principle and application for monitoring metal-ligand exchange processes†
Huayna
Terraschke
*,
Laura
Ruiz Arana
,
Patric
Lindenberg
and
Wolfgang
Bensch
Institute of Inorganic Chemistry, Christian-Albrechts-Universität zu Kiel, Max-Eyth-Straße 2, 24118 Kiel, Germany. E-mail: hterraschke@ac.uni-kiel.de
First published on 15th March 2016
Abstract
Here, we introduce the principle of the novel in situ luminescence analysis of coordination sensor (ILACS) approach for monitoring the formation of solid materials, recording information from the formed solid compounds as well as from the surrounding solutions. This technique utilizes as a main tool the sensitivity of luminescence properties of lanthanide (Ln) ions on the coordination environment, being incorporated as local sensors by the investigated material during synthesis. The luminescence spectra and their environment-dependent developments are monitored in situ from the early stages of the reaction until the final product formation under real conditions with a high time resolution. The ILACS principle is demonstrated here for monitoring the formation of [Eu(phen)2(NO3)3] (phen = 1,10-phenanthroline) and further metal-ligand exchange processes during its conversion to [Sn(phen)Cl4]. These reactions were followed, for instance, analyzing the antenna effect, shift of the 5D0 → 7F4 Eu3+ transition and quenching effects. In addition, these results have been validated by comparison with other in situ techniques. The results demonstrate that ILACS is a new powerful, fast, broadly available in situ characterization method, which is applicable for liquids, amorphous samples, and very small crystallites besides for large crystals.
Introduction
In situ techniques are important for detecting phenomena occurring during chemical reactions, e.g. synthesis of solid materials in liquid media, such as nucleation, crystal growth, formation of (amorphous) intermediates or polymorphic phase transitions.1 Hence, the in situ approach allows the discovery of new metastable compounds, and optimization of synthesis conditions for maximizing product yield or rather avoiding side products, besides providing a new understanding about the hierarchical development of the crystal structure and their related properties in functional materials. Several powerful in situ methods have been reported in the past for studying the mechanisms of chemical reactions like X-ray diffraction (XRD),2–6 pair distribution function (PDF),7–9 X-ray absorption spectroscopy (XAS),10–12 Raman13,14 or infrared (IR)15,16 spectroscopy, nuclear magnetic resonance (NMR)17–19 and mass spectroscopy (MS).20,21 However, XRD does not provide information about local structural arrangements in amorphous materials or liquids and cannot detect side products present in the sample in low concentrations or very small crystallites. For comprehending the formation of solid materials from solutions, it is essential to understand not only the phenomena occurring during crystallization and crystal growth but also the chemical processes in the liquid surroundings, which is not possible by means of XRD-based methods. Even though XAS delivers valuable information about changes in the coordination environment of atoms during synthesis,10–12 it depends on access to synchrotron radiation, drastically reducing its availability. While IR and Raman spectroscopy are more appropriate for organic molecules, recording in situ NMR spectra may take several minutes, and so it is not able to adequately characterize fast phenomena such as nucleation and rapid phase transitions.1Here, we report the development of a novel in situ method for complementing the above-mentioned approaches offering a solution for the respective measurement limitations. The novel in situ luminescence analysis of coordination sensors (ILACS) benefits from the influence of the coordination environment on the optical properties of lanthanide (Ln) ions for obtaining local structural information during e.g. desolvation/ligand exchange, nucleation, crystal growth, phase transitions and further chemical reactions. Applying, for instance, Ce3+ and Eu2+ as coordination sensors, changes in the coordination number, bond length and covalence of chemical bonds to the ligands around these cations can be detected by shifts in their emission spectra, since their 5d → 4f transitions leading to light emission involve the d-electronic states, being therefore, strongly influenced by the crystal field splitting.22–25 In contrast, applying other trivalent lanthanides as coordination sensors, no strong shift in the emission spectrum is expected, because the electrons involved in the 4f → 4f transitions responsible for the emission of light are shielded by the 5s and 5p orbitals of these ions.22,23 Nevertheless, for example for Eu3+, changes in the coordination environment causes slight shifts and changes the splitting behavior of the respective 5D0 → 7FJ (J = 0–6) transition, delivering information about the symmetry around the cation sites.26–29 Moreover, quenching or antenna effects evidence the occurrence of metal-ligand exchange processes especially in organic–inorganic hybrid materials, while the number of signals assigned to the Eu3+ 5D0 → 7F0 transition in Cnv, Cn or Cs symmetries indicates the number of available cation sites for Eu3+ in the crystal structure.30,31 Within the ILACS technique, the suitable coordination sensor is introduced into the investigated material by different approaches like e.g. producing an Ln-based compound itself or incorporating Ln ions in very small amounts by doping them into the studied host lattice. The changes in the optical properties of the local sensors are detected during the reaction by submersing an optical fiber into the reaction vessel, which transports the emitted light to a fast charge-coupled device (ccd)-based detector, achieving a time resolution up to hundreds of spectra per second.
For testing the feasibility of this promising technique, ILACS has been applied here for monitoring metal-ligand exchange processes during synthesis of the luminescent complex [Eu(phen)2(NO3)3]32–34 (phen = 1,10-phenanthroline) and its stability in the presence of other ions. Luminescent complexes are important for the production of security phosphors, sensors or cell markers for bioimaging.35,36 Especially for biomedical applications, the luminescent markers are used under complex media as cell cultures and must remain stable upon the presence of foreign ions. For validating the ILACS method, its results have been compared to other in situ characterization methods applying two different assemblies (1 and 2). The preliminary experiments carried out with assembly 1 (Fig. 1) consist of the combination of the ILACS approach with in situ pH and conductivity measurements. In assembly 2 (Fig. 2), on the other hand, in situ luminescence was combined with in situ XRD and attenuated total reflectance Fourier transform infrared (ATR-FTIR) spectroscopy at beamline P09 at PETRA III (DESY).37 To the best of our knowledge, the simultaneous measurements of in situ luminescence, XRD and IR spectroscopy are reported in this work for the first time.
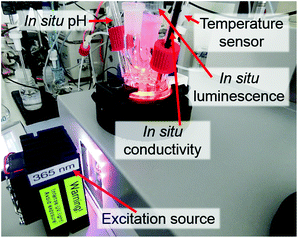 | ||
| Fig. 1 Assembly 1: experimental setup for combining ILACS with in situ pH and conductivity during the synthesis of [Eu(phen)2(NO3)3]. | ||
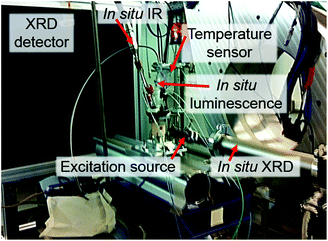 | ||
| Fig. 2 Assembly 2: experimental setup for measuring in situ luminescence at the German Electron Synchrotron DESY in combination with in situ XRD and IR spectroscopy. | ||
Experimental
Materials
As mentioned above, the experiments presented in this work were possible, thanks to the application of two different assemblies (1 and 2). For assembly 1, 5 mL of an 0.269 M ethanolic solution of anhydrous 1,10-phenanthroline (99%, abcr GmbH, Germany) was added to the reactor containing 30 mL of a 0.022 M solution of Eu(NO3)3·6H2O (99.9%, abcr GmbH, Germany). For assembly 2, the Eu(NO3)3·6H2O and phen solutions required an increase of the respective concentrations by a factor of 5, in order to gain the adequate signal intensity for XRD and IR measurements. After approximately 60 minutes, 5 mL of a 1.121 M solution of SnCl2·2H2O (>98%, Sigma-Aldrich Chemie GmbH, Germany) was added to the reactor.Assemblies for in situ measurements
Assembly 1 is composed of a combination of an EasyMax™ reactor system (Mettler Toledo GmbH, Germany) and a separated luminescence setup. In this context, the EasyMax™ reactor system enables the control of the synthesis parameters such as temperature, stirring and dosing as well as monitoring the pH and conductivity during the reaction. The luminescence setup comprises a portable EPP2000 (StellarNet Inc., United States) spectrometer, equipped with a ccd-based detector and an attached optical fiber. This optical fiber is submersed in the contents of the EasyMax™ glass reactor for recording the in situ emission spectra. Excitation of the reactor content was achieved by irradiating UV light by means of light-emitting diodes (LEDs) with wavelengths of 365 nm (Sahlmann Photochemical Solutions, Germany) or 395 nm (Wha Fat Technological Co. Ltd, China) through the observation window of the EasyMax™ reactor system. Even though the glass window and glass reactor wall partially absorb UV light, the intensity of the excitation light was high enough for irradiating the reactor content. A slight red shift for long wavelengths was detected by the applied portable StellarNet spectrometer. However, it was possible to clearly identify the typical 5D0 → 7FJ (J = 1–4) Eu3+ transitions.38Ex situ XRD was measured by using a STOE Stadi-P powder diffractometer (Cu-Kα1 radiation, λ = 1.540598 Å, Ge monochromator) in transmission geometry.For assembly 2, in situ luminescence measurements have been carried out using a USB4000-FL portable spectrometer (Ocean Optics GmbH, Germany), also equipped with a ccd detector. Similarly as for assembly 1, the emission light was transported from the reactor to the detector by using an optical fiber and the sample was excited by using a 395 nm LED from outside the glass reactor. ATR-FTIR spectra were recorded by using a ReactIR45TM spectrometer (Mettler Toledo GmbH, Germany). Here, the peaks of the solvent (ethanol) have been applied as the baseline for highlighting the peaks related to the reagents. In situ XRD measurements were performed in transmission geometry at the beamline P09 of the German Electron Synchrotron (DESY),37 using monochromatic radiation at 22![[thin space (1/6-em)]](https://www.rsc.org/images/entities/char_2009.gif) 999.95 eV (0.053905 nm) and a Perkin-Elmer detector (2048 × 2048 Pixel, detector distance 60.4 cm).
999.95 eV (0.053905 nm) and a Perkin-Elmer detector (2048 × 2048 Pixel, detector distance 60.4 cm).
Results and discussion
Fig. 3 displays the effect of the addition of phen to the Eu(NO3)3 solution on the collected in situ emission, pH and conductivity measurements. Firstly analyzing the initial emission spectra of Eu3+ dissolved in ethanol before the addition of the phen solution (Fig. S1†), broad and weak peaks assigned to the 5D0 → 7FJ (J = 1–4) Eu3+ transitions, massively quenched by the OH vibrations of the solvent molecules39 are observed. Subsequently, upon addition of the phen solution, the intensity of these signals strongly increased, becoming better resolved and indicating a gradual exchange between the ethanol molecules coordinating Eu3+ in the solvation shell against the phen ligand to form [Eu(phen)2(NO3)3] (Fig. S2†). This intensity increase is caused by the antenna effect, in which the excitation energy is widely absorbed by the extensive conjugated π-system of the ligand and transferred to the Eu3+ ion, enhancing its luminescence.23,30 Interestingly, ILACS shows for different experiments, applying for instance the wavelengths of 365 nm (Fig. 3b) and 395 nm (Fig. S3†), that the emission intensity does not immediately increase after the phen addition, but rather after 3–5 minutes, indicating a possible delayed nucleation process for [Eu(phen)2(NO3)3]. This assumption is supported by the ex situ XRD analysis (Fig. S4†), which shows the presence of a crystalline material after a reaction time of t = 5 min. The sample removed from the reactor for e.g. t = 2 min did not provide solid material for ex situ XRD analyses.An additional interesting aspect of examining the time-dependent profile of the intensity of the 5D0 → 7F2 Eu3+ transition is that its increase rate is divided into two parts (I and II, Fig. 3b), suggesting that the crystal growth process may be divided into two different stages. Supplementary analysis of the intensity profile of the excitation light may supply additional information about the reaction, since it indicates changes in the transmittance of the light or rather in the turbidity of the reaction medium during the growth of the solid material. Hence, the decay of the intensity of the excitation light or the increase of the turbidity is divided into two parts (III and IV, Fig. 3b), also evidencing the presence of two distinct growth rates. Finally, the double-rate growth profile is indicated by different increase rates in the in situ pH measurements during the addition of the phen solution for t = 0–10 min. The beginning of crystal growth shown by the extreme increase of the emission intensity (Fig. 3b) is accompanied by a simultaneous peak in the in situ pH curve (Fig. 3c) and a depression of the conductivity (Fig. 3d). The addition of the alkaline 1,10-phenanthroline ligand at t = 1–10 min causes a continuous increase of the pH value of the reaction. In agreement with the in situ luminescence measurements, the Eu(phen)2(NO3)3 product starts to crystallize, incorporating the phen ligands from the solution, causing a decrease of the pH value. The subsequent rise of the pH is triggered by the further addition of the phen solution. When the addition of the phen solution stops at t = 10 min, the profile of the pH curve is mainly governed by the uptake of phen from the solution during crystallization, explaining the pH decrease. It is expected that the acidic nature of the initial Eu(NO3)3 solution promotes the deprotonation of the ligand, favoring high product yield. Similar results are obtained by analogous experiments carried out with assembly 1 by applying a light source with a wavelength of 395 nm (Fig. S3†).
For ex situ XRD experiments, the samples must be recovered from the reactor, quenched, washed and dried, often modifying the structure of the studied compounds. This is a serious problem, especially for the highly soluble [Eu(phen)2(NO3)3], which cannot be easily washed. For this reason, the structural changes around the Eu3+ ions during the formation of [Eu(phen)2(NO3)3] detected by the ILACS technique have been additionally monitored with in situ XRD measurements, carried out directly in the reactor by applying synchrotron radiation. Furthermore, these techniques were supplemented with simultaneous ATR-FTIR spectroscopy, applying the above-mentioned assembly 2. After [Eu(phen)2(NO3)3] was formed, a SnCl2 solution was added to the reactor in order to test the stability of this complex in the presence of foreign ions. If [Eu(phen)2(NO3)3] is stable in the presence of tin ions, SnCl2 could be applied in the future under an inert gas atmosphere for reducing europium to its divalent oxidation state and for synthesizing Eu2+ phenanthroline complexes, monitoring the redox reaction by recording the change between the luminescence of f → f Eu3+ and d → f Eu2+ transitions. This conversion of oxidation states is highly interesting from the technological point of view, since europium d → f transitions are allowed and provide much stronger luminescence than Eu3+ analogous compounds. However, upon the presence of tin ions under the tested conditions in air, [Eu(phen)2(NO3)3] undergoes a further metal-ligand exchange process, resulting in its conversion to [Sn(phen)Cl4] (Fig. S5†). According to the literature,40 Sn4+ ions are formed by the reaction of SnCl2 with atmospheric oxygen in acidic solutions, as demonstrated for the applied solution by the in situ pH analysis in Fig. 3c.
Similarly to the in situ luminescence measurements performed for assembly 1, the exchange of the ethanol ligands against the phen molecules has been initially detected for assembly 2 by the strong enhancement of the emission intensity due to the antenna effect (Fig. 4). Before discussing further details of Fig. 4, it is important to mention that the structural change caused by the formation of the europium complex was additionally detected in the in situ luminescence spectra by means of the shift of the peak assigned to the allowed electric dipole 5D0 → 7F4 Eu3+ transition to higher energies (Fig. 5). This blue shift reveals a larger energy gap between the 5D0 excited and the 7F4 ground state,41 resulting from the stronger interaction between Eu3+ and the phen ligands in [Eu(phen)2(NO3)3] than between Eu3+ and the coordinating ethanol molecules in the solvation shell. The stronger metal-ligand interaction in the europium complex is expected for two main reasons: (i) a slight nephelauxetic effect caused by the coordinating nitrogen atoms of phen molecules22 and (ii) the shorter interatomic distance expected for solid materials due to the lattice strength. The addition of SnCl2 and subsequent formation of [Sn(phen)Cl4] were detected by the strong decrease of the emission intensity until this signal disappeared (Fig. 4). This observation indicates that [Sn(phen)Cl4] is not luminescent or cannot be excited with the same wavelength as applied for [Eu(phen)2(NO3)3].
 | ||
| Fig. 4 In situ luminescence measurements (λex = 395 nm) carried out at DESY during the synthesis of [Eu(phen)2(NO3)3] (assembly 2). | ||
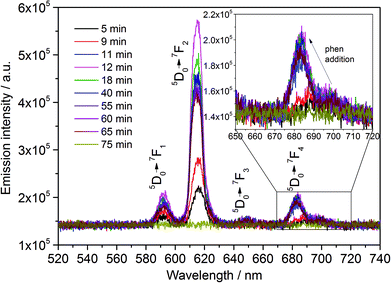 | ||
| Fig. 5 In situ emission spectrum of [Eu(phen)2(NO3)3] (λex = 395 nm) measured with assembly 2. Inset: shift of 5D0 → 7F4 Eu3+ transition upon addition of the phen solution. | ||
The ligand exchange process detected by the ILACS technique was confirmed by simultaneous in situ XRD measurements (Fig. 6). Upon addition of the phen solution, reflections at 3.57, 3.80, 4.13, 4.36, and 5.35° 2θ start to grow, demonstrating the formation of the [Eu(phen)2(NO3)3] complex (Fig. S6†).32,33 After the addition of the SnCl2 solution, the reflections assigned to the europium complex disappear and those of [Sn(phen)2Cl4] appear at e.g. 3.65 and 4.33° 2θ evidencing the formation of the Sn complex.42 The in situ IR spectra (Fig. 7) exhibit signals of the NO3 vibrations43 at e.g. 875, 1024, 1285 and 1516 cm−1 for the initial Eu(NO3)3 solution. After addition of the phen solution, the intensity of these bands decreases, indicating the uptake of the NO3− ions from the solution and incorporation into the solid [Eu(phen)2(NO3)3] complex. On the other hand, after addition of tin, [Sn(phen)Cl4] is formed, releasing the NO3− ions back into the solution causing the increase of the respective IR bands.
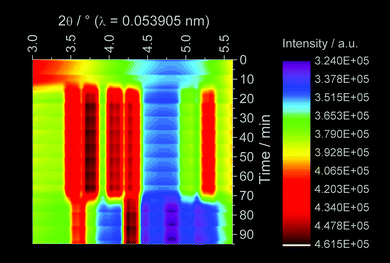 | ||
| Fig. 6 In situ XRD measurements carried out at DESY during the synthesis of [Eu(phen)2(NO3)3] (assembly 2). | ||
 | ||
| Fig. 7 In situ IR spectroscopy measurements carried out at DESY during the synthesis of [Eu(phen)2(NO3)3] (assembly 2). | ||
Conclusions
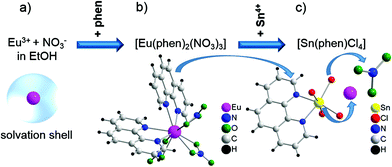
In summary, the ILACS technique could be successfully applied for monitoring the formation of [Eu(phen)2(NO3)3] and its further conversion into [Sn(phen)Cl4], confirmed by supplementary in situ measurements like the pH value, ion conductivity, XRD and IR spectroscopy. As summarized in Scheme 1, these results suggest that the exchange of the ethanol molecules in the solvation shell against the phen ligands and the consequent crystallization of the Eu3+ complex do not occur spontaneously but are fairly delayed. Moreover, the time-dependent profile of the 5D0 → 7F2 Eu3+ intensity indicates that the growth of the europium complex involves not only one but two distinct steps. Upon addition of SnCl2, the phen ligands detach from the Eu3+ ions and coordinate to the in air formed Sn4+ ions40 for the formation of [Sn(phen)Cl4], which was detected by the luminescence extinction, showing the higher affinity of the phen ligands for Sn4+ in comparison with Eu3+. The instability of [Eu(phen)2(NO3)3] against the tin ions require further experiments to find out whether this complex is adequate for applications in complex media as e.g. markers for cell imaging or for being reduced to Eu2+ by the addition of SnCl2 under an inert gas atmosphere. The new in situ luminescence analysis of coordination sensors demonstrated to be a useful tool for detecting metal-ligand exchange processes with a high time-resolution, sensitivity and availability for being independent on synchrotron radiation. Optimization of the technique can be achieved by application of high-performance detectors for improving the resolution of the single spectral lines of the trivalent europium emission, in order to evaluate the symmetry around the Eu3+ ions in more detail.Acknowledgements
The authors thank Prof. Dr C. Wickleder, Prof. Dr Stock, Prof. Dr F. Tuczek, the German Electron Synchrotron (DESY), the MATsynCELL consortium and the German Research Foundation (DFG) within the Priority Program 1415 for the equipment applied in this work. Thanks also to Dr J. Strempfer, Dr N. Pienack, M.Sc. N. Heidenreich, P. Polzin and B. Richter for the help with measurements and fruitful discussions.References
- N. Pienack and W. Bensch, Angew. Chem., Int. Ed., 2011, 50, 2014–2034 CrossRef CAS PubMed and references cited therein.
- W. Bensch, J. Ophey, H. Hain, H. Gesswein, D. Chen, R. Mönig, P. A. Gruberd and S. Indris, Phys. Chem. Chem. Phys., 2012, 14, 7509–7516 RSC and references cited therein.
- R. I. Walton and D. O'Hare, Chem. Commun., 2000, 2283–2291 RSC.
- S. J. Sedlmaier, S. J. Cassidy, R. G. Morris, M. Drakopoulos, C. Reinhard, S. J. Moorhouse, D. O'Hare, P. Manuel, D. Khalyavin and S. J. Clarke, J. Am. Chem. Soc., 2014, 136, 630–633 CrossRef CAS PubMed.
- S. Mitchell, T. Biswick, W. Jones, G. Williams and D. O'Hare, Green Chem., 2007, 9, 373–378 RSC.
- F. Niekiel, J. Lannoeye, H. Reinsch, A. S. Munn, A. Heerwig, I. Zizak, S. Kaskel, R. I. Walton, D. de Vos, P. Llewellyn, A. Lieb, G. Maurin and N. Stock, Inorg. Chem., 2014, 53, 4610–4620 CrossRef CAS PubMed.
- D. Saha, E. D. Bøjesen, K. M. Ø. Jensen, A.-C. Dippel and B. B. Iversen, J. Phys. Chem. C, 2015, 119, 13364–13369 CAS.
- J.-L. Mi, K. M. Ø. Jensen, C. Tyrsted, M. Bremholm and B. B. Iversen, CrystEngComm, 2015, 17, 6868–6877 RSC.
- K. M. Ø. Jensen, M. Christensen, P. Juhas, C. Tyrsted, E. D. Bøjesen, N. Lock, S. J. L. Billinge and B. B. Iversen, J. Am. Chem. Soc., 2012, 134, 6785–6792 CrossRef CAS PubMed.
- M. Bauer and H. Bertagnolli, ChemPhysChem, 2009, 10, 2197–2200 CrossRef CAS PubMed.
- N. Hollingsworth, A. Roffey, H.-U. Islam, M. Mercy, A. Roldan, W. Bras, M. Wolthers, C. R. A. Catlow, G. Sankar, G. Hogarth and N. H. de Leeuw, Chem. Mater., 2014, 26, 6281–6292 CrossRef CAS.
- J. Keating, G. Sankar, T. I. Hyde, S. Koharac and K. Ohara, Phys. Chem. Chem. Phys., 2013, 15, 8555–8565 RSC.
- J. Cornel, C. Lindenberg and M. Mazzotti, Ind. Eng. Chem. Res., 2008, 47, 4870–4882 CrossRef CAS.
- G. J. Vergote, C. Vervaet, J. P. Remon, T. Haemers and F. Verpoort, Eur. J. Pharm. Sci., 2002, 16, 63–67 CrossRef CAS PubMed.
- P. Kubanek, H.-W. Schmidt, B. Spliethoff and F. Schüth, Microporous Mesoporous Mater., 2005, 77, 89–96 CrossRef CAS.
- P. Kubanek, O. Busch, S. Thomson, H. W. Schmidt and F. Schüth, J. Comb. Chem., 2004, 6, 420–425 CrossRef CAS PubMed.
- O. B. Vistad, D. E. Akporiaye, F. Taulelle and K. P. Lillerud, Chem. Mater., 2003, 15, 1639–1649 CrossRef CAS.
- G. Férey, M. Haouas, T. Loiseau and F. Taulelle, Chem. Mater., 2014, 26, 299–309 CrossRef.
- M. Haouas, C. Volkringer, T. Loiseau, G. Férey and F. Taulelle, Chem. Mater., 2012, 24, 2462–2471 CrossRef CAS.
- B. Bastian Schaack, W. Schrader, A. Corma and F. Schüth, Chem. Mater., 2009, 21, 4448–4453 CrossRef.
- S. A. Pelster, W. Schrader and F. Schüth, J. Am. Chem. Soc., 2006, 128, 4310–4317 CrossRef CAS PubMed.
- W. M. Yen, H. Yamamoto and S. Shionoya, in Phosphor Handbook, CRC Press Laser and Optical Science and Technology, Boca Raton, 2006 Search PubMed.
- G. Blasse, in Luminescent Materials, Springer, Berlin, 1994 Search PubMed.
- H. Terraschke, M. Suta, M. Adlung, S. Mammadova, N. Musayeva, R. Jabbarov, M. Nazarov and C. Wickleder, J. Spectrosc., 2015, 2015, 541958 Search PubMed.
- H. Terraschke and C. Wickleder, Chem. Rev., 2015, 115, 11352–11378 CrossRef CAS PubMed and references cited therein.
- C. Görller-Walrand and K. Binnemans, in Handbook on the Physics and Chemistry of Rare Earths, ed. K. A. Gschneidner Jr. and L. Eyring, Elsevier Science B. V., 1998, vol. 25, pp. 101–264 Search PubMed.
- S. T. Frey and W. D. Horrocks Jr., Inorg. Chim. Acta, 1995, 229, 383–390 CrossRef CAS.
- K. Binnemans and C. Görller-Walrand, Chem. Phys. Lett., 1995, 245, 75–78 CrossRef CAS.
- C. V. Rodrigues, L. L. Luz, J. D. L. Dutra, S. A. Junior, O. L. Malta, C. C. Gatto, H. C. Streit, R. O. Freire, C. Wickleder and M. O. Rodrigues, Phys. Chem. Chem. Phys., 2014, 16, 14858–14866 RSC.
- H. C. Streit, M. Adlung, O. Shekhah, X. Stammer, T. Ladnorg, H. Gliemann, M. Franzreb, Ch. Wöll and C. Wickleder, ChemPhysChem, 2012, 13, 2699–2702 CrossRef CAS PubMed.
- K. Binnemans, Coord. Chem. Rev., 2015, 295, 1–45 CrossRef CAS.
- Y. Fan and P. Yang, J. Phys. Chem., 1996, 100, 69–74 CrossRef CAS.
- A. G. Mirochnik, B. V. Bukvetskii, P. A. Zhikhareva and V. E. Karasev, Russ. J. Coord. Chem., 2001, 27, 443–448 CrossRef CAS.
- F. Werner, K. Tada, A. Ishii, M. Takata and M. Hasegawa, CrystEngComm, 2009, 11, 1197–1200 RSC.
- L. Armelao, S. Quici, F. Barigelletti, G. Accorsi, G. Bottaro, M. Cavazzini and E. Tondello, Coord. Chem. Rev., 2010, 254, 487–505 CrossRef CAS and references cited therein.
- Q. Zheng, H. Dai, M. E. Merritt, C. Malloy, C. Y. Pan and W.-H. Li, J. Am. Chem. Soc., 2005, 127, 16178–16188 CrossRef CAS PubMed.
- J. Strempfer, S. Francoual, D. Reuther, D. K. Shukla, A. Skaugen, H. Schulte-Schrepping, T. Kracht and H. Franz, J. Synchrotron Radiat., 2013, 20, 541–549 CrossRef CAS PubMed.
- G. H. Dieke, in Spectra and energy levels of RE ions in crystals, Wiley, New York, 1968 Search PubMed.
- T. Moon, S.-T. Hwang, D.-R. Jung, D. Son, C. Kim, J. Kim, M. Kang and B. Park, J. Phys. Chem. C, 2007, 111, 4164–4167 CAS.
- A. F. Holleman, E. Wiberg and N. Wiberg, in Lehrbuch der Anorganischen Chemie, Walter de Gruyter, Berlin, 102nd edn, 2007, p. 1014 Search PubMed.
- W. Jiang, J. Zhang, W. Chen, P. Chen, J. Han, B. Xu, S. Zheng, Q. Guo, X. Liu and J. Qiu, J. Appl. Phys., 2014, 116, 123103 CrossRef.
- D. L. Perry and R. A. Geanangel, J. Inorg. Nucl. Chem., 1974, 36, 205–206 CrossRef CAS.
- M. Gaye, F. B. Tamboura and A. S. Sall, Bull. Chem. Soc. Ethiop., 2003, 17, 27–34 CrossRef CAS.
Footnote |
| † Electronic supplementary information (ESI) available: In situ luminescence spectra, X-ray diffraction patterns and scanning electron images. See DOI: 10.1039/c6an00075d |
| This journal is © The Royal Society of Chemistry 2016 |


