 Open Access Article
A fluorescent nanoprobe for single bacterium tracking: functionalization of silver nanoparticles with tryptophan to probe the nanoparticle accumulation with single cell resolution†
R.
Dojčilović
a,
J. D.
Pajović
b,
D. K.
Božanić
*a,
V. V.
Vodnik
a,
S.
Dimitrijević-Branković
c,
A. R.
Milosavljević
d,
S.
Kaščàkovà
ef,
M.
Réfrégiers
g and
V.
Djoković
*a
aUniversity of Belgrade, Vinča Institute of Nuclear Sciences, P.O. Box 522, 11001 Belgrade, Serbia. E-mail: bozanic@vinca.rs; djokovic@vinca.rs
bUniversity of Belgrade, Faculty of Physics, P.O. Box 368, 11001 Belgrade, Serbia
cUniversity of Belgrade, Department of Bioengineering and Biotechnology, Faculty of Technology and Metallurgy, Karnegijeva 4, 11120 Belgrade, Serbia
dUniversity of Belgrade, Institute of Physics Belgrade, Pregrevica 118, 11080 Belgrade, Serbia
eUniversity Paris-Sud 11, UMR-S785, F-94800 Villejuif, France
fInser U785, F-94800 Villejuif, France
gDISCO Beamline, Synchrotron SOLEIL, F-91192 Gif sur Yvette, France
First published on 27th January 2016
Abstract
The investigation of the interaction of silver nanoparticles and live bacteria cells is of particular importance for understanding and controlling their bactericidal properties. In this study, the process of internalization of silver nanoparticles in Escherichia coli cells was followed by means of synchrotron excitation deep ultraviolet (DUV) fluorescence imaging. Antimicrobial nanostructures that can absorb and emit light in the UV region were prepared by functionalization of silver nanoparticles with tryptophan amino acid and used as environmentally sensitive fluorescent probes. The nanostructures were characterized by morphological (TEM) and spectroscopic methods (UV-vis, FTIR, XPS, and photoluminescence). The TEM images and the analyses of the UV-vis spectra suggested that the addition of tryptophan led to the formation of hybrid nanostructures with pronounced eccentricity and larger sizes with respect to that of the initial silver nanoparticles. The DUV imaging showed that it was possible to distinguish the fluorescent signal pertaining to silver–tryptophan nanostructures from the autofluorescence of the bacteria. The spatial resolution of the fluorescence images was 154 nm which was sufficient to perform analyses of the accumulation of the nanostructures within a single bacterium. The DUV imaging results imply that the tryptophan-functionalized silver nanoparticles interact with cell membranes via insertion of the amino acid into the phospholipid bilayer and enter the cells.
1. Introduction
Silver nanoparticles are efficient antimicrobial agents with low toxicity1–3 and their antimicrobial activity was tested against different pathogen strains, including Gram-positive and Gram-negative bacteria as well as yeast species.4–6 The details of the mechanisms of antimicrobial action of silver nanoparticles still remain to be recognized; however, several studies have demonstrated that silver ions released from the nanoparticles interact with the sulfhydryl and phosphate groups of outer membrane proteins leading to dysfunction in their permeability, enzymatic signalling activity and respiratory processes.1,7,8 The investigations by Lok et al.9 showed that partially oxidized silver nanoparticles exhibit antimicrobial properties, whereas zero-valent nanoparticles do not. This was further confirmed in a more recent study by Xiu et al.10 that proved negligible ‘particle-specific’ effects of silver nanoparticles in comparison with the antimicrobial activity of silver ions released from the particles. Therefore, silver nanoparticles can be regarded as ‘carriers’ of Ag+ ions that, by using an appropriate surface modification, can deliver the antimicrobial agent to a specific cell location of the microorganism under study. For this reason, the investigations of the nanoparticle spatial distribution within the microbial cells are of particular importance for understanding their biological activity. The present study is focused on the interaction of silver nanoparticles and Escherichia coli cells, and on the intracellular accumulation of the particles within the microorganism.E. coli is a rod-shaped (approximately 0.5 μm by 2 μm) Gram-negative bacterium which possesses a complex cell envelope consisting of an outer membrane – a lipid bilayer composed of lipopolysaccharides and phospholipids, an aqueous and protein rich periplasm, a peptidoglycan cell wall, and an inner cytoplasmic membrane, which is a phospholipid bilayer.11 The interactions between the silver nanoparticles and Gram-negative bacteria were extensively studied by electron microscopy techniques.7,12–15 The investigations of this type assert that the nanoparticles attach to the cell surface. In addition, the observations of thin cross-sections of E. coli cells incubated with silver nanoparticles7,14 showed that the particles can penetrate the microorganism. We tried to probe the interaction of silver nanoparticles with live E. coli cells and for that reason we used a non-invasive optical deep ultraviolet (DUV) fluorescence imaging method.16–20 This technique allows excitation of fluorophores below 300 nm that is a major advantage in terms of the resolution of fluorescence images in comparison with conventional imaging techniques. In our latest study,20 we developed a method for functionalization of gold nanoparticles with UV fluorescent tryptophan biomolecules. The obtained hybrid nanostructures emitted radiation in the UV region that provided the detection of the nanostructures within bacteria by the DUV fluorescence imaging technique with high spatial resolution (one pixel ∼150 nm).
In this article, we present a similar approach for the investigation of the spatial distribution of antimicrobial tryptophan capped silver nanoparticles in E. coli cells. It will be shown that, unlike with gold nanoparticles, the tryptophan molecules interact with silver surfaces mainly via carboxyl groups leaving indole groups oriented away from the surface. Since the fluorescence of tryptophan depends on the polarity of the environment,21 the luminescence of in this way prepared tryptophan capped silver nanoparticles was environmentally sensitive as well. This feature enabled us to distinguish, with respect to the cell membrane, the sites where the accumulation of the functionalized antimicrobial nanostructures takes place. In addition, the functionalization of silver nanoparticles with tryptophan provides not just specific optical properties, but offers several other advantages. For example, E. coli produces membrane transport proteins that transport tryptophan into cells,22,23 and therefore the functionalization of the nanoparticles with the amino acid can facilitate the diffusion of the nanoparticles into the cells. Also, a recent study24 showed that tryptophan residues in designed antimicrobial peptides penetrate cell membranes and improve the antimicrobial activity of the peptides. The internalization of the Ag–Trp nanostructures by bacteria was studied in the [327–353 nm], [370–410 nm], and [452–486 nm] wavelength ranges at DISCO beamline of synchrotron SOLEIL. Using a monochromatic synchrotron beam as an excitation source allowed detection of low concentrations of molecules emitting in the UV domain with high signal-to-noise ratio.16,17
2. Experimental
2.1 Materials
Silver nitrate (AgNO3), sodium borohydride (NaBH4), sodium hydroxide (NaOH) and tryptophan (Trp) were purchased from Sigma-Aldrich and used as received. High purity water (specific resistance ∼1018 Ωm) was used in all synthetic procedures.2.2 Synthesis of tryptophan functionalized Ag NPs
Silver hydrocolloids (Ag NPs) were prepared by chemical reduction of AgNO3 (0.1 mM) by NaBH4, as described elsewhere.25,26 Tryptophan-functionalized silver (AgTrp) nanoparticles were prepared by adding an appropriate amount of 1 ml Trp aqueous solution into 10 ml of silver colloid with the pH value adjusted to 10.4 by addition of 0.1 M NaOH solution. The mixture was stirred for 30 minutes and subsequently investigated. The list of the samples prepared, their labels and the amount of chemicals used are given in the Table 1. A fresh batch of samples was prepared using the same conditions prior to all analyses.Hydrophobic indole side groups of tryptophan allowed for initial assessment of the efficiency of the functionalization of silver nanoparticles by the amino acid by transferring silver hydrocolloids into an organic solvent. These tests were performed by adding 1 ml of toluene into 5 ml of the AgTrp2.0 colloid, placed in the glass test tubes, and subsequent shaking of the tubes to inspect whether the phase transfer of the nanostructures into the organic solvent occurs.
2.3 Experimental techniques
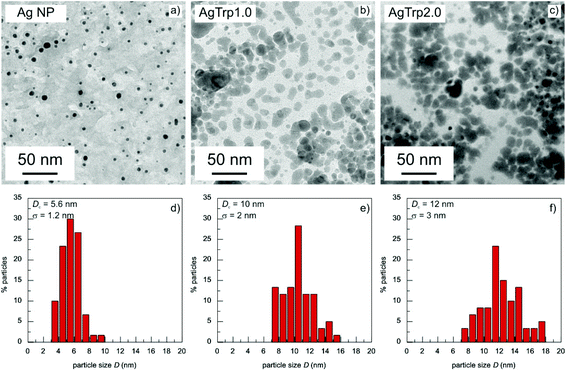
The morphology of the Ag and AgTrp nanostructures was investigated by transmission electron microscopy (Jeol JEM-1400 instrument) at 120 kV operating voltage. Aqueous dispersions of the colloids were deposited on carbon coated copper grids using an automatic pipette. The samples were left to dry under ambient conditions before they were transferred to the TEM chamber. The distribution of particle sizes was determined by measuring the diameters of the equivalent circular area of at least 100 observed particles.The UV–vis absorption measurements of the aqueous dispersions were carried out on a Thermo Evolution 600 spectrophotometer.
The chemical stability of Ag and AgTrp hydrocolloids in the presence of saline (0.9% NaCl) was investigated by UV-vis spectroscopy. For these analyses, 4 ml of the as prepared Ag NP, AgTrp1.0 or AgTrp2.0 colloid was mixed with 1 ml of saline. The mixtures were incubated at 37 °C and subsequently measured by UV-vis.
FTIR spectroscopy was carried out at room temperature using a Nicolet 380 spectrophotometer in the spectral range of 4000–400 cm−1, with a resolution of 4 cm−1. The datasets were averaged over 200 scans. In these analyses, the samples were 150 mg KBr pellets that contained 2 mg of the sample.
The photoluminescence spectra of aqueous tryptophan solution and AgTrp colloids were recorded using a PerkinElmer LS45 fluorescence spectrophotometer.
X-ray photoelectron spectroscopy (XPS) experiments were performed on a Physical Electronics Quantum 2000 instrument using Al Kα radiation (1486.6 eV). The spectra of C 1s, O 1s, Ag 3d, and N 1s core levels were recorded at 29.35 eV pass energy and at 55° take-off angle. The peak shift due to charge accumulation was corrected using the C 1s level at 284.4 eV as an internal standard.27 The XPS peaks are assumed to be linear combinations of Lorentzian and Gaussian line shapes and were resolved into individual components after proper subtraction of the baseline using the Shirley background subtraction method.
2.4 Antimicrobial activity
The quantitative testing of AgNP, AgTrp1.0 and AgTrp2.0 antimicrobial activity was assessed in a potassium hydrogen phosphate buffer solution (pH 7.00). For inoculum preparation, the microorganisms were cultivated in TSYB at 37 °C and left overnight (late exponential stage of growth). The solutions with specific concentrations of silver were obtained by mixing the colloids with sterile physiological saline solutions (see ESI, Table S1†). Thereafter, 400 μl of the solutions were placed in Eppendorf tubes containing 100 μl of microbial inoculum. The resulting mixture was vortexed for 10 s and incubated at 37 °C in a water bath shaker. After 2 h, the dispersions were placed in Petri dishes, overlaid with TSYA (0.6% of agar–agar in Trypton soy broth) and after 24 h of incubation at 37 °C, the counts of viable microorganisms were determined. The percentage of reduction of the microbial cells (R,%) was calculated using the following equation:where CFUcont and CFUcoll are the numbers of colony forming units per millilitre for the control and the silver colloid solutions, respectively.
All experiments were performed in triplicates and the results are shown as mean values. Data were analysed using analysis of variance (one-way ANOVA) and the Tukey test was applied as a test for comparison of mean values with a significance level of 0.1.
2.5 Preparation of biological samples
The results of antimicrobial activity presented in the ESI (Table S1†) have shown that the total inhibition of the microbial growth takes place when the concentration of silver exceeded 2.16 μg ml−1. For the incubation of the bacteria with AgTrp colloids, we decided to use higher concentration of 8.64 μg ml−1, since increasing the number of particles would increase the probability of interaction with a larger number of cells. Although this high concentration of the colloid would eventually induce complete inhibition of bacterial growth, the experiments were performed immediately after incubation while a significant number of the bacteria were still alive. The biological samples were prepared by adding different volume ratios of AgTrp1.0 or AgTrp2.0 colloids and saline into 100 μl of purified Escherichia coli (ATCC 25922) saline dispersion. Upon mixing, the samples were incubated at 37 °C for 2 h. After that, 10 μl of each sample were placed on quartz coverslips, dried under ambient conditions and immediately examined by DUV fluorescence imaging. The control samples were prepared using the same procedures and conditions, but without adding the colloid.The procedure for the quantitative determination of the number of colonies was repeated for the samples used in the DUV fluorescence imaging test. After two hours of incubation, the samples were centrifuged at 7000 rpm in order to precipitate the live cells. The precipitated cells were dispersed in TSYB and the number of colonies was found to be 1 × 10² CFU ml−1 (the initial number of colonies was 1 × 10⁶ CFU ml−1). After 20 hours in TSYB, the number of colonies increased to 36 × 106 CFU ml−1 proving that the certain number of cells survived the incubation. An image of the test tubes with TSYB immediately after mixing with the precipitated cells and after 20 h at 37 °C is shown in ESI, Fig. S2.†
The uptake of the nanoparticles by E. coli cells was determined by measuring the intensity of the surface plasmon resonance peak of silver nanoparticles before and after interaction with bacteria. The uptake was about 10%.
It is important to emphasise that silver ions in saline solution will complex and form AgCl that will lead to a decrease in silver concentration in the system. Our chemical stability measurements (ESI, Fig. S3†) suggest that this decrease in the concentration is approximately 40% and 10% of the initial values for AgTrp1.0 and AgTrp2.0, respectively. The tryptophan obviously prevents the complexation of silver to a certain extent, which improves the stability of the nanoparticles in the saline solution.
2.6 Synchrotron DUV imaging
DUV fluorescence imaging of live E. coli cells and live E. coli cells incubated with AgTrp colloids was performed at DISCO beamline of SOLEIL synchrotron facility (France). The fluorescence images were collected on the TELEMOS endstation of DISCO by acquiring the luminescence signals in the [327–353 nm], [370–410 nm], and [452–486 nm] wavelength ranges for 6 minutes upon illumination of the samples with λexc = 280 nm synchrotron radiation. Each sample was prepared three times and at least 6 different locations (150 × 75 μm) were investigated for each sample to ensure the consistency of the observations. To avoid the effects of photobleaching on the intensity of the fluorescence signal, the images on each of the locations were acquired for only two sets of conditions. The images were collected through a 100× ultrafluar objective (Zeiss, Germany). Under these conditions, the pixel size on the fluorescence images projected on the camera chip of a PIXIS 1024 BUV camera (Princeton, USA) corresponds to 154 nm. The images were analysed by using FIJI software.283. Results and discussion
3.1 Characterization of tryptophan-functionalized silver nanoparticles
The efficiency of the functionalization of the silver nanoparticles by the amino acid was first tested by phase transfer of the colloid from water into an organic solvent. If the tryptophan was attached to the surface of the nanoparticles, the phase transfer may occur due to the presence of hydrophobic indole side groups. The tests were performed by mixing 1 ml of toluene with 5 ml of Ag NPs or AgTrp2.0 colloid in the glass test tubes, followed by vigorous shaking of the tubes for 5 minutes. The photographs of the vials containing Ag NPs and AgTrp2.0 colloids with and without toluene are presented in ESI, Fig. S1.† The phase transfer into an organic phase was observed solely in the case of the functionalized silver nanoparticles, indicating efficient capping of their surfaces by the amino acid.![[thin space (1/6-em)]](https://www.rsc.org/images/entities/char_2009.gif) :
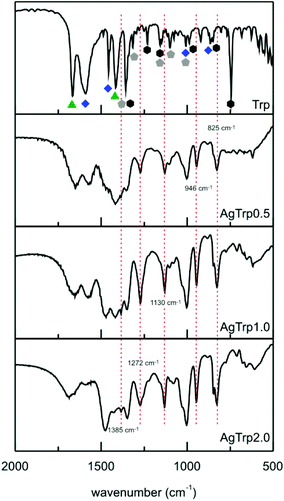
:![[thin space (1/6-em)]](https://www.rsc.org/images/entities/char_2009.gif) Trp molar ratio. With an increase in the amount of Trp, the relative intensity of the 1415 cm−1 line, that corresponds to a symmetric stretching of the carboxyl ion, decreases with respect to the bands at 1457 cm−1 (βsNH3+) and 1357 cm−1 (βCH of indole). This result can be correlated to the observed aggregation of the nanoparticles upon addition of tryptophan.
Trp molar ratio. With an increase in the amount of Trp, the relative intensity of the 1415 cm−1 line, that corresponds to a symmetric stretching of the carboxyl ion, decreases with respect to the bands at 1457 cm−1 (βsNH3+) and 1357 cm−1 (βCH of indole). This result can be correlated to the observed aggregation of the nanoparticles upon addition of tryptophan.
The FTIR bands pertaining to α-amine and indole groups also differ in the spectra of the amino acid and the AgTrp samples. The lines at 3405 cm−1 (νNH(r), indole) and 744 cm−1 (βH(R), benzene ring) almost disappear upon the functionalization, indicating that silver–tryptophan interaction takes place via secondary amines of pyrrole and delocalized π-orbitals of benzene. In the case of the vibrations attributed to the deformations of α-amine, the bands shift toward lower wavenumbers and decrease in the intensity with an increase in the Ag![[thin space (1/6-em)]](https://www.rsc.org/images/entities/char_2009.gif) :
:![[thin space (1/6-em)]](https://www.rsc.org/images/entities/char_2009.gif) Trp molar ratio. The vibration spectra of AgTrp show additional lines that were not observed in the spectrum of the pure amino acid (dotted lines in Fig. 2). New bands at 3482 cm−1 and 3361 cm−1 can be attributed to the stretching vibrations of protonated α-amine, while the lines at 1385 cm−1 and 825 cm−1 correspond to stretching and deformation vibrations of the carboxyl group. The bands positioned at 1272 cm−1, 1130 cm−1, and 946 cm−1 represent new modes originating from the indole group. The presented analysis of the FTIR spectra shows that tryptophan molecules interact with silver nanoparticles via all available functional groups. This conclusion is in agreement with the previous studies on the interaction of tryptophan with silver nanoparticles.29
Trp molar ratio. The vibration spectra of AgTrp show additional lines that were not observed in the spectrum of the pure amino acid (dotted lines in Fig. 2). New bands at 3482 cm−1 and 3361 cm−1 can be attributed to the stretching vibrations of protonated α-amine, while the lines at 1385 cm−1 and 825 cm−1 correspond to stretching and deformation vibrations of the carboxyl group. The bands positioned at 1272 cm−1, 1130 cm−1, and 946 cm−1 represent new modes originating from the indole group. The presented analysis of the FTIR spectra shows that tryptophan molecules interact with silver nanoparticles via all available functional groups. This conclusion is in agreement with the previous studies on the interaction of tryptophan with silver nanoparticles.29
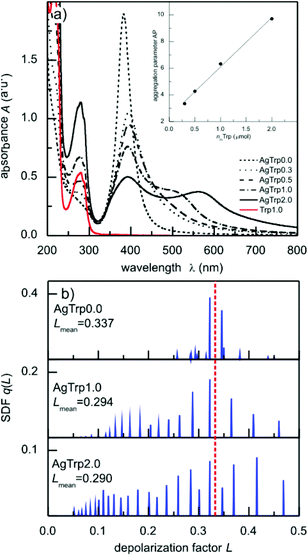
where S and S0 are the areas under the absorption curve between 450 and 700 nm in the case of AgTrp and AgNP colloids, respectively. The dependence of the aggregation parameter on the amount of tryptophan (nmTrp) in the system is presented in the inset to Fig. 3a. It can be seen that the Ap values increase as the content of the amino acid increases and, in the range of concentrations analysed here, the dependence follows a linear equation Ap = 2.4(2) + 3.7(2) nmTrp (μmol).
The contribution of different particle morphologies and configurations to the experimental absorption spectra of AgTrp colloids was estimated by evaluating spectral density functions (SDF) q(L). The absorption spectrum A(λ) of the colloid, containing nanoparticles of average size D, was expressed as a sum over a continuum of particles, each with a depolarization factor L,
In the preceding relation, λ stands for the wavelength of the incident light, while the functions x(λ) = πnD/λ and t(λ) = n2/(ε(λ) − n2) depend on the refractive index of the environment (water, n = 1.33) and the complex dielectric function of silver nanoparticles ε(λ). The ε(λ) values were obtained from the Hao and Nordlander fit30 of the Johnson and Christy experimental data for bulk silver31 and corrected for small particle sizes according to the relation proposed by Hovel et al.32 The SDF q(L) was calculated in the L ∈ (0,1) range of the depolarization factors using constrained least squares method33 with conditions (∀L ∈ (0,1))q(L) ≥ 0 and  . Obtained spectral density functions for the absorption spectra of AgTrp colloids are presented in Fig. 3b. The SDF q(Li) values are relative contribution of particles of the depolarization factor Li to the net absorption spectrum. In the case of the initial silver colloid, the q(Li) lines are positioned around L = 1/3 value that corresponds to spherical particles, while, in the case of the functionalized nanoparticles new lines appear in the spectrum indicating the formation of the nanostructures of higher eccentricity. Consequently, we can conclude that the formation of the hybrid nanostructures takes place via aggregation of a finite number of silver nanoparticles in the presence of tryptophan.
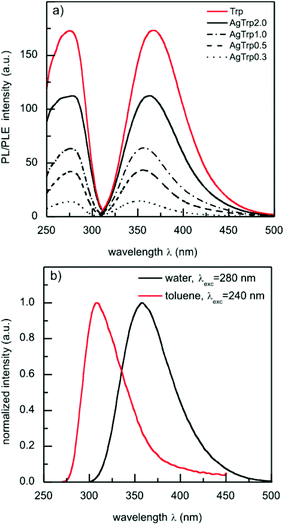
Photoluminescence emission and excitation spectra of tryptophan aqueous solutions (0.1 mM, pH ∼ 10) and AgTrp colloids are presented in Fig. 4a. The spectra show an asymmetric emission band at 368 nm that originates from the environment sensitive 1La transitions of the amino acid. The intensity of the emission band of the AgTrp1.0 sample is lower than that of the pure 0.1 mM tryptophan solution, although the concentrations of the amino acid in the both samples are equal (Fig. 3). This can be attributed to the absorption of the emitted radiation by silver nanoparticles (Fig. 2) or to the increase in the non-radiative decay rate of the surface-bound tryptophan.34 The photoluminescence spectra of the initial and the phase transferred (see ESI, Fig. S1†) AgTrp2.0 colloids are presented in Fig. 4b. It can be seen that the nanostructures dispersed in toluene exhibit an emission band at lower wavelengths, which is typical of tryptophan luminescence in non-polar media. The former results suggest that the functionalization of silver nanoparticles with tryptophan is a good route towards the fabrication of hybrid nanostructures with excitation and emission bands in the UV domain. The fact that the tryptophan emission is sensitive to the polarity of the environment enables one to gain additional information on subcellular accumulation of the AgTrp nanostructures.
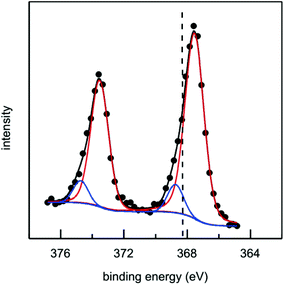 | ||
| Fig. 5 High resolution X-ray photoelectron spectra of Ag 3d levels of the AgTrp1.0 sample. A vertical dashed line corresponds to the reference value of bulk silver.35 | ||
3.2 Deep UV fluorescence imaging of E. coli cells incubated with AgTrp nanostructures
The DUV fluorescence imaging of live E. coli and E. coli cells incubated with different concentrations of AgTrp colloids was performed using a 280 nm synchrotron beam as an excitation source. The average intensities of the fluorescent signals for E. coli cells incubated with AgTrp1.0 and AgTrp2.0 functionalized nanoparticles obtained in [370–410 nm] and [452–486 nm] ranges showed a negligible difference in comparison to the control sample, indicating that they originate from the autofluorescence of the cells (ESI Fig. S5†). On the other hand, the [327–353 nm] emission from the microorganisms treated with AgTrp2.0 colloid was approximately four times higher than the signal of the control and was attributed to the fluorescence of the functionalized nanostructures within E. coli cells (ESI Fig. S5†).The mentioned effect is demonstrated in Fig. 6 that shows the overlays of the fluorescence images acquired within [327–353 nm] and [452–486 nm] (Fig. 6a and b), as well as [327–353 nm] and [370–410 nm] (Fig. 6c and d), detection ranges. It can be seen that the strong signal in the [327–353 nm] domain can be detected only in the E. coli cells incubated with AgTrp2.0 colloid (Fig. 6b and d). The tryptophan fluorescence, as well as that of phenylalanine and tyrosine, is responsible for the characteristic optical properties of many proteins21 including those of E. coli. However, the complexity of the biomolecule results in limited number of tryptophan residues per protein. For example, the most abundant outer membrane protein in E. coli, OmpA, with approximately 105 copies per E. coli cell,37 has five tryptophan residues, out of which four are located in the lipid bilayer38 resulting in the overall fluorescence of the protein peaking at about 330 nm.39 In our case, an intense signal from the functionalized nanostructures is a consequence of the accumulation of the amino acid on the silver surface, as was concluded from the analyses of the XPS data (Fig. 5).
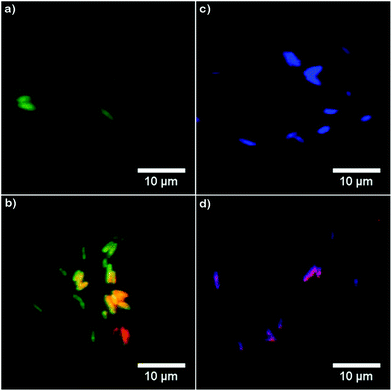 | ||
| Fig. 6 Overlaid fluorescence images of (a, c) E. coli cells and (b, d) E. coli cells incubated with AgTrp2.0 (concentration 8.64 μg ml−1). The images were obtained by overlaying the data acquired within [327–353 nm] and [452–486 nm] (a, b), as well as [327–353 nm] and [370–410 nm] (c, d) ranges. The corresponding channels in the images were scaled to the same range of values using Fiji image analysis software.28 Conditions: λexc = 280 nm, acquisition time 6 min, incubation time 2 h. The strong signal in the [327–353 nm] domain can be detected only in the E. coli cells incubated with AgTrp2.0 colloid (images b and d). | ||
The fact that the fluorescence from AgTrp nanostructures in the cells occurs at lower wavelengths than the emission of the hydrocolloids (368 nm) indicates that the functionalized nanostructures were localized in a hydrophobic environment (i.e. cell membrane). This conclusion is in agreement with the results presented in Fig. 4b and with the recent results on the interaction of tryptophan-substituted antimicrobial peptides with liposomes that mimic E. coli cell membranes.23 In the mentioned study the observed blue-shift in the tryptophan emission was attributed to the insertion of tryptophan residues into the lipid bilayers. The change in the morphology of the bilayer structure after the interaction between silver nanoparticles and vesicles prepared from extracted E. coli membranes was also confirmed by TEM analysis.13 On the other hand, in our forthcoming study, we will show that AgTrp nanostructures interact differently with eukaryote cells of Candida albicans i.e. that they are mainly located in a hydrophilic environment.
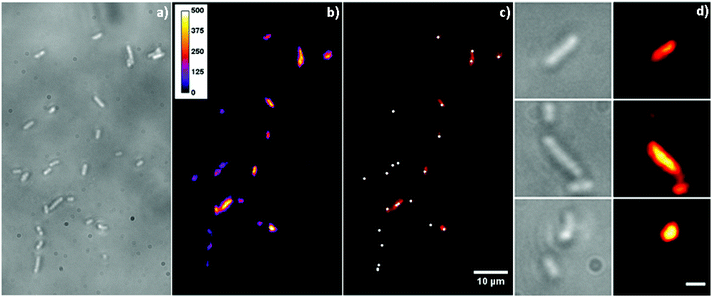
For the imaging conditions used in the present study, the spatial resolution of the fluorescence images is defined by the projected pixel size of 154 nm. The estimated lateral resolution for the [327–353 nm] emission range is around 140 nm, which is lower than the pixel size of the images. Under the assumption that there is a correlation between the intensity of the signal at a given pixel and the concentration of AgTrp nanostructures in the corresponding surface area, this spatial resolution is sufficient to determine the preferable locations for the accumulation of AgTrp nanostructures in the bacteria. Bright-field and the corresponding fluorescence images of E. coli cells incubated with AgTrp2.0 colloid acquired in the [327–353 nm] emission range are presented in Fig. 7. The intensity of the luminescence signal localized on the cell positions varies along the cell surface area (Fig. 7b) suggesting inhomogeneous distribution of AgTrp nanostructures. The white dots in Fig. 7c represent positions of local fluorescence maxima detected using Fiji with 350 intensity threshold value. For clarity of the presentation, labels were augmented to 9 × 9 pixels. The individual maximum can be attributed to the preferential location within the cell in which accumulation of AgTrp nanostructures takes place. Therefore, our DUV experiments show that functionalization with tryptophan enables one to study the accumulation of nanoparticles with a single cell resolution. The results of the fluorescence imaging suggest that E. coli cells internalize AgTrp nanostructures. This can be seen more clearly in Fig. 7d in which bright field and spatially averaged fluorescence images (mean filter in Fiji) of selected E. coli cells incubated with AgTrp2.0 are presented. The steps in the fluorescence image processing are given in the ESI, Fig. S6.† The spatial distribution of the nanostructures within the cells observed here is in agreement with transmission electron microscopy observations of the cross-sections of E. coli incubated with silver nanoparticles.7,14 The DUV results in Fig. 6 and 7 suggest that tryptophan-functionalized silver nanoparticles interact with the sections of cell membranes leading to encapsulation of the nanostructures by the phospholipids and subsequent transport to the cytoplasm.
4. Conclusion
Antimicrobial nanostructures that can absorb and emit light in the UV region were prepared by functionalization of silver surfaces with tryptophan amino acid. TEM observations and the analyses of the UV-vis absorption spectra showed that the nanoparticles, initially 6 nm in size, aggregate in the presence of the amino acid. The DUV fluorescence imaging of live E. coli cells and E. coli cells incubated with different AgTrp colloids was performed using a 280 nm monochromatised synchrotron beam as an excitation source. The analyses of the fluorescence images showed that a signal detected in the [327–353 nm] emission range can be attributed to the fluorescence of AgTrp nanostructures within E. coli cells. The fluorescence of the amino acid in this domain suggested that the tryptophan molecules were localized in the hydrophobic environment. Furthermore, for the imaging conditions employed, the spatial resolution of the fluorescence images was 154 nm, which was sufficient to perform analyses of the accumulation of AgTrp nanostructures in the bacteria. The DUV images showed an increase in the intensity of fluorescence towards the interior of the cells indicating that E. coli internalized the tryptophan-functionalized nanoparticles.Acknowledgements
Deep UV imaging of live bacteria was performed at the DISCO beamline of Synchrotron SOLEIL (France) as a part of the research project no. 20120810. We acknowledge with gratitude the TNA support granted by Synchrotron SOLEIL. The authors kindly acknowledge the help of Dr Beatriz Guimaraes (SOLEIL) for providing the microbial cultures for the experiment and Dr Valerie Rouam (SOLEIL) for the help in the preparation of the samples for the fluorescence imaging. This study was financially supported by the Ministry of Education and Science, Republic of Serbia (Project no. 172056, 45020 and 171020).References
- G. McDonnell and A. D. Russell, Clin. Microbiol. Rev., 1999, 12, 147 CAS.
- M. Rai, A. Yadav and A. Gade, Biotechnol. Adv., 2009, 27, 76 CrossRef CAS PubMed.
- V. K. Sharma, R. A. Yngard and Y. Lin, Adv. Colloid Interface Sci., 2009, 145, 83 CrossRef CAS PubMed.
- D. K. Božanić, V. Djoković, S. Dimitrijević-Branković, R. Krsmanović, M. McPherson, P. S. Nair, M. K. Georges and T. Radhakrishnan, J. Biomater. Sci., Polym. Ed., 2011, 22, 2343 CrossRef PubMed.
- D. K. Božanić, S. Dimitrijević-Branković, N. Bibić, A. S. Luyt and V. Djoković, Carbohydr. Polym., 2011, 83, 883 CrossRef.
- L. Csóka, D. K. Božanić, V. Nagy, S. Dimitrijević-Branković, A. S. Luyt, G. Grozdits and V. Djoković, Carbohydr. Polym., 2012, 90, 1139 CrossRef PubMed.
- J. R. Morones, J. L. Elechiguerra, A. Camacho, K. Holt, J. Kouri, J. T. Ramirez and M. J. Yacaman, Nanotechnology, 2005, 16, 2346 CrossRef CAS PubMed.
- A. Dror-Ehre, H. Mamane, T. Belenkova, G. Markovich and A. Adin, J. Colloid Interface Sci., 2009, 339, 521 CrossRef CAS PubMed.
- C. N. Lok, C. M. Ho, R. Chen, Q. Y. He, W. Y. Yu, H. Sun, P. K. Tam, J. F. Chiu and C. M. Che, J. Biol. Inorg. Chem., 2007, 12, 527 CrossRef CAS PubMed.
- Z. M. Xiu, Q. B. Zhang, H. L. Puppala, V. L. Colvin and J. J. Alvarez, Nano Lett., 2012, 12, 4271 CrossRef CAS PubMed.
- N. Ruiz, D. Kahne and T. J. Silhavy, Nat. Rev. Microbiol., 2006, 4, 57 CrossRef PubMed.
- Y. Zhou, Y. Kong, S. Kundu, J. D. Cirillo and H. Liang, J. Nanobiotechnol., 2012, 10, 19 CrossRef CAS PubMed.
- W. R. Li, X. B. Xie, Q. S. Shi, H. Y. Zeng, Y. S. Ou-Yang and Y. B. Chen, Appl. Microbiol. Biotechnol., 2010, 85, 1115 CrossRef CAS PubMed.
- I. Sondi and B. Salopek-Sondi, J. Colloid Interface Sci., 2004, 275, 177 CrossRef CAS PubMed.
- S. Pal, Y. K. Tak and J. M. Song, Appl. Environ. Microbiol., 2007, 73, 1712 CrossRef CAS PubMed.
- F. Jamme, S. Kaščàkovà, S. Villette, F. Allouche, S. Pallu, V. Rouam and M. Réfrégiers, Biol. Cell, 2013, 105, 1 CrossRef PubMed.
- F. Jamme, S. Villette, A. Giuliani, V. Rouam, F. Wien, B. Lagarde and M. Réfrégiers, Microsc. Microanal., 2010, 16, 507 CrossRef CAS PubMed.
- R. Bhartia, E. C. Salas, W. F. Hug, R. D. Reid, A. L. Lane, K. J. Edwards and K. H. Nealson, Appl. Environ. Microbiol., 2010, 76, 7231 CrossRef CAS PubMed.
- J. M. Pagès, S. Kaščàkovà, L. Maigre, A. Allam, M. Alimi, J. Chevalier, E. Galardon, M. Réfrégiers and I. Artaud, ACS Med. Chem. Lett., 2013, 4, 556 CrossRef PubMed.
- J. D. Pajović, R. Dojčilović, D. K. Božanić, S. Kaščàkovà, M. Réfrégiers, S. Dimitrijević-Branković, V. V. Vodnik, A. R. Milosavljević, E. Piscopiello, A. S. Luyt and V. Djoković, Colloids Surf., B, 2015, 136, 742 CrossRef PubMed.
- J. R. Lakowicz, Principles of Fluorescence Spectroscopy, Springer, Berlin, 3rd edn, 2006 Search PubMed.
- C. Yanofsky, V. Horn and P. Gollnick, J. Bacteriol., 1991, 173, 6009 CAS.
- V. M. Heatwole and R. L. Somerville, J. Bacteriol., 1991, 173, 3601 CAS.
- X. Bi, C. Wang, W. Dong, W. Zhu and D. Shang, J. Antibiot., 2014, 67, 361 CrossRef CAS PubMed.
- V. V. Vuković and J. M. Nedeljković, Langmuir, 1993, 9, 980 CrossRef.
- Z. V. Šaponjić, R. C. Sencsits, T. Rajh and N. M. Dimitrijević, Chem. Mater., 2003, 15, 4521 CrossRef.
- C. J. Powell, Appl. Surf. Sci., 1995, 89, 141 CrossRef CAS.
- J. Schindelin, I. Arganda-Carreras, E. Frise, V. Kaynig, M. Longair, T. Pietzsch, S. Preibisch, C. Rueden, S. Saalfeld, B. Schmid, J. Y. Tinevez, D. J. White, V. Hartenstein, K. Eliceiri, P. Tomancak and A. Cardona, Nat. Methods, 2012, 9, 676 CrossRef CAS PubMed.
- C. H. Chuang and Y. T. Chen, J. Raman Spectrosc., 2009, 40, 150 CrossRef CAS.
- F. Hao and P. Nordlander, Chem. Phys. Lett., 2007, 446, 115 CrossRef CAS.
- P. B. Jonhson and R. W. Christy, Phys. Rev. B: Solid State, 1972, 6, 4370 CrossRef.
- H. Hovel, S. Fritz, A. Hilger, U. Kreibig and M. Vollmer, Phys. Rev. B: Condens. Matter, 1993, 48, 18178 CrossRef.
- R. Bro and S. De Jong, J. Chemom., 1997, 11, 393 CrossRef CAS.
- E. Dulkeith, A. C. Morteani, T. Niedereichholz, T. A. Klar, J. Feldmann, S. A. Levi, F. C. Van Veqqel, D. N. Reinhoudt, M. Möller and D. I. Gittins, Phys. Rev. Lett., 2002, 89, 203002 CrossRef CAS PubMed.
- M. P. Seah, Surf. Interface Anal., 1989, 14, 488 CrossRef CAS.
- H. S. Shin, S. C. Choi, Y. Jung, S. B. Kim, H. J. Song and H. J. Shin, Chem. Phys. Lett., 2004, 383, 418 CrossRef CAS.
- R. Koebnik, K. P. Locher and P. Van Gelder, Mol. Microbiol., 2000, 37, 239 CrossRef CAS PubMed.
- P. J. Bond and M. S. Sansom, J. Mol. Biol., 2003, 329, 1035 CrossRef CAS PubMed.
- T. Surrey and F. Jähnig, Proc. Natl. Acad. Sci. U. S. A., 1992, 89, 7457 CrossRef CAS.
Footnote |
| † Electronic supplementary information (ESI) available. See DOI: 10.1039/c5an02358k |
| This journal is © The Royal Society of Chemistry 2016 |


