
A highly sensitive strategy for base excision repair enzyme activity detection based on graphene oxide mediated fluorescence quenching and hybridization chain reaction†
Qiang
Xi
,
Jun-Jie
Li
,
Wen-Fang
Du
,
Ru-Qin
Yu
* and
Jian-Hui
Jiang
*
State Key Laboratory of Chemo/Biosensing and Chemometrics, College of Chemistry and Chemical Engineering, Hunan University, Changsha 410082, P. R. China. E-mail: rqyu@hnu.edu.cn; jianhuijiang@hnu.edu.cn; Fax: +86-731-88822872; Tel: +86-731-88822577
First published on 18th November 2015
Abstract
A novel fluorescent nanosensor has been developed by combining super fluorescence quenching ability of graphene oxide and hybridization chain reaction amplification, which enables highly sensitive detection of base excision repair enzyme activity with a wide dynamic range from 0.0001 to 100 U mL−1 and a detection limit of 0.00006 U mL−1.
Base excision repair (BER) enzymes play vital roles in maintaining the integrity of genomes.1 BER is the major pathway that acts throughout the cell cycle to remove damaged DNA bases and generates abasic sites (AP sites). Then the repair process is completed by coordinating with AP endonucleases, deoxyribophosphodiesterases, DNA polymerases and DNA ligases.2 Uracil-DNA glycosylase (UDG) is one of the most important BER enzymes responsible for removing uracil residues from DNA strands by catalyzing the hydrolysis of the N-glycosylic bond joining the uracil base to the deoxyribose phosphate backbone.3 Since the uracil excision repair process plays an essential role in genetic integrity and related diseases such as type 1 human immunodeficiency virus and Bloom syndrome,4 strategies for detecting the activity of UDG sensitively and selectively are in urgent need, especially for the study of mechanisms and functions of many fundamental biochemical processes.
Traditional approaches for activity screening of UDG include radioactive labeling,3b gel electrophoresis,5 chromatography and mass spectrometry.6 However, these methods are time-consuming, operationally tedious and indirect due to the requirement of sophisticated instrumentation or additional separation techniques. In order to overcome these limitations, fluorescence-based strategies have attracted great attention for their intrinsically high sensitivity, simplicity, and ease of operation. In the setting, there are some emerging methods based on fluorescence resonance energy transfer (FRET) via using molecular beacon or fluorophore-labeled oligonucleotides for activity screening of UDG.7 Performed in homogeneous phases, these methods are generally simple, robust and scalable for high throughput parallel analysis of hundreds of samples. However, these UDG assays, because of the lack of signal amplification steps, typically show limited sensitivity.7 Coupling of enzymatic amplification with UDG reactions, though affording enhanced sensitivity, may have difficulty in the compatibility of enzymes in a single reaction.8 The pursuit of enzyme-free amplification for highly sensitive UDG assays has been rarely explored.
The concept of a hybridization chain reaction (HCR) has attracted significant research interest in sensor design because of its capability of signal amplification without the need for enzymes.9 By coupling HCR signal amplification with various molecular probes, including functional nucleic acid probes, antibodies, and functionalized nanoparticles, sensitive biosensors have been successfully applied to the detection of various targets such as molecules, nucleic acids and metal ions.10 Recent developments on using graphene oxide (GO) for selective fluorescence quenching of HCR products have provided a simple, cost-efficient and high signal-to-background platform for sensing HCR amplification cascades.11 Our group has also made effort in developing HCR-based biosensors for diverse biological applications.12
Herein, we report for the first time the development of a novel approach for highly sensitive and selective detection of UDG activity by combining HCR amplification and a GO-based fluorescence quenching platform, as illustrated in Scheme 1. This approach shows superior sensitivity with a detection limit of 0.00006 U mL−1. To our knowledge, it affords the most sensitive approach to the UDG assay. In this sensing system, we designed three probes, including a helper hairpin probe (HP), and two other hairpin probes, hairpin probe 1 (H1) and fluorophore-labeled hairpin probe 2 (H2), for HCR amplification. The helper hairpin probe (HP) contains four uracil bases in its stem which can be excised by UDG. In the absence of UDG, the initiator for the HCR is blocked in the HP, and no HCR amplification is achieved between two other hairpin probes, a non-labeled probe H1 and a fluorophore-labeled probe H2. When incubated with GO nanosheets, the fluorophore-labeled probe H2, which contains a 6 nt loop and a 6 nt sticky end with a fluorophore (FAM), can be adsorbed on the GO surface via its loop and sticky end through π–π stacking interactions,13 thereby displaying a substantially quenched fluorescence signal. In contrast, upon uracil excision by UDG, AP sites are produced in the HP, which significantly decrease the self-folding stability of the probe and induce a single-stranded conformation for the probe. This conformation change activates the initiator, which, in turn, triggers the HCR between two other hairpin probes, a non-labeled probe H1 and a fluorophore-labeled probe H2, and generates a chain-like double-stranded DNA (dsDNA) assembly with multiple fluorophore labels. The dsDNA HCR product will not be adsorbed on GO nanosheets due to the nucleobases in dsDNA being effectively hidden in the helical structure, which prevents the π–π stacking interactions of nucleobases with the GO surface. Therefore, a strong fluorescence signal is obtained as a quantitative indicator for the activity of UDG.
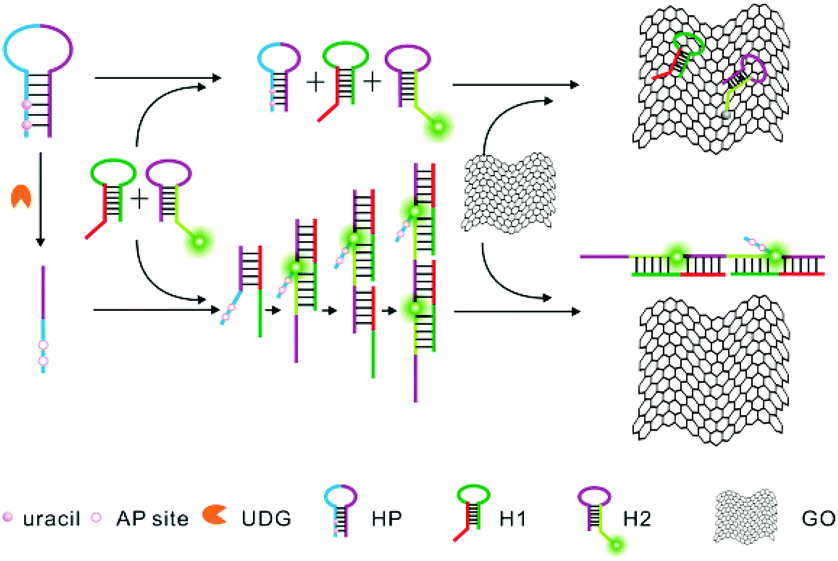 | ||
| Scheme 1 Schematic illustration of a UDG assay based on GO nanosheet mediated fluorescence quenching and hybridization chain reaction amplification. | ||
Fig. 1 depicts typical fluorescence spectral responses of the developed approach. The fluorophore-labeled probe H2 exhibits a high fluorescence signal (curve g), however, up to 95% fluorescence emission was quenched upon the addition of 20 μg mL−1 GO nanosheets (curve a). Furthermore, in the absence of UDG, the spectra merely show very low background fluorescence peaks (curve b, c, d), implying substantial quenching of the fluorescence. This is ascribed to the strong interactions between hairpin DNA probes and the GO nanosheets and the high fluorescence quenching efficiency of the nanosheets. In contrast, after incubation of 100 U mL−1 UDG with the HP plus H1 and H2 followed by the addition of 20 μg mL−1 GO nanosheets, a strong fluorescence signal was observed with a signal-to-background ratio of ∼10 (curve f). This observation implied the successful HCR with H1 and H2 as a result of the activation of the HP as an initiator for HCR. In a control experiment in which the HP plus H1 and H2 was incubated with UDG in the presence of excessive UDG inhibitor, 100 U mL−1 UGI followed by the addition of 20 μg mL−1 GO nanosheets, we also obtained a very low fluorescence signal comparable in intensity to the background (curve e). These results indicated that the fluorescence enhancement only depended on active UDG that mediated uracil removal. Further agarose gel electrophoresis analysis revealed that only the active UDG treatment gave a long dsDNA HCR product while no HCR product was obtained without the UDG reaction (Fig. S1, ESI†). These results implied that the HCR was specifically triggered by UDG-excised HP, which demonstrates that the proposed method can be used for selective detection of UDG activity.
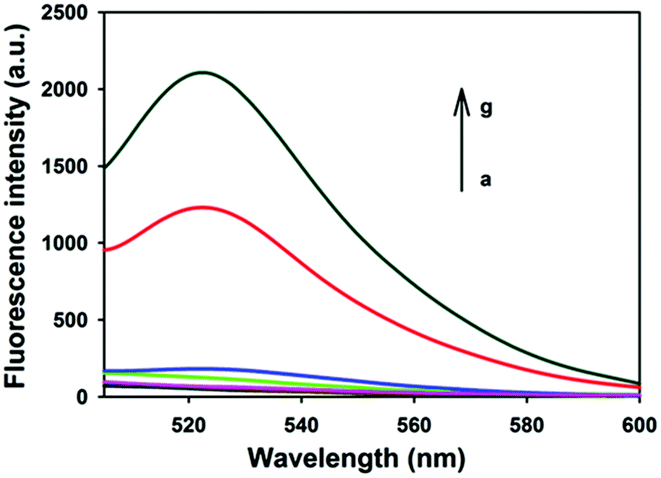 | ||
| Fig. 1 Typical fluorescence spectra of UDG analysis. (a) H2 + GO, (b) H1 + H2 + GO, (c) UDG + H1 + H2 + GO, (d) HP + H1 + H2 + GO, (e) UDG + UGI + HP + H1 + H2 + GO, (f) UDG + HP + H1 + H2 + GO, (g) H2. The concentrations of UDG, UGI, HP, H1, H2, and GO were 100 U mL−1, 100 U mL−1, 50 nM, 100 nM, 100 nM, and 20 μg mL−1, respectively. | ||
In order to achieve the best assay performance, we optimized the reaction time of UDG, the HP concentration, as well as the concentration of GO nanosheets. It was observed that the fluorescence intensity ratio (F/F0, where F0 and F are the fluorescence signals in the absence and presence of UDG, respectively) increases with time and reaches a plateau at 60 min (Fig. S2, ESI†). Therefore, the optimal reaction time of UDG was chosen to be 60 minutes and used throughout subsequent experiments. According to the dependency of the F/F0 of the UDG assay on the concentration of HP (Fig. S3, ESI†), an optimal fluorescence signal ratio was obtained with the HP concentration of 50 nM. So, the optimal HP concentration was chosen to be 50 nM. It was also found that the F/F0 ratio gradually increased with an increasing concentration of GO nanosheets up to 20 μg mL−1 while it decreased with a further increasing concentration of GO nanosheets (Fig. S4, ESI†). This finding was attributed to the weak adsorption of dsDNA HCR product on the excessive amount of GO nanosheets. Therefore, the GO nanosheet concentration of 20 μg mL−1 was chosen for further experiments to reach the desired sensitivity and selectivity.
Under the optimized experimental conditions, the performance of the developed strategy for quantitative activity screening of UDG was further investigated. As shown in Fig. 2A, a dramatic increase in the fluorescence intensity was observed with the increasing concentration of UDG. A quite wide dynamic range from 0 to 100 U mL−1 was achieved for this assay. The calibration curve for detection of UDG activity is shown in Fig. 2B, and the calibration equation was F = 2888 − 2771/(1 + 4697 C)1/24, with a squared correlation coefficient R2 of 0.9982, where F is the fluorescence intensity and C is the concentration of UDG. Moreover, the fluorescence intensity F was found to have a linear correlation with the logarithm of UDG concentration C in the range from 0.0001 U mL−1 to 100 U mL−1. The calibration equation was F = 896 + 190![[thin space (1/6-em)]](https://www.rsc.org/images/entities/char_2009.gif) logC with a squared correlation coefficient R2 of 0.9962. The detection limit was estimated to be 0.00006 U mL−1 according to the 3σ rule, which was lower than existing assays.14 These results indicated that the strategy could be used for highly sensitive detection of the UDG activity.
logC with a squared correlation coefficient R2 of 0.9962. The detection limit was estimated to be 0.00006 U mL−1 according to the 3σ rule, which was lower than existing assays.14 These results indicated that the strategy could be used for highly sensitive detection of the UDG activity.
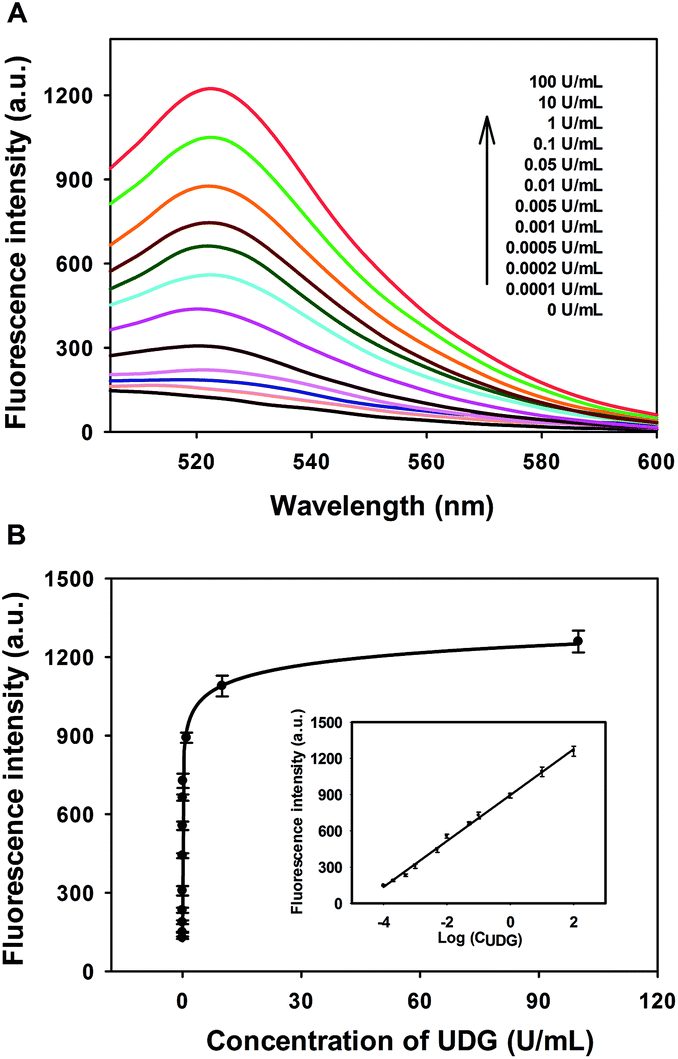 | ||
| Fig. 2 (A) Typical fluorescence spectra upon addition of different concentrations of UDG (from bottom to top: 0, 0.0001, 0.0002, 0.0005, 0.001, 0.005, 0.01, 0.05, 0.1, 1, 10, and 100 U mL−1). (B) Fluorescence peak intensities versus UDG concentrations. Inset: linear relationship between the fluorescence intensity and the logarithm of UDG concentration. Error bars are standard deviations of three repetitive experiments. | ||
Furthermore, we performed a series of contrast experiments using non-specific protein BSA and another BER enzyme 8-oxoguanine DNA glycosylase (hOGG1) to evaluate the specificity of the proposed UDG assay (Fig. S5, ESI†). It was found that only marginal fluorescence changes were obtained with the addition of these proteins compared to the blank. These results suggested that the proposed method had high selectivity for UDG detection.
In order to demonstrate the feasibility of this method for screening potential UDG inhibitors, a uracil DNA glycosylase inhibitor (UGI) was selected as a model inhibitor for this study. UGI was reported to be produced by the Bacillus subtilis bacteriophage PBS1 and forms an extremely specific protein complex with a 1:1 UDG:UGI stoichiometry.15 On binding to UGI, the activity of UDG was inhibited and it was unable to excise the uracil bases in HP. As shown in Fig. 3, the fluorescence signals were found to decrease with the increasing concentrations of UGI, and the calibration equation was F = 231 + (25/C) + (−0.2/C2) + (0.0002/C3), with a squared correlation coefficient R2 of 0.9976, where F is the fluorescence intensity and C is the concentration of UGI. The result gave direct evidence that the proposed assay held the potential for quantitative screening of UDG inhibitors.
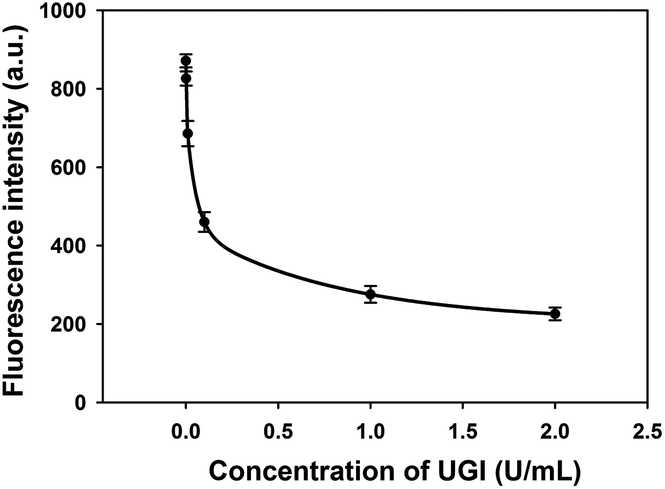 | ||
| Fig. 3 Fluorescence intensity of the assay in the presence of increasing concentrations of UGI (0, 0.001, 0.01, 0.1, 1, and 2 U mL−1). Error bars are standard deviations of three repetitive experiments. | ||
To determine whether the developed method could be applied in real complex biological samples, we measured the extracts from HeLa cell lines (Fig. S6, ESI†). It was observed that when the HeLa cell lysates were incubated in the assay system, a dramatic increase in the fluorescence intensity was observed. Moreover, the fluorescence intensity gradually increased with increasing reaction time as well as with the number of the cell lines. In a control experiment, when the HeLa cell lysates were incubated with UGI in the assay system, we obtained a very low fluorescence signal which had no remarkable change with increasing reaction time. The results suggested that the fluorescence changes in the assay system were specifically responsive to UDG present in the cell lysates. These results indicated that the proposed method was capable of screening UDG activity sensitively in real complex samples.
In summary, we have developed a novel approach for highly sensitive and selective detection of UDG activity by combining HCR amplification and a GO-based fluorescence quenching platform. Compared with other UDG assay methods, this method showed higher sensitivity and lower fluorescence background because of the efficient signal amplification of HCR and the super fluorescence quenching efficiency of GO nanosheets. The detection limit is 0.00006 U mL−1, which affords the most sensitive approach to the UDG assay. This strategy can also be used to evaluate the inhibition of the UDG activity. In virtue of these advantages, the proposed strategy is expected to provide an intrinsically robust, highly sensitive and selective assay platform for the UDG activity assay and related biochemical research studies.
This work was financially supported by the National Natural Science Foundation of China (21527810, 21190041, 21221003, 91317312), and National Key Basic Research Program (2011CB911000).
Notes and references
- C. J. Lord and A. Ashworth, Nature, 2012, 481, 287–294 CrossRef CAS PubMed.
- (a) T. A. Kunkel and D. A. Erie, Annu. Rev. Biochem., 2005, 74, 681–710 CrossRef CAS PubMed; (b) M. L. Hegde, T. K. Hazra and S. Mitra, Cell Res., 2008, 18, 27–47 CrossRef CAS PubMed; (c) T. Helleday, E. Petermann, C. Lundin, B. Hodgson and R. A. Sharma, Nat. Rev. Cancer, 2008, 8, 193–204 CrossRef CAS PubMed.
- (a) K. Imai, G. Slupphaug, W. I. Lee, P. Revy, S. Nonoyama, N. Catalan, L. Yel, M. Forveille, B. Kavli, H. E. Krokan, H. D. Ochs, A. Fischer and A. Durandy, Nat. Immunol., 2003, 4, 1023–1028 CrossRef CAS PubMed; (b) P. Prorok, D. Alili, C. Saint-Pierre, D. Gasparutto, D. O. Zharkov, A. A. Ishchenko, B. Tudek and M. K. Saparbaev, Proc. Natl. Acad. Sci. U. S. A., 2013, 110, E3695–E3703 CrossRef CAS PubMed; (c) S. van der Veen and C. M. Tang, Nat. Rev. Microbiol., 2015, 13, 83–94 CrossRef CAS PubMed.
- (a) G. Seal, K. Brech, S. J. Karp, B. L. Cool and M. A. Sirover, Proc. Natl. Acad. Sci. U. S. A., 1988, 85, 2339–2343 CrossRef CAS PubMed; (b) K. E. Willetts, F. Rey, I. Agostini, J. M. Navarro, Y. Baudat, R. Vigne and J. Sire, J. Virol., 1999, 73, 1682–1688 CAS; (c) P. Eldin, N. Chazal, D. Fenard, E. Bernard, J. F. Guichou and L. Briant, Nucleic Acids Res., 2014, 42, 1698–1710 CrossRef CAS PubMed.
- A. A. Ischenko and M. K. Saparbaev, Nature, 2002, 415, 183–187 CrossRef PubMed.
- J. Ren, A. Ulvik, H. Refsum and P. M. Ueland, Anal. Chem., 2002, 74, 295–299 CrossRef CAS PubMed.
- (a) B. Liu, X. Yang, K. Wang, W. Tan, H. Li and H. Tang, Anal. Biochem., 2007, 366, 237–243 CrossRef CAS PubMed; (b) T. Ono, S. Wang, C. K. Koo, L. Engstrom, S. S. David and E. T. Kool, Angew. Chem., Int. Ed., 2012, 51, 1689–1692 CrossRef CAS PubMed; (c) D. M. Zhou, Q. Xi, M. F. Liang, C. H. Chen, L. J. Tang and J. H. Jiang, Biosens. Bioelectron., 2013, 41, 359–365 CrossRef CAS PubMed.
- (a) L. Zhang, J. Zhao, J. Jiang and R. Yu, Chem. Commun., 2012, 48, 8820–8822 RSC; (b) Y. Ma, J. Zhao, X. Li, L. Zhang and S. Zhao, RSC Adv., 2015, 5, 80871–80874 RSC.
- R. M. Dirks and N. A. Pierce, Proc. Natl. Acad. Sci. U. S. A., 2004, 101, 15275–15278 CrossRef CAS PubMed.
- (a) J. Huang, Y. Wu, Y. Chen, Z. Zhu, X. Yang, C. J. Yang, K. Wang and W. Tan, Angew. Chem., Int. Ed., 2011, 50, 401–404 CrossRef CAS PubMed; (b) Y. Chen, J. Xu, J. Su, Y. Xiang, R. Yuan and Y. Chai, Anal. Chem., 2012, 84, 7750–7755 CrossRef CAS PubMed; (c) X. Li, Y. Wang, L. Wang and Q. Wei, Chem. Commun., 2014, 50, 5049–5052 RSC; (d) C. Li, H. Wang, J. Shen and B. Tang, Anal. Chem., 2015, 87, 4283–4291 CrossRef CAS PubMed.
- J. Huang, X. Gao, J. Jia, J. K. Kim and Z. Li, Anal. Chem., 2014, 86, 3209–3215 CrossRef CAS PubMed.
- (a) Z. Wu, G. Q. Liu, X. L. Yang and J. H. Jiang, J. Am. Chem. Soc., 2015, 137, 6829–6836 CrossRef CAS PubMed; (b) Y. M. Wang, Z. Wu, S. J. Liu and X. Chu, Anal. Chem., 2015, 87, 6470–6474 CrossRef CAS PubMed; (c) J. Ge, Z. M. Huang, Q. Xi, R. Q. Yu, J. H. Jiang and X. Chu, Chem. Commun., 2014, 50, 11879–11882 RSC.
- (a) C. H. Lu, H. H. Yang, C. L. Zhu, X. Chen and G. N. Chen, Angew. Chem., Int. Ed., 2009, 48, 4785–4787 CrossRef CAS PubMed; (b) H. Chang, L. Tang, Y. Wang, J. Jiang and J. Li, Anal. Chem., 2010, 82, 2341–2346 CrossRef CAS PubMed; (c) B. Liu, Z. Sun, X. Zhang and J. Liu, Anal. Chem., 2013, 85, 7987–7993 CrossRef CAS PubMed; (d) M. Yi, S. Yang, Z. Peng, C. Liu, J. Li, W. Zhong, R. Yang and W. Tan, Anal. Chem., 2014, 86, 3548–3554 CrossRef CAS PubMed.
- (a) Y. Xiang and Y. Lu, Anal. Chem., 2012, 84, 9981–9987 CrossRef CAS PubMed; (b) K. H. Leung, H. Z. He, V. P. Ma, H. J. Zhong, D. S. Chan, J. Zhou, J. L. Mergny, C. H. Leung and D. L. Ma, Chem. Commun., 2013, 49, 5630–5632 RSC; (c) J. Tao, P. Song, Y. Sato, S. Nishizawa, N. Teramae, A. Tong and Y. Xiang, Chem. Commun., 2014, 51, 929–932 RSC; (d) C. Y. Lee, K. S. Park and H. G. Park, Chem. Commun., 2015, 51, 13744–13747 RSC.
- S. E. Bennett and D. W. Mosbaugh, J. Biol. Chem., 1992, 267, 22512–22521 CAS.
Footnote |
| † Electronic supplementary information (ESI) available: Experimental details and additional figures. See DOI: 10.1039/c5an02255j |
| This journal is © The Royal Society of Chemistry 2016 |