
Visual detection of serum asialohaptoglobin by plasmonic sandwich ELLSA – a new platform for cirrhosis diagnosis†
Partha Pratim
Bose‡
*a,
Gautam
Mandal
b,
Dharmendra
Kumar
a,
Ajay
Duseja
c and
Bishnu Pada
Chatterjee
b
aDepartment of Biotechnology, National Institute of Pharmaceutical Education and Research, Hajipur 844102, India. E-mail: get.ppb@gmail.com; ppb.mm@jcbose.ac.in
bDepartment of Natural Science, West Bengal University of Technology, Kolkata 700064, India
cDepartment of Hepatology, Post Graduate Institute of Medical Education and Research, Chandigarh 160012, India
First published on 3rd November 2015
Abstract
The cirrhotic condition of the liver has long been acknowledged as the preface to liver cancer. The desialylation status of the serum acute phase protein, haptoglobin, has been introduced as a new diagnostic analyte for liver cirrhosis. The reliability of this new diagnostic molecule has been evaluated in 30 liver cirrhosis patients having a history of earlier viral hepatitis C (HCV-LC). A novel enzyme linked lectinosorbent assay has been developed coupled with the plasmon mechanism of gold nanoparticle aggregation as the colorimetric read out which can visually distinguish the cirrhotic liver patients from the normal healthy and hepatitis C controls. The assay can be useful for rapid point-of-care detection, and even an untrained person can execute it without a specialized instrument. This method employs Sambucus nigra agglutinin (SNA) to detect the extent of α-2,6 sialylation of serum haptoglobin, the new diagnostic molecule for liver cirrhosis.
Introduction
A malignant transformation significantly alters the N-glycan structures of cells. This occurs due to the altered expression of various glycosyltransferases that results in increased branching of N-glycans in many cancers.1–3 These glycoproteins with altered oligosaccharide structures are released from tumor cells into the bloodstream either via the classical secretion mechanism or by enhanced proteinase activity of various matrix metalloproteinases (MMPs). These aberrant secretomes can act as serological biomarkers of various cancers.4 However, the intrinsic complexity of glycan structures of the marker glycoproteins makes their analysis difficult. Mass spectrometry and tandem nanoflow LC-MS can quantify the monosaccharide composition as well as their types of linkages, which is crucial for the new diagnostic development.5–7Hepatocellular carcinoma (HCC) is the fifth most common cancer in men and the seventh in women in the world with more than 748![[thin space (1/6-em)]](https://www.rsc.org/images/entities/char_2009.gif) 000 new cases being diagnosed each year, and has become one of the leading causes of cancer related deaths worldwide.8,9 Despite the virulence of the disease it is most often diagnosed at an advanced stage leaving little chance for therapeutic intervention. Most often HCC occurs in cirrhotic livers following chronic infection with hepatitis B virus (HBV) or hepatitis C virus (HCV) and reports suggest that 60%–80% of HCCs are preceded by cirrhosis.10–12 Indeed, liver cirrhosis (LC) is a notable risk factor for the development of HCC. Therefore, there is an urgent need to diagnose LC for better clinical management of HCC. Widely used imaging techniques, such as ultrasonography, computed tomography scanning, and magnetic resonance imaging cannot distinguish benign cirrhotic macronodules from HCC.13,14 To date in the diagnosis and treatment follow-up of LC and HCC, serum α-fetoprotein (AFP) has been considered as the only serological marker.15,16 However, the sensitivity and specificity of AFP for its wide application is questionable.17 Therefore, newer specific and sensitive serological markers are needed for the early detection of LC. Desialylation of glycoproteins such as α-acid glycoprotein (AGP), transferrin (Tf) etc. in the hepatocyte membrane and serum caused by the down regulation of liver Galβ1,4GlcNAc α2,6-sialyltransferase has long been acknowledged as the crucial feature in LC and alcohol induced liver damage which are mostly considered as the prelude to HCC.18,19 The serum concentration of haptoglobin (Hp) and its fucosylation have recently been shown to correlate with the transformation of LC to HCC.20–22 In our current endeavor we have correlated the serum concentration of asialo-Hp with the occurrence of LC in Indian patients. Here we have introduced a cheap, fast, point-of-care and high throughput visual assay platform for the specific identification and determination of asialo-Hp to monitor the cases of LC. We used Sambucus nigra agglutinin (SNA) having specificity for the NeuAc (α2–6) Gal/GalNAc residue to determine the sialylation level of Hp in normal subjects and enhanced desialylation in LC patients in a novel sandwich Enzyme Linked Lectinosorbent Assay (ELLSA) for this purpose.23,24 We have harnessed the gold nanoparticle (GNP) based plasmonic technique in this new sandwich ELLSA platform to achieve high sensitivity and visual detection by a distinct change in color. The visual color change from red to blue is due to the aggregation of GNPs that can be triggered to different extents due to variation of the concentration of the consumed hydrogen peroxide (H2O2) added as the reducing agent. The color change can directly be correlated to the extent of sialylation on Hp by a coupled peroxidase mechanism.25,26
000 new cases being diagnosed each year, and has become one of the leading causes of cancer related deaths worldwide.8,9 Despite the virulence of the disease it is most often diagnosed at an advanced stage leaving little chance for therapeutic intervention. Most often HCC occurs in cirrhotic livers following chronic infection with hepatitis B virus (HBV) or hepatitis C virus (HCV) and reports suggest that 60%–80% of HCCs are preceded by cirrhosis.10–12 Indeed, liver cirrhosis (LC) is a notable risk factor for the development of HCC. Therefore, there is an urgent need to diagnose LC for better clinical management of HCC. Widely used imaging techniques, such as ultrasonography, computed tomography scanning, and magnetic resonance imaging cannot distinguish benign cirrhotic macronodules from HCC.13,14 To date in the diagnosis and treatment follow-up of LC and HCC, serum α-fetoprotein (AFP) has been considered as the only serological marker.15,16 However, the sensitivity and specificity of AFP for its wide application is questionable.17 Therefore, newer specific and sensitive serological markers are needed for the early detection of LC. Desialylation of glycoproteins such as α-acid glycoprotein (AGP), transferrin (Tf) etc. in the hepatocyte membrane and serum caused by the down regulation of liver Galβ1,4GlcNAc α2,6-sialyltransferase has long been acknowledged as the crucial feature in LC and alcohol induced liver damage which are mostly considered as the prelude to HCC.18,19 The serum concentration of haptoglobin (Hp) and its fucosylation have recently been shown to correlate with the transformation of LC to HCC.20–22 In our current endeavor we have correlated the serum concentration of asialo-Hp with the occurrence of LC in Indian patients. Here we have introduced a cheap, fast, point-of-care and high throughput visual assay platform for the specific identification and determination of asialo-Hp to monitor the cases of LC. We used Sambucus nigra agglutinin (SNA) having specificity for the NeuAc (α2–6) Gal/GalNAc residue to determine the sialylation level of Hp in normal subjects and enhanced desialylation in LC patients in a novel sandwich Enzyme Linked Lectinosorbent Assay (ELLSA) for this purpose.23,24 We have harnessed the gold nanoparticle (GNP) based plasmonic technique in this new sandwich ELLSA platform to achieve high sensitivity and visual detection by a distinct change in color. The visual color change from red to blue is due to the aggregation of GNPs that can be triggered to different extents due to variation of the concentration of the consumed hydrogen peroxide (H2O2) added as the reducing agent. The color change can directly be correlated to the extent of sialylation on Hp by a coupled peroxidase mechanism.25,26
Results
Serum asialo-Hp levels in HCV-LC patients
To choose the lectin and to validate the detection of the α 2,6-sialic acid linkage in Hp, lectin-blot analysis was performed with five lectins having different carbohydrate specificities: Sambucus nigra agglutinin (SNA; specificity: Neu5Ac α2,6 Gal), wheat germ agglutinin (WGA; specificity: GlcNAc, GlcNAc β1-4GlcNAc, Neu5Ac), concanavalin A (ConA; specificity: Glc, Man, GlcNAc, branched α-mannosidic structures; hybrid type and biantennary complex type N-Glycans), Galanthus nivalis agglutinin (GNA; specificity: α 1–3 and α 1–6 linked high mannose structures), Soybean agglutinin (SBA; specificity: N-acetyl-D-galactosamine, Gal). Commercial Hp (human) showed much higher reactivity with SNA than that with WGA and ConA but no reactivity was observed with SBA and GNA (Fig. 1A). This established the reactivity of SNA with the α-2,6 sialic acid linkage on the commercial Hp. To assess the extent of desialylation of Hp in the sera of hepatitis C induced liver cirrhosis (HCV-LC) patients as well as normal subjects, the concentration of Hp was measured by ELISA with an anti-Hp antibody. The range of control and HCV-LC was found to be 435 ± 108 μg ml−1versus 533 ± 109 μg ml−1 (ESI Fig. SI†).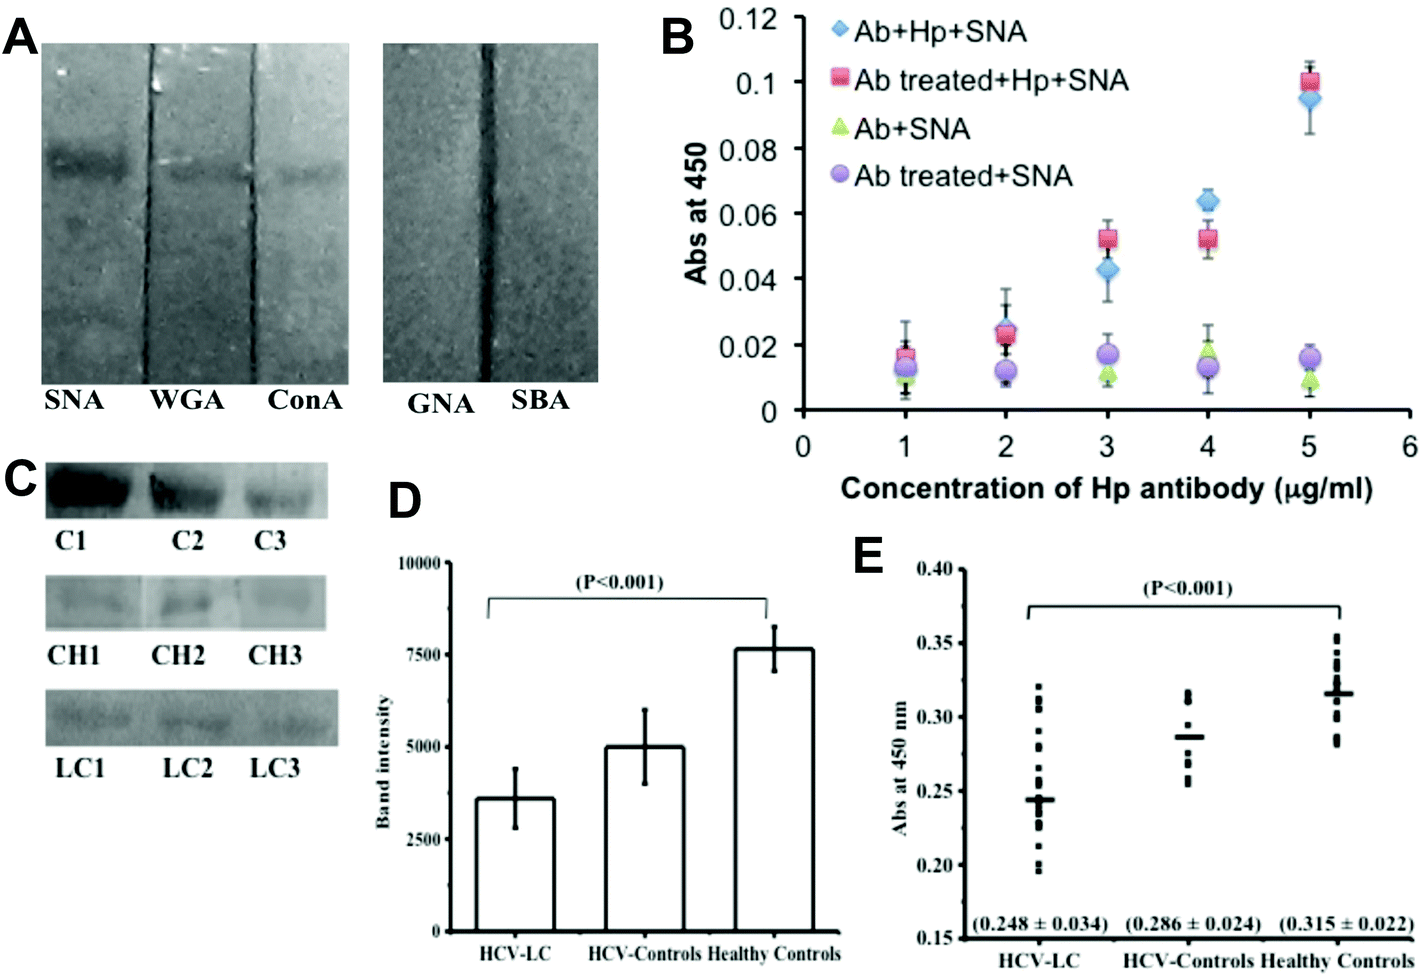 | ||
| Fig. 1 (A) Binding profile of commercial Hp with different lectins (SNA, WGA, ConA, GNA and SBA) as determined by lectin blot. (B) Standardization of non-treated and treated mAb-Hp concentrations used for the assay of serum Hp sialylation with SNA. (C) Sialylation level of Hp in healthy controls, HCV-controls and HLC-LC patient groups using sialic acid specific lectin, SNA by lectin blot. In healthy controls (n = 20), C1, C2 and C3 represent a pool consisting of 3 samples each. Similarly, in the HCV-control group (n = 10) CH1, CH2 and CH3 represent a pool consisting of 3 samples each and in the HCV-LC patient group (n = 30) LC1, LC2 and LC3 represent a pool consisting of 3 samples each. (D) Mean Band intensity of the serum Hp level of pooled samples from HCV-LC, HCV-controls and healthy controls as measured by Image J software. (E) Difference in SNA reactivity of serum Hp in healthy controls, HCV-controls and HCV-LC patient groups estimated by ELISA. The horizontal line indicates the mean value of Hp binding with SNA. | ||
To determine the binding of SNA, if any, with mAb-Hp (monoclonal anti-Hp), we went on to compare the ELISA results with periodate treated and non-treated mAb-Hp.27 The binding of SNA with Hp increased proportionally with increasing concentration of both periodate treated and non-treated mAb-Hp with no significant difference. On the other hand no appreciable increase in the binding of SNA was observed when the amounts of both treated and non-treated antibodies were increased in the absence of Hp (Fig. 1B). Thus, no substantial background binding of SNA with mAb-Hp was observed that would downplay the sensitivity of detection of the α-2,6 sialic acid linkage on Hp by the reactivity of SNA.
Next we went on to study the sialylation status of Hp directly from clinical samples (sera) by lectin blot analysis with SNA. The sialylation status of serum Hp by lectin blotting showed a significant reduction of binding in the HCV-LC patient group (p < 0.001) as compared to healthy and HCV controls (Fig. 1C). Following the blotting experiment, densitometric analysis of blots by Image J software also revealed a substantial difference in the lectin (SNA) activity of serum Hp between liver cirrhosis patients and control groups (Fig. 1D). Next, we studied the same SNA activity of the serum Hp, i.e. the extent of α-2,6 sialic acid linkage on Hp by the ELISA method.
For our subsequent sandwich ELISA to measure the extent of desialylation of Hp by the subsequent use of an anti-Hp antibody and biotinylated SNA, we diluted the sera to maintain the Hp added per well to an amount of 1 μg, both for patient groups and control groups and this allowed us to compare the sialylation status of Hp for patients and controls directly from the OD values of the corresponding wells. We have included two types of controls in our study, normal healthy controls (n = 20) and patients suffering from hepatitis C virus infection (HCV-controls) (n = 10). We took these subjects under a common group ‘control’ because liver cirrhosis does not have a very severe symptom and to date, only by hematological tests it is not at all possible to distinguish between viral hepatitis C and liver cirrhosis. Therefore, our ultimate aim was to distinguish the liver cirrhosis patients from this common control group. The diagnostic criteria for the selection of patients and controls were according to standard clinical guidelines. Several hematological tests such as elevated serum bilirubin-conjugated, elevated AST, ALT (AST/ALT ratio > 1), ALP, AFP, low serum albumin, deranged prothrombin time were included (Table 1). In our study we also included a standard non-invasive imaging technique (Ultrasound imaging) as one of the diagnostic criteria for our subject selection and the extent of liver damage in cirrhotic patients was assessed by this radiological test (Table 1). To validate our results of lectin blot analysis with clinical samples we studied the extent of sialylation of serum Hp by ELISA and compared it with the available clinical assessments (as in Table 1) for each of the individuals. The extent of Hp-sialylation was found to be significantly less (p < 0.0001) in the HCV-LC patient group (0.248 ± 0.034) than control groups (0.315 ± 0.022 for healthy controls and 0.286 ± 0.022 for HCV controls) in ELISA (Fig. 1D).
| Groups | Healthy control (n = 20) | HCV control (n = 10) | HCV-LC (n = 30) |
|---|---|---|---|
| Age (years) | 25–65 | 22–58 | 34–69 |
| Gender (M/F) | 25/5 | 7/3 | 26/4 |
| AFP (ng ml−1) | 26 ± 2 | 49 ± 19 | 94 ± 55 |
| ALT (IU l−1) | 5–40 | 37–75 | 63–138 |
| AST (IU l−1) | 10–34 | 43–105 | 63–138 |
| ALP (U l−1) | 25–110 | 74–341 | 98–526 |
| Conjugated bilirubin (mg dl−1) | 0.0–0.3 | 2.1–4.3 | 2.7–4.8 |
| Albumin (g dl−1) | 3.5–5.5 | 2.7–4.6 | 3.1–4.8 |
| Prothrombin time (s) | 11–13.5 | 15–19 | 16–21 |
| Anti-HCV | − | + | + |
| Serum HCV RNA | − | (30–50) × 105 Eq. per ml | (15–60) × 105 Eq. per ml |
| MR and USG imaging of liver | Regular USG, showed normal size of liver and homogeneous parenchymal echo-pattern | Hepatomegaly with no significant changes in echogenicity, no-focal parenchymal lesion | Small, often multiple nodules of low signal intensity and of variable enhancement were characteristically observed. |
Development of plasmonic ELLSA
For the sensitive and fast visual determination of the sialylation status of Hp in LC we developed a plasmonic Enzyme linked lectinosorbent assay (ELLSA). In this assay (Fig. 2) we introduced gold nanoparticles (GNP) as the colorimetric index, which enabled the assay platform to be readable by the naked eye with excellent sensitivity due to the plasmon characteristics of GNPs.25,26 The target acute phase protein Hp was captured either from the solution of commercial Hp at different concentrations (for optimization) or from the patients’ sera (for real sample analysis) by the anti-Hp antibody on the 96-well polystyrene plates. The degree of sialylation of arrested Hp molecules was assessed by the lectin SNA. In conventional ELISA colorimetric read out is carried out by using enzyme based chromogenic reactions where concentration differences of analytes are estimated by a plate reader.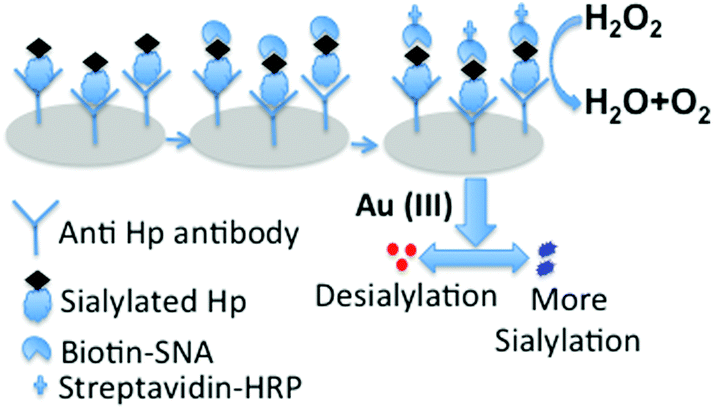 | ||
| Fig. 2 Schematic representation of the detection of the extent of α 2,6-sialylation of serum Hp by plasmonic ELLSA. | ||
To perform naked eye based colorimetric detection, we employed the plasmonic GNP based colorimetric read out technique to understand the subtle changes in the sialylation profile of Hp. Following Fig. 2 in each well of this assay platform, an equal amount of gold(III) solution was added which was subsequently reduced to generate the GNPs in the presence of added hydrogen peroxide (H2O2) as the reducing agent. The concentration of the leftover H2O2 was varied with the extent of sialic acid present on Hp bound to anti-Hp antibody in each microtiter well because antibiotin tagged horseradish peroxidase (HRP) was used after the addition of the tracer molecule, biotinylated SNA. Obviously, biotinylated SNA got bound according to the α-2,6 sialic acid concentration on Hp in each well, which in turn controlled the concentration of the subsequently added HRP in each well. Thus due to the difference in the concentration of sialic acid on Hp in different wells, the concentration of peroxide cleaving HRP varied which gave rise to differences in the concentration of left-over H2O2 (Fig. 2). The higher the sialylation, the greater is the amount of biotinylated SNA that will bind to Hp as well as the greater is the amount of the antibiotin–HRP conjugate that would bind to SNA in the system and thus a greater amount of peroxide would be cleaved. This low concentration of available peroxide for the reduction of gold(III) affected the formation kinetics and thus the aggregation propensity of the GNPs, which appeared as blue colored non-spherical, aggregated particles.
In agreement with the principle we first went on to optimize the gold(III) and H2O2 concentrations with respect to serially diluted commercial Hp to produce a tonality difference distinguishable by the naked eye, which will help us to determine the sialylation status of Hp visually. We optimized the color change of GNPs grown under different concentrations of added peroxide with respect to the same amount of gold(III) and their spectral characterization was also carried out (Fig. 3A). It has been found that up to a concentration of 150 μM of H2O2 in the wells 0.2 mM of added Au(III) will produce red GNPs dispersible in the medium with a steady absorbance maximum around 550 nm and when the concentration of H2O2 decreases below 150 μM, the blue GNPs are formed. At 120 μM a purple transition color was observed (Fig. 3A). The drop of absorbance at 550 nm for blue particles shows a linear trend (Fig. 3B), which could form the basis of the assay platform and estimate the extent of desialylation of Hp in the control as well as the patients’ sera. The shift in the plasmon band towards a higher wavelength due to the formation of aggregated blue GNPs from discrete red GNPs is depicted in Fig. 3C. After optimization of the concentration of hydrogen peroxide with respect to the specific amount of gold(III), we validated the plasmonic phenomenon in an ELLSA based detection platform where α-2,6-sialic acid containing commercial Hp was used as a measurable analyte by the specific SNA interaction as the concentration of the added Hp was varied well to well (Fig. 3D and E). During the optimization steps it was found that MES buffer (2-(N-morpholino)ethanesulphonic acid) which was used for dissolving gold(III) and also for diluting peroxide solution, showed some reducing property and the gold(III) solution became faintly blue upon being kept for more than 20 minutes. Therefore, to avoid any false detection we performed the assays with freshly prepared gold(III) solutions. To validate the naked eye detection of the Hp-sialylation level by the red-blue plasmonic color in terms of the experimentally determined quantity, we studied the difference in absorbance at 550 nm with respect to the increasing concentrations of Hp and a control protein, bovine serum albumin (BSA), and the difference in the absorption at 550 nm between the same concentrations of Hp and BSA, ‘−ΔA550’ (where −ΔA550 = −(A550 for Hp – A550 for BSA)) were plotted against the concentration of proteins. Fig. 3D and E demonstrated that with the increase in the concentration of Hp, red colored GNPs were formed with a linear increase in the value of ‘−ΔA550’. Under our optimized experimental conditions (with respect to concentrations of added SNA, H2O2 and Au(III) solution) a visibly distinct color change from red to blue was observed around 1 mg dl−1 of Hp concentration and the value of ‘−ΔA550’ did not change with further increase in Hp concentration under our experimental conditions (Fig. 3E). This concentration of Hp was maintained for all the subsequent assays with clinical samples as it was envisaged that with this specific amount of serum Hp in each well, the color change from blue to red occurred due to higher desialylation which was characteristic of liver cirrhosis with a concomitant decrease in the value of ‘−ΔA550’ with the extent of desialylation of Hp. It was also evident that the decrease in the values of ‘−ΔA550’ for red colored wells was linear with respect to the decrease in Hp added in those wells and thus the values of ‘−ΔA550’ reflected the linear decrease in the overall Hp-sialylation which could be related to the progress of the cirrhotic condition of liver during the real sample analysis.
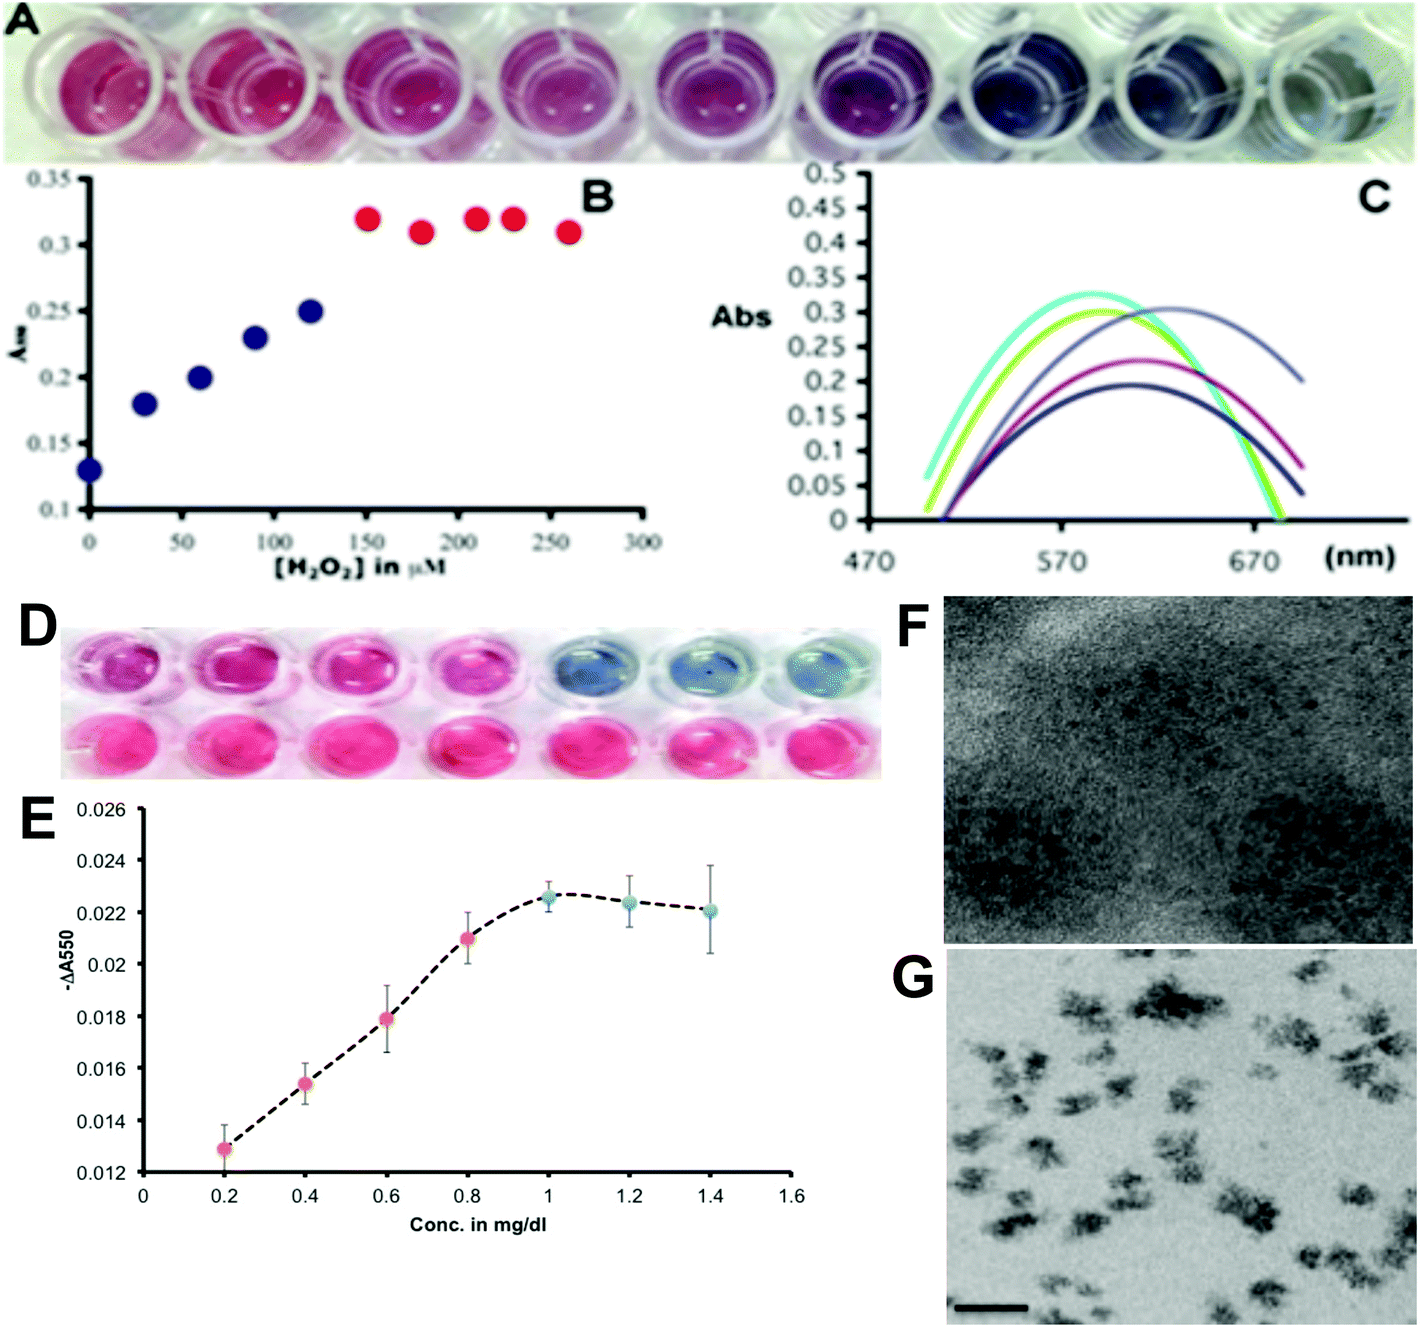 | ||
| Fig. 3 (A) On increasing the concentration of the reducing agent (H2O2) to 0.2 mM Au(III) the color changes from blue to red (30, 60, 90, 120, 150, 180, 210, 240, 270 μM final concentration in wells from right to left). At 120 μM concentration of H2O2 the intermediate color of red and blue was observed showing the beginning of aggregation of GNP. (B) Absorbance at 550 nm increases from blue to red particles and above 150 μM hydrogen peroxide red particles had very little differences of absorbances at 550 nm. (C) Spectral shifts for different colored particles: 568 nm for red particles, ∼645 nm for blue particles. (D) Visual detection of the Hp sialylation level by the generation of blue and red colored GNPs with varying concentration of Hp in the top lane compared with the same concentration of BSA in the bottom lane. The increasing concentration of Hp/BSA has been 0.4, 0.6, 0.8, 1.0, 1.2, 1.4 and 1.6 mg dl−1 from left to right. (E) The calibration curve showed a decrease in the difference in absorbance at 550 nm (−ΔA550 = −(A550 for Hp – A550 for BSA)) for Hp at different concentrations with respect to BSA at the same concentration. The color change from red to blue occurred in the range of ∼1.0 mg dl−1. (F) Transmission electron microscopy (TEM) images of red, non-aggregated and blue, aggregated gold nanoparticles. Scale bar: 20 nm. | ||
The transmission electron microscopy images of red and blue GNPs in Fig. 3F and G illustrated the morphological differences and the aggregation state of GNPs as non-aggregated red (quasi-spherical) and aggregated blue (irregular) particles. The optimization of the amount of gold(III) and H2O2 in the wells to achieve a visibly convincing color change from red to blue with decreasing amounts of the reducing agent (H2O2) was performed as shown in ESI Fig. SII.†
Visual detection of HCV-LC by plasmonic ELLSA
After establishing the prevalence of desialylated Hp in cirrhosis patients’ sera to be a potential diagnostic analyte for liver cirrhosis by the classical ELISA method and optimization of the plasmonic visual detection platform, we tried to employ the GNP based plasmonic phenomenon in a novel lectin based assay (ELLSA) for visual detection of the Hp sialylation in clinical samples. Fig. 4A demonstrates that all the 8 patients of HCV-LC can be visually distinguished from the control groups comprising 2 healthy and 2 HCV-controls just by the color of the wells, for the patient group the color was red and for control groups bluish purple made the discrimination prominent. These patients and controls were randomly selected from the same sets of patients and controls as previously tested by the classical ELISA technique (Fig. 1E). Values of ‘−ΔA550’ were determined for each subject (Fig. 4B and C) and they corroborated with the fact established in Fig. 3D and E that with the substantial desialylation of Hp in liver cirrhosis there would be a visible color change from blue to red which would be associated with a significant decrease in the values of ‘−ΔA550’ in the patient group compared to the controls (Fig. 4B and C).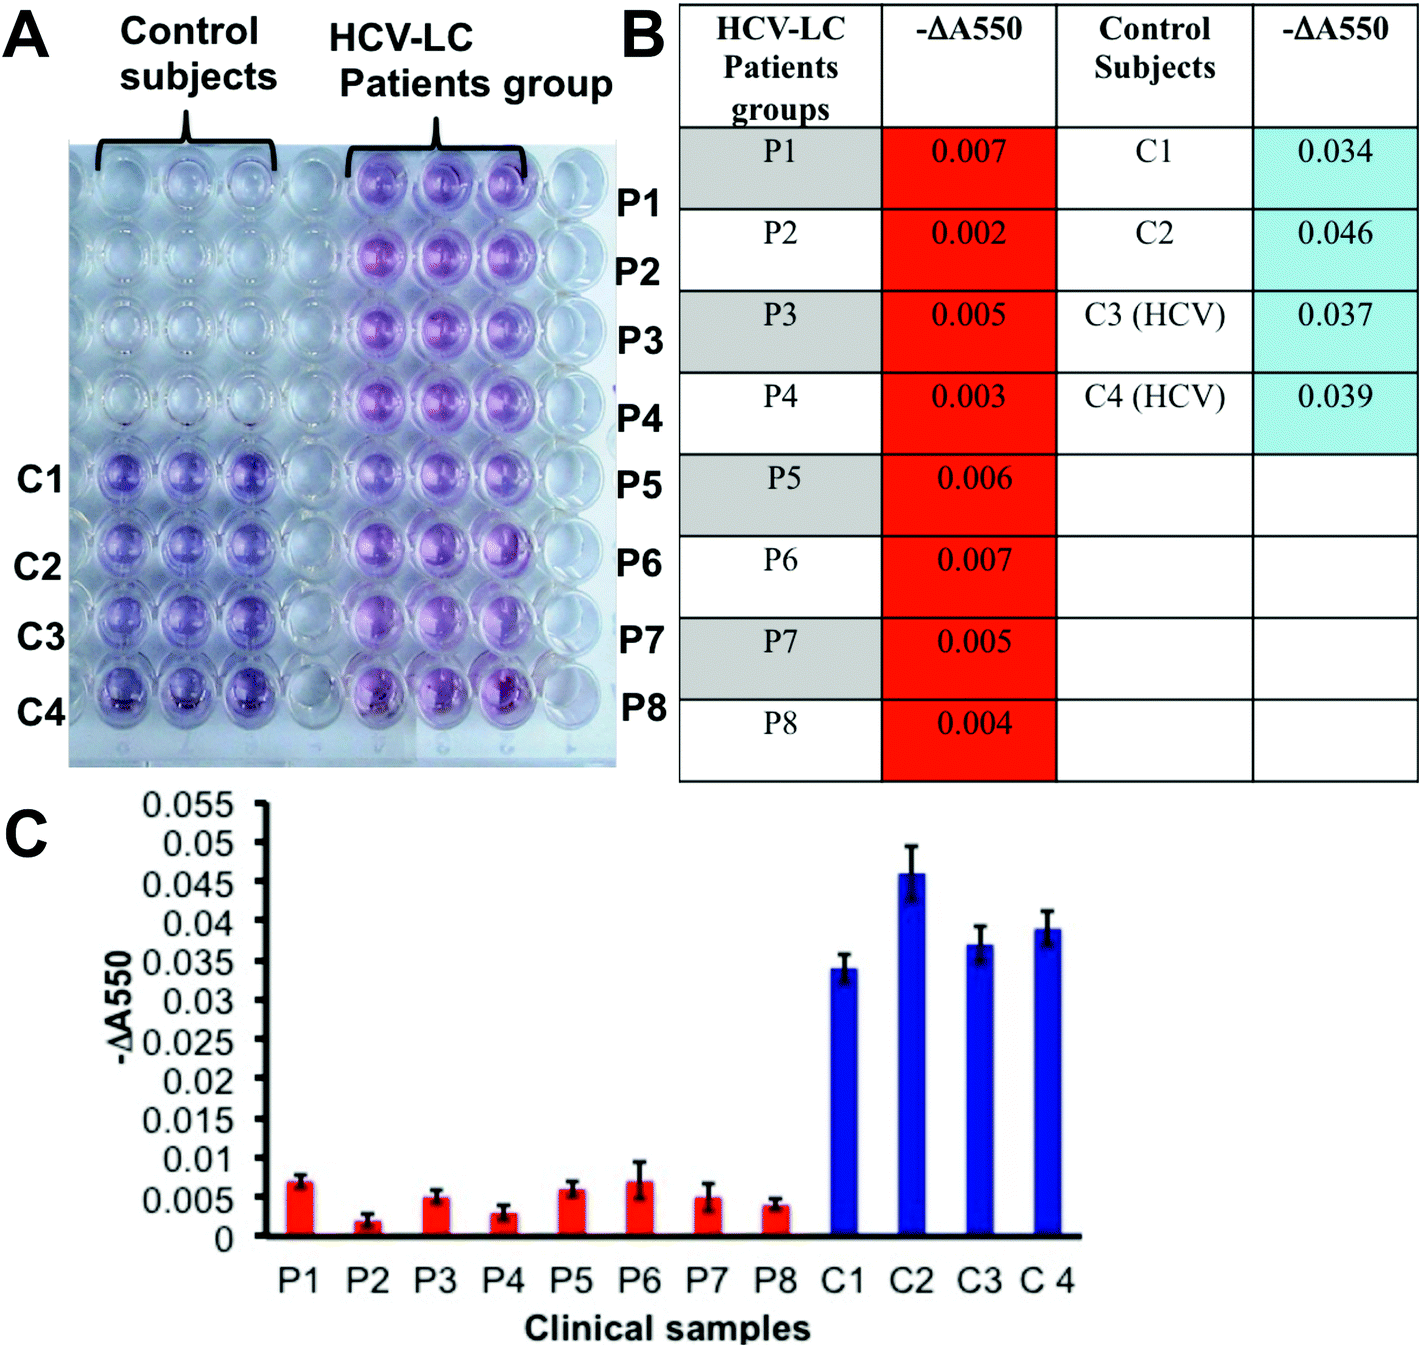 | ||
| Fig. 4 (A) Determination of serum Hp sialylation in the HCV-LC patient group (P1, P2, P3, P4, P5, P6, P7 and P8), healthy controls (C1 and C2) and HCV-control (C3 and C4) subjects by plasmonic ELLSA. The experiment was performed in triplicate. (B) The table showed the value of ‘−ΔA550’, which correlated to the degree of Hp sialylation in serum samples. (C) Graphical representation for a comparative demonstration of the value of ‘−ΔA550’ in the clinical samples (P for patients and C for controls). | ||
Discussion
The classical ELISA results with patients’ sera signified that the level of α-2,6 sialylation of Hp was lower in the patient group than in the healthy control, commensurating with the crucial previous observations in liver cirrhosis: desialylation increased either by enhancement of sialidase activity or by decrease in sialyltransferase activity.28 Thus our ELISA result convincingly established the correlation between the Hp-sialylation status and the occurrence of LC.Next in our endeavor we established a visual assay platform based on plasmon characteristics of GNP to assess the desialylation status of Hp from a colorimetric assay. The color of GNP is the reporter of its aggregation state and the extent of aggregation can vary with the concentration of the reducing agent present in the medium. In the case of less Hp-sialylation and consequently, according to the design of the assay, the concentration of HRP was also low. Therefore, the GNPs were produced under a higher concentration of peroxide, their formation kinetics was fast and quasi-spherical homogeneous GNPs were formed which produced a distinct red coloration in the solution of the well. Whereas, in the case of higher Hp-sialylation, the HRP concentration was also increased and thus aggregated, non-spherical, blue GNPs were formed. This change in color from red to blue depending on the extent of sialylation of Hp was starkly distinguishable by the naked eye. We extended the plasmonic visual ELLSA platform to detect the HCV-LC cases distinctly from the healthy normal and HCV patients serologically. It was found that the novel plasmonic ELLSA was successful in distinguishing HCV-LC cases by the appearance of red color as compared to purple blue in normal healthy controls. To substantiate the visual detection of the extent of Hp-sialylation, an experimental quantity ‘−ΔA550’ was determined in correlation with the visual color change with the change in the Hp-sialylation level. The value of ‘−ΔA550’ dropped significantly for the HCV-LC patients as compared to the controls. This drop in the ‘−ΔA550’ value signified higher Hp-desialylation in the cirrhotic liver condition and it could be visually detected by ‘red’ color in our visual assay in comparison with ‘blue’ color in all non-cirrhotic controls.
This new assay could prove to be beneficial for the easy and fast detection and monitoring of cirrhosis cases by the naked eye. By seeing the color change one could conclude the desialylation status of serum Hp.
Experimental section
UV-Visible spectra
All absorbance measurements were carried out by using a UV/Vis spectrophotometer (Shimadzu 1800) using a quartz cuvette of 1 cm path length. The absorption spectrum was measured from 700 to 450 nm against PBS buffer.Determination of lectin reactivity of commercial Hp
For lectin blot, an equal amount of Hp (10 μg, Sigma) was subjected to 10% SDS-PAGE in each lane. The protein bands were electroblotted onto nitrocellulose membranes. The membranes were blocked with 5% BSA (w/v) in PBS containing 0.1% Tween-20 (PBST) for 1 h at room temperature, washed and separately incubated with the following biotinylated lectins: Sambucus nigra agglutinin (SNA), wheat germ agglutinin (WGA), concanavalin A (ConA), soybean agglutinin (SBA) and Galanthus nivalis agglutinin (GNA), each diluted to 1:1000 using blocking buffer. After washing with PBST the membrane was incubated with HRP conjugated streptavidin (dilution 1:10000) in PBST. Reactive protein bands were visualized by addition of diaminobenzidine and 0.01% H2O2 in sodium acetate buffer (pH 5).
Subjects and ethics statement
Serum samples from 30 hepatitis C virus induced liver cirrhosis (HCV-LC) patients (study group) were collected from the outpatient clinic of Hepatology, the Post Graduate Institute of Medical Education and Research (PGIMER), Chandigarh, India. The sera from 20 age and sex-matched healthy individuals and 10 patients suffering from hepatitis C (HCV) were taken as controls. All subjects were diagnosed by serological–radiological detection according to the standard medical practice (Table 1) and were recruited in this study with their informed consent. The ethical committee of the PGIMER approved this study (Micro/2010/1092/3rd Mach 2010).Determination of the sialylation level of Hp in patients’ sera and in normal healthy controls by classical ELISA
The sialylation level of haptoglobin was assessed by ELISA using a sialic acid specific lectin, Sambucus nigra agglutinin (SNA, specificity: NeuAcα2-6 Gal). The wells of the microtiter plate were coated with 100 μl (2 μg per well) of monoclonal anti-haptoglobin (mAb-Hp, Sigma) in bicarbonate buffer (0.01 M Na2CO3 and 0.035 M NaHCO3, pH 9.6). The plates were kept at 4 °C for 24 h, washed with 100 μl 0.01 M PBS, pH 7.4, containing 0.05% Tween-20 and incubated with 100 μl of PBS containing 1% BSA at 37 °C for 1 h. To each well, 100 μl of diluted sera of HCV-LC patients and control groups were added (Hp concentration was adjusted to 100 mg dl−1). The plates were incubated at 25 °C for 1 h and then 100 μl of biotinylated SNA (1:1000 in blocking buffer) was added. On further incubation for 1 h and washing (three times as previously), 100 μl of streptavidin–HRP conjugate (1:10000 in blocking buffer) were added and incubated at room temperature for 1 h. After that 0.1% O-phenylenediamine dihydrochloride (OPD) (100 μl) and 0.05% H2O2 in 0.05 M citrate phosphate buffer (pH 5.0) were added to each well. The plate was left for 30 min at room temperature. The absorbance of each well was measured at 490 nm in an ELISA Reader. All experiments were done in triplicate.
Determination of lectin reactivity on monoclonal Hp by ELISA
A deglycosylated monoclonal Hp antibody (mAb-Hp) was prepared by sodium periodate oxidation. Monoclonal antihuman Hp was treated with 50 mM sodium periodate in 50 mM sodium acetate, pH 4.0 followed by incubation for 2 h in the dark at 4 °C. Next, the reaction mixture was dialyzed into PBS (pH 7.4) overnight with three changes of the buffer prior to use in ELISA.Each well of a 96 well microtiter plate (NUNC) was coated with different concentrations of treated as well as non-treated mAb-Hp (1, 2, 3, 4 and 5 μg per well) in buffer (0.01 M Na2CO3 and 0.035 M NaHCO3, pH 9.6) and kept at 4 °C for 24 h. The rest of the procedure was the same as in classical ELISA above.
In another experiment the binding of lectin with treated and non-treated mAb-Hp was studied in the absence of Hp. Wells were coated with different concentrations of both treated and non-treated mAb-Hp similarly as before. Here after blocking and washing with PBST, biotinylated SNA was added to the wells without addition of commercial Hp. Then the antibiotin–HRP conjugate was added to the wells followed by addition of the substrate and the rest of the procedure was the same as mentioned above.
Lectin blot analysis with sera from HCV-LC patients and controls
The sialylation level was monitored in both the control and HCV-LC patient groups by lectin blotting using SNA. Equal amounts of albumin and IgG depleted proteins (20 μg), from pooled sera (two groups, HCV-LC and control with 10 samples each) of both groups were separated on 10% SDS-PAGE. After the separation, proteins were electroblotted onto a nitrocellulose (NC) membrane with a constant current of 80 mA for 2 h at room temperature. The rest of the procedure was carried out as described above. The intensity levels of bands were calculated using Image J software. The statistical analysis was performed by the One-Way ANOVA test (p < 0.05).Plasmonic ELLSA for determination of sialylation of Hp
Different concentrations of commercial Hp and BSA (0.4, 0.6, 0.8, 1.0, 1.2 and 1.4 mg dl−1) were added to the wells of the ELISA plate and kept for 1 h at room temperature. After washing with 100 μl 0.01 M PBS, pH 7.4, containing 0.05% Tween-20, 100 μl of 150 μM H2O2 (in MES buffer, 2-(N-morpholino)ethanesulphonic acid, pH 6.5) and freshly prepared 100 μl of 0.2 mM gold solution (HAuCl4) in MES buffer were added to each well. The color change of the solution was observed after 15 min. Plasmonic ELLSA was performed on patients’ samples as done above in classical ELISA following the addition of gold solution in MES buffer.Characterization of the aggregation state of GNP from the assay by transmission electron microscopy (TEM)
The aggregation state of red and blue GNPs obtained after the assay was determined by TEM analysis. Briefly, 20 μl of the red/blue GNP solution from the wells of the ELISA plate were dropped on a carbon coated copper grid (300 mesh). Then the grid containing the drop of the sample solution was dried under vacuum. All the TEM measurements were performed in JEOL 2010 under an accelerating voltage of 100 kV.Conclusions
With newer glycoprotein analytes being included in modern diagnostics it is an urgent need to compare the carbohydrate portion of the glycoproteins where there has been a shift in paradigm so that the subtle changes in carbohydrate composition can be more specific and sensitive biomarkers than the overall concentration change of the corresponding glycoproteins. Hepatic clearance of serum glycoproteins is characterized by the hydrolysis of terminal sialic acid exposing the galactose to be subsequently captured by the surface asialoglycoprotein receptor of liver cells to remove them from circulation. Liver cirrhosis, being the intermediate stage in between HCV and HCC, demonstrates subtle differences in the mentioned asialylation of glycoproteins. For the first time to our current endeavor we have demonstrated the clinical correlation between the increase in the serum concentration of desialylation of Hp and the clinical manifestation of the HCV-LC from HCV. Liver biopsy has been accepted as the gold standard method in the determination of a degenerative liver condition like in cirrhotic liver, however, a recent cohort study on liver cirrhosis patients demonstrated that even after liver biopsy, cirrhosis remained under-documented and under-diagnosed in many cases.29 Over and above, this highly invasive study cannot be adopted as the monitoring procedure or as a routine investigation as the existing literature indicated a substantial mortality following liver biopsy because of fatal complications such as pneumothorax, perforation of other organs, sepsis along with heavy bleeding.30 A recent multi-cohort mathematical model of Hepatitis C predicted an alarming increase in the proportion of cirrhosis from 25% in 2010 to 45% in 2030 worldwide.31 Therefore, a convincing, fast, and easy serological test requiring no specialized technical support is an urgent need for the diagnosis and management of cirrhosis in times of this liver disease pandemic. In this current study we have established that increase in serum asialo-Hp can be employed as the marker to determine the progress of HCV to HCV-LC, which reflects the damage of the surface asialoglycoprotein receptors on the liver cells in a cirrhotic condition. We have demonstrated a new non-MALDI, non-chromatographic assay platform for estimation of sialylation of Hp directly from the whole serum by a new GNP-plasmon based visual detection assay for the easy, cheap and fast detection of the serum Hp-desialylation status which would prove to be effective for visual detection of liver cirrhosis and serological monitoring of the same. This assay can determine the level of asialo-Hp and thus can distinctively monitor the clinical cases of HCV and HCV-LC only by a visually distinct color change from red to blue and can be very useful in resource stringent countries. Moreover, alcohol induced liver damage or alcoholic liver disease has also become a prominent cause of liver cirrhosis. Down regulation of liver Galβ1,4GlcNAc α2,6-sialyltransferase and thus lowering of the sialylated form of plasma proteins has recently been found to be associated with alcohol induced liver damage/alcoholic liver cirrhosis which are mostly considered as the prelude to HCC.18,19 Therefore, for better management and surveillance of HCC, early assessment of alcohol abuse that leads to LC can serve as a crucial step forward.32 Our plasmonic detection platform can be an excellent addition to the existing diagnostic framework for the rapid, cheap and easy routine assessment of alcohol abuse leading to LC.Acknowledgements
PPB thanks the Department of Science and Technology (DST), India for the Fast Track Young Scientist-DST-SERB project (SB/FTP/CS-017/2013) and Bose Institute, Kolkata for research infrastructure. BPC wishes to thank the Indian Science Congress Association for ‘Sir Asutosh Mookerjee fellowship’ [2310/73/2013-2014]. We are thankful to Dr Y. K. Chawla, Director, PGIMER, Chandigarh, India for his helpful advice. The authors declare no conflict of interest in this work.Notes and references
- C. I. Balog, K. Stavenhagen, W. L. Fung, C. A. Koeleman, L. A. McDonnell, A. Verhoeven, W. E. Mesker, R. A. Tollenaar, A. M. Deelder and M. Wuhrer, Mol. Cell. Proteomics, 2012, 11, 571–585 CAS.
- A. Mehta, P. Norton, H. Liang, M. A. Comunale, M. Wang, L. Rodemich-Betesh, A. Koszycki, K. Noda, E. Miyoshi and T. Block, Cancer Epidemiol., Biomarkers Prev.: Curr. Concepts, 2012, 21, 925–933 CrossRef CAS PubMed.
- M. L. deLeoz, L. J. Young, H. J. An, S. R. Kronewitter, J. Kim, S. Miyamoto, A. D. Borowsky, H. K. Chew and C. B. Lebrilla, Mol. Cell. Proteomics, 2011, 10, M110.002717-1 Search PubMed.
- R. L. Renee, S. Miyamoto and C. B. Lebrilla, Mol. Cell. Proteomics, 2013, 12, 846–855 Search PubMed.
- S. R. Kronewitter, M. L. De Leoz, J. S. Strum, H. J. An, L. M. Dimapasoc, A. Guerrero, S. Miyamoto, C. B. Lebrilla and G. S. Leiserowitz, Proteomics, 2012, 12, 2523–2538 CrossRef CAS PubMed.
- D. J. Harvey, Proteomics, 2005, 5, 1774–1786 CrossRef CAS PubMed.
- M. Guillard, J. Gloerich, H. J. Wessels, E. Morava, R. A. Wevers and D. J. Lefeber, Carbohydr. Res., 2009, 344, 1550–1557 CrossRef CAS PubMed.
- J. Bruix, L. Boix, M. Sala and J. M. Llovet, Cancer Cell., 2004, 5, 215–219 CrossRef CAS PubMed.
- M. C. Kew, J. Hepatocell. Carcinoma, 2014, 1, 115–125 CrossRef.
- Y. F. Liaw, Semin. Liver Dis., 2005, 25, 40–47 CrossRef PubMed.
- K. Koike, Clin. Gastroenterol. Hepatol., 2005, 3, S132–S135 CrossRef CAS PubMed.
- F. X. Bosch, J. Ribes and J. Borras, Semin. Liver Dis., 1999, 19, 271–285 CrossRef CAS PubMed.
- E. Caturelli, F. Bartolucci, E. Biasini, M. L. Vigliotti, A. Andriulli, D. A. Siena, V. Attino and M. Bisceglia, Am. J. Gastroenterol., 2002, 97, 397–405 CrossRef PubMed.
- L. Bolondi, J. Hepatology, 2003, 39, 1076–1084 CrossRef.
- B. Daniele, A. Bencivenga, A. S. Megna and V. Tinessa, Gastroenterology, 2004, 127, S108–S112 CrossRef.
- R. Tateishi, S. Shiina, H. Yoshida, T. Teratani, S. Obi, N. Yamashiki, H. Yoshida, M. Akamatsu, T. Kawabe and M. Omata, Hepatology, 2006, 44, 1518–1527 CrossRef CAS PubMed.
- A. Colli, M. Fraquelli, G. Casazza, S. Massironi, A. Colucci, D. Conte and P. Duca, Am. J. Gastroenterol., 2006, 101, 513–523 CrossRef CAS PubMed.
- J. B. Burgess, J. U. Baenzigearn and W. R. Brown, Hepatology, 1992, 15, 702–706 CrossRef CAS PubMed.
- M. Gong, M. Garige, K. Hirsch and M. R. Lakshman, Metabol. Clin. Exp., 2007, 56, 1241–1247 CrossRef CAS PubMed.
- H. Shu, X. Kang, K. Guo, S. Li, M. Li, L. Sun, L. Gan, Y. Liu and X. Qin, Oncol. Rep., 2010, 24, 1271–1276 CAS.
- S. Zhang, H. Shu, K. Luo, X. Kang, Y. Zhang, H. Lu and Y. Liu, Mol. BioSyst., 2011, 7, 1621–1628 RSC.
- H. Shu, S. Zhang, X. Kang, S. Li, X. Qin, C. Sun, H. Lu and Y. Liu, Acta Biochim. Biophys. Sin., 2011, 43, 528–534 CrossRef CAS PubMed.
- M. Nakano, T. Nakagawa, T. Ito, T. Kitada, T. Hijioka, A. Kasahara, M. Tajiri, Y. Wada, N. Taniguchi and E. Miyoshi, Int. J. Cancer, 2008, 122, 2301–2309 CrossRef CAS PubMed.
- T. Fujimura, Y. Shinohara, B. Tissot, P. C. Pang, M. Kurogochi, S. Saito, Y. Arai, M. Sadilek, K. Murayama, A. Dell, S. Nishimura and S. Hakomori, Int. J. Cancer, 2008, 39–49 CrossRef CAS PubMed.
- R. de la Rica and M. M. Stevens, Nat. Nanotechnol., 2012, 7, 821–824 CrossRef CAS PubMed.
- P. D. Howes, S. Rana and M. M. Stevens, Chem. Soc. Rev., 2014, 13, 3835–3853 RSC.
- M. Liljeblad, A. Lundblad and P. Pahlsson, Biosens. Bioelectron., 2002, 17, 883–891 CrossRef CAS PubMed.
- M. C. Bordasa, N. S. Serbource-Goguela, J. M. Fegera, J. M. Maccariob, J. M. Agneraya and G. M. Durand, Clin. Chim. Acta, 1982, 125, 311–318 CrossRef.
- S. C. Gordon, L. E. Lamerato, L. B. Rupp, S. D. Holmberg, A. C. Moorman, P. R. Spradling, E. Teshale, F. Xu, J. A. Boscarino, V. Vijayadeva, M. A. Schmidt, N. Oja-Tebbe and M. Lu, Am. J. Gastroenterol., 2015, 110, 1169–1177 CrossRef CAS PubMed.
- D. C. Rockey, S. H. Caldwell, Z. D. Goodman, R. C. Nelson and A. D. Smith, Liver biopsy, Hepatology, 2009, 49, 1017–1044 Search PubMed.
- G. L. Davis, M. J. Alter, H. El-Serag, T. Poynard and L. W. Jennings, Gastroenterology, 2010, 138, 513–521 CrossRef PubMed.
- E. Gruszewska, B. Cylwik, A. Panasiuk, M. Szmitkowski, R. Flisiak and L. Chrostek, Biomed. Res. Int., 2014, 2014, 876096 Search PubMed.
Footnotes |
| † Electronic supplementary information (ESI) available. See DOI: 10.1039/c5an02000j |
| ‡ Current address: Division of Molecular medicine, Bose Institute, Kolkata 700054, India. |
| This journal is © The Royal Society of Chemistry 2016 |