 Open Access Article
Creative Commons Attribution 3.0 Unported Licence
Magnetoelastic coupling in the cobalt adipate metal–organic framework from quasi-harmonic lattice dynamics†
Katrine L.
Svane
a,
Paul J.
Saines
bc and
Aron
Walsh
*ad
aDepartment of Chemistry, University of Bath, Bath, UK. E-mail: A.Walsh@bath.ac.uk
bSchool of Physical Sciences, University of Kent, UK
cSchool of Chemistry, University of Oxford, UK
dDepartment of Materials Science and Engineering, Yonsei University, Seoul, Korea
First published on 25th September 2015
Abstract
Magnetic interactions in hybrid materials are poorly understood compared to those in purely inorganic materials. The high flexibility of many metal–organic systems introduces a strong temperature dependence of the magnetic exchange interactions owing to changes in the crystal structure. Here, we study the cobalt adipate system, for which anisotropic thermal expansion was recently shown to be a result of magnetoelastic coupling. The combination of density functional theory with quasi-harmonic lattice dynamics is shown to be a powerful tool for describing temperature dependent thermodynamic potentials that determine magnetic interactions. It is demonstrated that the effect of phonons can be sufficient to switch the preference for ferromagnetic versus antiferromagnetic ordering.
1 Introduction
Metal–organic frameworks (MOFs), consisting of small metal clusters connected by organic linkers, have received great interest due to the tunability inherent from the many possible combinations of metal and ligand.1 Initial studies focused on porous structures because of their promising applications within gas storage2 and catalysis.3 More recently attention has been drawn to properties typical of purely inorganic materials such as multiferroics4–6 and extended magnetic ordering.7 These are often observed in dense frameworks which have shorter connection paths between the metal atoms than their porous counterparts.The advantage of using MOFs as magnetic materials lies in their tunability. The magnetic coupling between two transition metal atoms is sensitive to the length and geometry of the super-exchange pathway, which can be varied by the rich choice of organic building blocks.8 A number of MOFs have already been synthesized with interesting magnetic properties such as low-dimensional magnetism,8–10 spin-flop transitions,11 magneto-caloric effects12–14 and magnetoelastic coupling.15,16 These effects are readily identified experimentally, however there is a need for a deeper theoretical understanding in order to direct further synthesis.
Here we use density functional theory (DFT) to study Co(adipate), Co(C6H8O4), in order to understand the complex compromise between energy contributions from lattice geometry, magnetic interactions and lattice vibrations which lead to the observed magnetoelastic coupling. We show that the magnetic coupling as well as the phonon spectrum is dependent on the volume of the material. It is therefore necessary to consider the thermal expansion of the ferromagnetic (FM) and antiferromagnetic (AFM) states in the quasi-harmonic approximation to accurately predict the energy balance between them.
2 Computational details
Spin-polarised density functional theory calculations were performed using the Vienna ab initio simulation package (VASP)17 with PAW pseudopotentials. The PBEsol18 functional was used to describe the exchange–correlation energy. The magnetic unit cell (cf.Fig. 1), together with periodic boundary conditions, were used to model the infinite crystal, and the Brillouin zone was sampled with 1 × 2 × 2 k-points. For optimisation of the unit cell vectors at different volumes and for the calculation of lattice vibrations an energy cutoff of 700 eV was used, while a cutoff of 500 eV was used for the calculation of different magnetic configurations in the fixed AFM unit cell. As phonon calculations require tight convergence we furthermore set the EDIFF tag to 10−8, while 10−6 was used for all other calculations. All structures were relaxed to a maximum force of 0.01 eV per atom. Spin–orbit coupling was not considered, as the effect is generally weak for 3d-metals. | ||
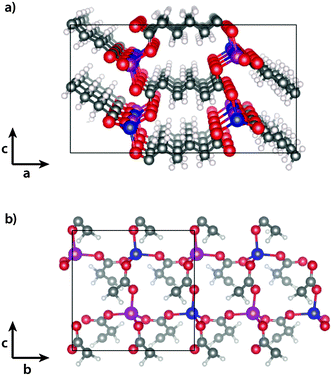
| Fig. 1 Experimentally determined15 magnetic structure of cobalt adipate (a) in the ac- and (b) in the bc-planes. The cobalt atoms are coloured blue (magenta) for spin aligned parallel (antiparallel) to the a-axis. Carbon is grey, oxygen red and hydrogen white. | ||
Lattice vibrations were calculated using Phonopy.19 The force constants were obtained by the finite-displacement method,20 which in our case required force-evaluations for 114 symmetry-inequivalent displacements and fitting of the force vs. displacement to a harmonic function. The displacements were performed in the 1 × 1 × 1 magnetic unit cell due to the large size of this cell, and thus only the phonon dispersion at the Γ-point is considered.
In the harmonic approximation the bond lengths do not change with temperature, but the vibrational states calculated at the 0 K volume are populated according to Bose–Einstein statistics.
In the quasi-harmonic approximation20,21 the effect of thermal expansion is taken into account by considering the anharmonic contribution arising from the volume-dependency of the phonon frequencies. The equilibrium volume (V) at a given temperature (T) and pressure (p) is the volume that minimises the Helmholtz free energy, F(T,V), to give the Gibbs free energy:
| G(T,p) = minV{F(T,V)} |
| = minV{U(V) + Fphonon(T,V) + pV} | (1) |
3 Results
The experimentally determined magnetic structure of Co(adipate)15 is shown in Fig. 1. The Co atoms interact antiferromagnetically via long-range super-exchange through the carboxylic acid groups of the adipate molecules in the b- and c-direction, while a weaker ferromagnetic coupling is found along the a-vector. Field-cooled magnetic susceptibility measurements show an onset of magnetic ordering at 15 K, which is accompanied by a change in the lattice parameters. The b- and c-vectors expand upon increasing temperatures, while negative thermal expansion is observed along the a-vector.DFT was used to optimise the unit cell in the ferromagnetic (FM) and in the experimentally determined antiferromagnetic (AFM) state15 (cf. Computational section for details). The optimised lattice parameters are given in Table 1 along with the experimentally determined values at 10 K. The lattice parameters of the FM and AFM states are both close to the values determined by experiment, however small differences are predicted between the two states, resulting in the FM state having a slightly larger volume than the AFM state.
| DFT, AFM | DFT, FM | Exp.15 | |
|---|---|---|---|
| a [Å] | 15.99 | 15.93 | 16.147 |
| b [Å] | 9.67 | 9.69 | 9.586 |
| c [Å] | 9.42 | 9.46 | 9.248 |
| β [°] | 91.1 | 91.0 | 90.2 |
| V [Å3] | 1455 | 1459 | 1432 |
The magnetic coupling can be described by the Ising-model Hamiltonian:
 | (2) |
The value of Jij depends on the geometry of the exchange path. For the present system the exchange paths are identical along the b-vector, and can be described by a single exchange-constant, Jb. Similarly, the coupling is equivalent by symmetry in the c-direction and is described by Jc. In the a-direction two different couplings exist, but both are expected to be significantly smaller than Jb and Jc, and indistinguishable within the computational accuracy, and they are thus described by a single parameter, Ja.
In the simplest approximation we set Ja = 0, and assume Jb = Jc due to the similar distances between the Co-atoms along these two directions (4.83 Å along the b-direction and 4.72 Å along the c-direction). The exchange constant can then be found from the energies of the FM and the AFM states, EFM and EAFM, as:
 | (3) |
 , and each of the N = 8 ions interacts with z = 4 neighbours. Using the energies of the AFM and FM structures in their respective optimised unit cells results in an exchange constant of J = −0.08 meV. The uncertainty associated with comparing numbers calculated in different unit cells is estimated by calculating both EAFM and EFM in the same unit cell. For the optimised AFM unit cells this results in a value of J = −0.15 meV, while a similar calculation in the optimised FM unit cell gives J = −0.12 meV. We conclude that similar results are obtained by comparing numbers in slightly different unit cells, or by comparing numbers where either the AFM or the FM structure is not in its optimised unit cell. From mean-field theory it is possible to estimate the critical temperature from the exchange constant using the formula:
 | (4) |
We also attempted a more complicated analysis allowing different, nonzero values for all three exchange constants. The energy of 26 different magnetic configurations‡ were fitted to eqn (2) by a simple linear least squares method, giving values of Ja = 0.003 meV, Jb = 0.060 meV and Jc = −0.366 meV. This is not consistent with the experimental data, as it predicts ferromagnetic coupling along the b-vector, implying that the magnetic unit cell should be identical to the structural unit cell. The error is probably a result of the limited accuracy of DFT in describing weak magnetic interactions which involve very small energy differences. However, since the simple approximation in which Jb = Jc and Ja = 0 accurately reproduces the experimentally determined transition temperature the chosen method is still considered suitable for calculations involving the energy difference between those two states.
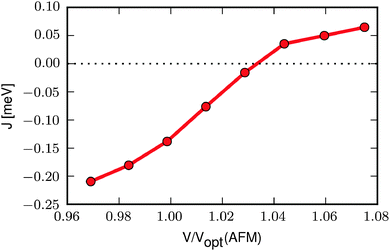
We now take a closer look at the relation between the magnetic interaction and the unit cell volume. To this end we optimise the FM and AFM structures at different volumes and calculate the exchange constant according to eqn (3) at each volume. The result, shown in Fig. 2, reveals that J increases with increasing volume, becoming positive (i.e. ferromagnetic) at a volume approximately 3% larger than the optimised volume of the AFM state (Vopt(AFM)). If, instead, the volume is decreased, e.g. as a result of an increased pressure, the AFM interaction becomes stronger and the transition temperature should increase.
 | ||
| Fig. 2 Exchange constant as a function of volume relative to the optimised volume of the AFM state, Vopt(AFM). | ||
3.1 Phonon energies
The different unit cell dimensions and volumes of the FM and AFM structures mean that they will have different phonon energies. In the following we investigate how these differences affect the energy balance between the two states.Fig. 3a shows the phonon partial density of states (PDOS) for the optimised AFM structure (cf. Computational section for details). The cobalt atoms are represented in the low-energy band below 500 cm−1, while the range 500–1500 cm−1 covers vibrations within the organic molecules involving the C-, O- and H-atoms. The isolated band at ca. 3000 cm−1 contains the C–H stretch modes (see ESI† for .gif files of selected modes representing the three bands). The PDOS for the FM structure appears identical and is therefore not shown. Likewise, only subtle differences are found between PDOS obtained at different volumes. These are most clearly identified by plotting the zero point energy (ZPE) as a function of volume (Fig. 3b). The ZPE decreases with increasing volume for both the FM and the AFM states, and furthermore, even though the unit cells of the two states are not identical at a given volume, the ZPEs are nearly equal. The decrease in ZPE with increasing volume arises because the increasing bond lengths lead to slightly wider energy potentials, and thereby lower phonon energies.
In the following we consider the difference in Gibbs free energy between the AFM and FM states as a function of temperature:
| ΔG(T) = GFM(T) − GAFM(T) | (5) |
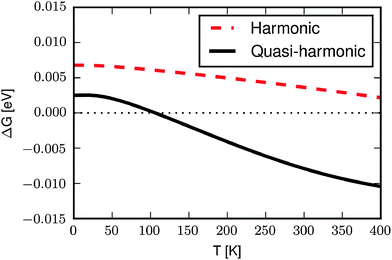
Fig. 4 shows ΔG(T) with the phonon energies calculated in the harmonic approximation (red line) and in the quasi-harmonic approximation (black line). In the harmonic approximation the vibrational energy is calculated at the 0 K volume and the only effect of temperature is to excite the vibrational modes beyond the ground state. The free energy difference at 0 K, ΔG(0), is 6.8 meV which is smaller than the DFT internal energy difference of 12 meV. This is because the FM state has a larger volume than the AFM state, resulting in a lower ZPE. The energy difference becomes smaller with increasing temperatures, not as a result of an increasing difference in the vibrational energy, but rather as a result of the increasing contribution from vibrational entropy. The wider potentials associated with the larger volume of the FM state lead to larger vibrational entropy. As the entropy becomes more important with increasing temperatures the energy difference between the AFM and FM states decrease, however the AFM state remains the most stable over the shown temperature range.
In the quasi-harmonic approximation (Fig. 4, black line) thermal expansion is included by considering the volume-dependence of the phonon frequencies (cf. Computational section). This results in 0 K volumes that are approximately 3% larger than in the harmonic approximation, because the higher electronic energy of the larger unit cell is compensated by the softening of the phonon modes. The difference in electronic (DFT) energy at 0 K is 10 meV, but ΔG(0) is only 2.1 meV due to the difference in ZPE. As the temperature increases ΔG(T) becomes smaller and at 100 K the FM and AFM states are equal in energy.
3.2 Unit cell parameters
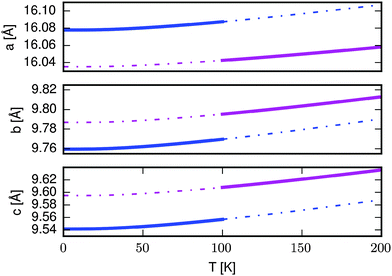
We now consider the effect that the magnetic transition predicted in the quasiharmonic approximation would have on the lattice parameters. Fig. 5 shows the lattice constants as a function of temperature for the AFM (blue) and FM (magenta) structures. The full lines indicate the lattice constants that would be observed assuming that the magnetic transition happens at 100 K, while the dashed lines indicate the lattice constants of the AFM (FM) state in their unstable region above (below) the transition temperature. The a-vector contracts when increasing the temperature above 100 K while the b- and c-vectors expand. Inspection of the dashed lines shows that the direction of change would be the same even if the transition happened at a different temperature. The same direction of change is observed experimentally when going from the ordered AFM to the disordered state. While we cannot model the disordered state by periodic boundary conditions DFT, we speculate that it has unit cell dimensions similar to the FM state, giving rise to the observed changes.Our calculations demonstrate that the energy balance between the AFM and FM states is very sensitive, because the magnetoelastic coupling implies that a change in magnetic ordering is accompanied by a change in the vibrational energies as well as the vibrational entropy. In the present case we predict a transition from the AFM to the FM state at 100 K, however this is above the temperature where the transition to a disordered state is predicted to happen (10–18 K).
For the synthesis of a material where a change in magnetic state is possible, as well as for many other purposes, it would be desirable to have a higher critical temperature. This could be achieved by a stronger magnetic coupling, e.g. by use of a different metal such as Mn, which has 5 unpaired electrons in the high-spin state. Indeed, optimisation of the Co(adipate) structure with Co replaced by Mn leads to a predicted transition temperature of 96 K from eqn (4). This compound also exhibits magnetoelastic coupling, though in this case the a- and b-vectors change by less than 0.01 Å while the c-vector expands by 0.02 Å when going from the AFM to the FM state. Experimentally, however, the combination of Mn and adipate has been reported to result in two different crystal structures, both of which are different to the Co(adipate) structure.23,24 The Mn2(H2O)(CO2(CH2)4CO2)2 structure reported in ref. 24 consists of sixfold coordinated Mn atoms and has a low magnetic ordering temperature of 4.7 K, while half of the Mn atoms are sixfold coordinated and the other half are fivefold coordinated in the Mn2(CO2(CH2)4CO2)(OH)2 structure reported in ref. 23. Measurements of the magnetic ordering were not possible for the latter compound, but the related Mn2(CO2(CH2)2CO2)(OH)2 was reported to have an unusually high magnetic ordering temperature of 44 K, showing that this class of MOFs has potential as materials with strong magnetic coupling and interesting related properties.
Finally we note that magnetoelastic coupling has been observed in the formate perovskite [(CH3)2NH2]Co(HCOO)3.16 As in the cobalt adipate structure the metal atoms in this structure are connected through O–C–O bridges, suggesting this linkage as a motif of interest for further research into magnetoelastic materials.
4 Conclusion
In summary, we have studied the magnetic MOF cobalt adipate by first-principles lattice dynamics. The unit cells of the AFM and FM ordered states were found to be slightly different, confirming the experimental finding of magnetoelastic coupling. The exchange constant as well as the phonon energies were found to depend on the unit cell volume. This affects the energy balance between the two magnetic states, and if thermal expansion is taken into account the FM state becomes more stable than the AFM state above 100 K. The resulting change in the lattice constants is similar to the experimentally observed change upon loss of magnetic order.Acknowledgements
We thank Jonathan M. Skelton for useful discussions. This work is supported by ERC programme grant no. 277757. The authors acknowledge computing support from the UK national supercomputing service (ARCHER), via membership of the UK Materials Chemistry Consortium which is funded by EPSRC (EP/L000202), and from the University of Bath computing services (Balena). PJS would like to thank the Glasstone Trust for funding via a fellowship.References
- G. Ferey, Chem. Soc. Rev., 2008, 37, 191–214 RSC.
- S. Ma and H.-C. Zhou, Chem. Commun., 2010, 46, 44–53 RSC.
- J. Lee, O. K. Farha, J. Roberts, K. A. Scheidt, S. T. Nguyen and J. T. Hupp, Chem. Soc. Rev., 2009, 38, 1450–1459 RSC.
- P. Jain, V. Ramachandran, R. J. Clark, H. D. Zhou, B. H. Toby, N. S. Dalal, H. W. Kroto and A. K. Cheetham, J. Am. Chem. Soc., 2009, 131, 13625–13627 CrossRef CAS PubMed.
- A. Stroppa, P. Jain, P. Barone, M. Marsman, J. M. Perez-Mato, A. K. Cheetham, H. W. Kroto and S. Picozzi, Angew. Chem., Int. Ed., 2011, 50, 5847–5850 CrossRef CAS PubMed.
- G.-C. Xu, W. Zhang, X.-M. Ma, Y.-H. Chen, L. Zhang, H.-L. Cai, Z.-M. Wang, R.-G. Xiong and S. Gao, J. Am. Chem. Soc., 2011, 133, 14948–14951 CrossRef CAS PubMed.
- M. Kurmoo, Chem. Soc. Rev., 2009, 38, 1353–1379 RSC.
- C.-B. Tian, C. He, Y.-H. Han, Q. Wei, Q.-P. Li, P. Lin and S.-W. Du, Inorg. Chem., 2015, 54, 2560–2571 CrossRef CAS PubMed.
- P. Canepa, Y. J. Chabal and T. Thonhauser, Phys. Rev. B: Condens. Matter Mater. Phys., 2013, 87, 094407 CrossRef.
- P. J. Saines, J.-C. Tan, H. H.-M. Yeung, P. T. Barton and A. K. Cheetham, Dalton Trans., 2012, 41, 8585–8593 RSC.
- P. J. Saines, P. T. Barton, P. Jain and A. K. Cheetham, CrystEngComm, 2012, 14, 2711–2720 RSC.
- G. Lorusso, J. W. Sharples, E. Palacios, O. Roubeau, E. K. Brechin, R. Sessoli, A. Rossin, F. Tuna, E. J. L. McInnes, D. Collison and M. Evangelisti, Adv. Mater., 2013, 25, 4653–4656 CrossRef CAS PubMed.
- P. J. Saines, J. A. M. Paddison, P. M. M. Thygesen and M. G. Tucker, Mater. Horiz., 2015, 2, 528–535 RSC.
- Y. Meng, Y.-C. Chen, Z.-M. Zhang, Z.-J. Lin and M.-L. Tong, Inorg. Chem., 2014, 53, 9052–9057 CrossRef CAS PubMed.
- P. J. Saines, P. T. Barton, M. Jura, K. S. Knight and A. K. Cheetham, Mater. Horiz., 2014, 1, 332 RSC.
- R. I. Thomson, P. Jain, A. K. Cheetham and M. A. Carpenter, Phys. Rev. B: Condens. Matter Mater. Phys., 2012, 86, 214304 CrossRef.
- G. Kresse and J. Hafner, Phys. Rev. B: Condens. Matter Mater. Phys., 1993, 47, 558–561 CrossRef CAS.
- J. P. Perdew, A. Ruzsinszky, G. I. Csonka, O. A. Vydrov, G. E. Scuseria, L. A. Constantin, X. Zhou and K. Burke, Phys. Rev. Lett., 2008, 100, 136406 CrossRef PubMed.
- A. Togo, F. Oba and I. Tanaka, Phys. Rev. B: Condens. Matter Mater. Phys., 2008, 78, 134106 CrossRef.
- R. Stoffel, C. Wessel, M.-W. Lumey and R. Dronskowski, Angew. Chem., Int. Ed., 2010, 49, 5242–5266 CrossRef CAS PubMed.
- E. L. da Silva, J. M. Skelton, S. C. Parker and A. Walsh, Phys. Rev. B: Condens. Matter Mater. Phys., 2015, 91, 144107 CrossRef.
- P. Vinet, J. R. Smith, J. Ferrante and J. H. Rose, Phys. Rev. B: Condens. Matter Mater. Phys., 1987, 35, 1945–1953 CrossRef CAS.
- P. J. Saines, P. Jain and A. K. Cheetham, Chem. Sci., 2011, 2, 1929–1939 RSC.
- Y. Kim, E. Lee and D.-Y. Jung, Chem. Mater., 2001, 13, 2684–2690 CrossRef CAS.
Footnotes |
| † Electronic supplementary information (ESI) available: .gif files of selected phonon modes. Optimised structures and output from phonon calculations can be retrieved from http://https://github.com/WMD-Bath/Phonons. See DOI: 10.1039/c5tc02633d |
| ‡ The unit cell containing 8 Co atoms has 28 = 256 possible magnetic states of which 28 are inequivalent by symmetry. Of these 26 were stable when optimised in the AFM unit cell, while the last two structures changed to different magnetic configurations during the relaxation. |
| This journal is © The Royal Society of Chemistry 2015 |


