 Open Access Article
Controllable molecular aggregation and fluorescence properties of 1,3,4-oxadiazole derivatives†
Haitao
Wang
ab,
Fangyi
Chen
a,
Xiaoshi
Jia
a,
Huimin
Liu
a,
Xia
Ran
c,
Mahesh Kumar
Ravva
d,
Fu-Quan
Bai
b,
Songnan
Qu
e,
Min
Li
*a,
Hong-Xing
Zhang
*b and
Jean-Luc
Brédas
*d
aKey Laboratory of Automobile Materials (MOE) & College of Materials Science and Engineering, Jilin University, Changchun 130012, China. E-mail: minli@jlu.edu.cn
bInstitute of Theoretical Chemistry, Jilin University, Changchun 130023, China. E-mail: zhanghx@jlu.edu.cn
cDepartment of Physics, School of Physics and Electronics, Henan University, Kaifeng, P. R. China
dDivision of Physical Sciences and Engineering, King Abdullah University of Science and Technology – KAUST, Thuwal 23955-6900, Kingdom of Saudi Arabia. E-mail: jean-luc.bredas@kaust.edu.sa
eKey Laboratory of Excited State Processes, Changchun Institute of Optics, Fine Mechanics and Physics, Chinese Academy of Sciences, Changchun 130033, China
First published on 14th October 2015
Abstract
The molecular self-assembly behaviour of 2,2′-bis-(4-hexyloxyphenyl)-bi-1,3,4-oxadiazole (BOXD-6) in solution, on surfaces and in bulk crystals, and its photo-physical properties were studied via a combination of experimental techniques and theoretical calculations. It is found that BOXD-6 molecules self-assemble into both H- and J-aggregates at moderate concentration (∼10−4 M) and then transit to exclusive J-aggregates at higher concentration (∼10−3 M) in tetrahydrofuran. In H-aggregation (α polymorph), BOXD-6 adopts a linear conformation and forms a one-dimensional layered structure; in J-aggregation (β polymorph), it adopts a Z-shaped conformation and forms a more ordered two-dimensional layered structure. A π-stacking structure is observed in both cases, and adjacent molecules in J-aggregation show larger displacement along the molecular long axis direction than that in H-aggregation. Although J-aggregates are almost the only component in concentrated solutions (10−3 M), both H- and J-aggregates can be obtained if concentrated solution is transformed onto substrates through a simple drop-casting method. Such a phase transition during film formation can be easily avoided by adding water as a precipitator; a film with pure J-aggregates is then obtained. In order to get more information on molecular self-assembly, intermolecular interaction potential energy surfaces (PES) were evaluated via theoretical calculations at the DFT level (M062x/6-31G**). The PES not only confirm the molecular stacking structures found in crystals but also predict some other likely structures, which will be the target of future experiments.
1 Introduction
π-Conjugated organic semiconductors have attracted much attention due to their applications in low-cost and flexible organic electronic devices, e.g., organic light-emitting diodes (LEDs),1–7 field-effect transistors (FETs),8–12 and solar cells (SCs).13–18 It has been demonstrated that not only the molecular structure but also the molecular packing in the solid state plays an important role in the light-emitting and charge-transporting properties.19–25 Although great progress has been made in understanding the effect of the molecular structure on the optoelectronic properties, a challenge still remains in developing the transition from some well-established ‘molecular’ characteristics to some desirable ‘material’ (collective) properties.21 For example, molecules can show high light-emission efficiency in dilute solutions; however, quenching occurs in concentrated solutions and solid states because of the aggregation of chromophores.26 Therefore, it is useful to develop organic solid-state films with high light-emission efficiency.Molecular crystals, where the molecular conformational and packing structures are clear, provide ideal models for studying the relationship between the molecular arrangements and the semi-conducting properties in the solid state. Thus, they have attracted many efforts both in academia and in industry.23–25,27–30 However, many of these crystals grow spontaneously and it is highly desirable to gain control over the molecular self-assembled structures. With this goal in mind, here we present the characterization of the molecular self-assembled structures of 2,2′-Bis-(4-hexyloxyphenyl)-bi-1,3,4-oxadiazole (BOXD-6, Scheme 1) in solutions, on surfaces, and in bulk crystals. An effective way was discovered to control the molecular self-assembly on substrates. In order to get an in-depth understanding of the molecular self-assembly, the intermolecular interaction potential energy surfaces were also evaluated through theoretical calculations at the Density Functional Theory (DFT) level.
2 Experimental and computational details
2.1 Materials and experimental techniques
The synthesis of BOXD-6 was reported previously; the purity was verified by FT-IR, 1H NMR spectroscopy, and elemental analysis.31 All the solvents for spectral measurements were of spectroscopic grade and used as received. UV-vis absorption spectra were obtained using a Shimadzu UV-2550 spectrometer. Photoluminescence spectra were collected using a Perkin-Elmer LS55 spectrophotometer. The room-temperature luminescence quantum yields in solutions were determined relative to quinine sulfate in sulfuric acid aqueous solution (0.546), and calculated according to the following equation: Φunk= Φstd(Iunk/Aunk)(Astd/Istd)(ηunk/ηstd)2, where Φunk is the radiative quantum yield of the sample; Φstd is the radiative quantum yield of the standard; Iunk and Istd are the integrated emission intensities of the sample and the standard, respectively; Aunk and Astd are the absorptions of the sample and the standard at the excitation wavelength, respectively; and ηunk and ηstd are the indexes of refraction of the sample and standard solutions (pure solvents were assumed), respectively. Powder X-ray diffraction (XRD) measurements were carried out using a Bruker Avance D8 X-ray diffractometer (Cu Kα radiation, λ = 1.54 Å). The single crystal data were collected on a Rigaku R-AXIS RAPID IP diffractometer using a graphite monochromator for Mo Kα radiation (λ = 0.71073 Å) at room temperature (293 K) using the ω-scan technique. Absorption corrections were applied. The structures were solved by direct methods and refined by full matrix least-square techniques using the SHELXTL package. Anisotropic thermal parameters were assigned to all non-hydrogen atoms. The hydrogens were included in the structure factor calculation at idealized positions by using a riding model and refined isotropically. The crystallographic data of the derivatives are listed in Table 1. SEM measurements were taken using a JEOL JSM-6700F apparatus. All the samples were coated with gold before observation.| α | β | |
|---|---|---|
| Empirical formula | C28H34N4O4 | C28H34N4O4 |
| Molecular weight | 490.59 | 490.59 |
| Crystal system | Triclinic | Triclinic |
| Space group |
P![[1 with combining macron]](https://www.rsc.org/images/entities/char_0031_0304.gif) |
P![[1 with combining macron]](https://www.rsc.org/images/entities/char_0031_0304.gif) |
| Z | 2 | 1 |
| a, Å | 8.166(6) | 8.134(6) |
| b, Å | 13.066(9) | 8.142(7) |
| c, Å | 14.357(14) | 10.657(12) |
| α, ° | 65.13(3) | 110.13(4) |
| β, ° | 73.59(3) | 93.00(4) |
| γ, ° | 86.14(3) | 98.55(3) |
| V, Å3 | 1330.84 | 651.219 |
| ρ | 1.224 | 1.251 |
| Total reflections | 10![[thin space (1/6-em)]](https://www.rsc.org/images/entities/char_2009.gif) 326 326 |
6429 |
| Unique reflections | 4582 | 2936 |
| R int | 0.0456 | 0.0282 |
| R 1, wR2 | 0.0699, 0.1677 | 0.0507, 0.1281 |
| R 1, wR2 (all data) | 0.1521, 0.2043 | 0.0883, 0.1432 |
2.2 Computational details
In the calculation, the hexyloxy group (–OC6H13) of BOXD-6 was replaced by a methoxy group (BOXD-1, Scheme 1) to save computational time. The monomer structure of BOXD-1 in the ground state was optimized at the M062x/6-311+G** level.32 The intermolecular interaction potential energy surfaces (PESs) were constructed first by calculating single-point energies with a face-to-face dimer model, where the non-covalent interactions are considered with the M062x functional; this functional has a good track record in investigations of main-group thermo-chemistry, kinetics, non-covalent interactions, and electronic structures.32–34 The monomer geometry obtained at the M062x/6-311+G** level was used for further PES scans of BOXD-1 dimers. The energy scans start from an ideal face-to-face π-stacked structure with an intermolecular separation of 3.33 Å (taken from crystal data),31 and then move over the displacements along both the molecular long axis (y-displacement, 0 ≤ y ≤ 11.0 Å) and the short axis (x-displacement, 0 ≤ x ≤ 2.0 Å) in steps of 0.2 Å. All the calculations for molecular dimers were done at the M062x/6-31G** level; the counterpoise procedure was utilized to correct for basis set superposition error (BSSE). The Gaussian 09 software package (version A.02) was used for all the calculations.35The energy decomposition analysis was carried out using the open-source ab initio Electronic Structure Package PSI 4.0.0-beta5 driver (SAPT0, paired with the jun-cc-pVDZ basis set).36
3 Results and discussion
3.1 Concentration-dependent photophysical properties of BOXD-6 in THF
As shown in Fig. 1a and b and reported previously, BOXD-6 shows an intense absorption band at around 320 nm and strong emission at 386 nm in dilute tetrahydrofuran (THF) solution (∼10−6 M).37 The position of the main absorption band is almost independent of the concentration (Fig. 1a); only relative absorption intensity of short wavelength (under 300 nm, Fig. S1a, ESI†) and the peak width increase (more obvious from 2 × 10⁻⁴ M, Fig. S1b, ESI†) with the increasing concentration, indicative of the formation of molecular aggregates. These molecular aggregates can be further confirmed by the photoluminescence excitation and emission spectra (more sensitive to molecular aggregates, Fig. 1b and c). It can be seen that the excitation spectrum at the lower concentration (∼10−6 M) in THF presents a main peak at 320 nm (Fig. 1c and Fig. S2, ESI†), and is consistent with the shape of the absorption spectrum (Fig. 1a). These observations strongly suggest that BOXD-6 is molecularly dissolved in THF at about 10−6 M or below. With the increase in concentration, a significant broadening of the excitation peak is observed (Fig. S2a, ESI†), indicating the formation of aggregates. Two new bands, i.e. a blue-shifted one (∼300 nm) and another red-shifted one (∼350 nm), were observed at 2 × 10⁻⁵ M (Fig. S2b, ESI†), indicative of the simultaneous formation of H- and J-aggregates. With a further increase in concentration, the two bands split more obviously due to their opposite-directional shift, and the intensity of the peak at 300 nm (H-aggregates) decreases compared to the one at 355 nm; the peak at 355 nm (J-aggregates) red-shifts gradually to 370 nm and is the only one prominent at higher concentrations (Fig. S2b, ESI†), implying that J-aggregates are the main components in concentrated solutions (∼10−3 M). It should be noted that the intensity of the band at 250 nm, which should be assigned to those transitions to the higher excited states,37 also increased when the concentrations are increasing from 1 × 10⁻⁶ to 1 × 10⁻⁴ M, but decrease on further concentration increase (Fig. 1c and Fig. S2b, ESI†), indicating that the intensity change should be related with the formation of H-aggregates. However, a detailed mechanism is still beyond our understanding. The emission spectra of BOXD-6 show obvious changes in the peak shape rather than in band shifts (Fig. 1b and Fig. S3, ESI†): upon increasing concentration, the intensity of the higher energy vibrational band decreases gradually, this might be attributed to the re-absorption of molecular aggregates. These molecular aggregates can be observed using a fluorescence microscope with the mean size of ∼4 μm and ∼6 μm from 1 × 10⁻⁴ and 1 × 10⁻³ M THF solutions, respectively (Fig. S4, ESI†). These observations indicated that photoluminescence emission and excitation, especially excitation spectra, are more sensitive to molecular aggregates than UV-vis absorption spectra. Only peak broadening was observed in absorption spectra might be due to the simultaneous formation of H- and J-aggregates, and the nature that absorption spectra are less sensitive to molecular aggregates.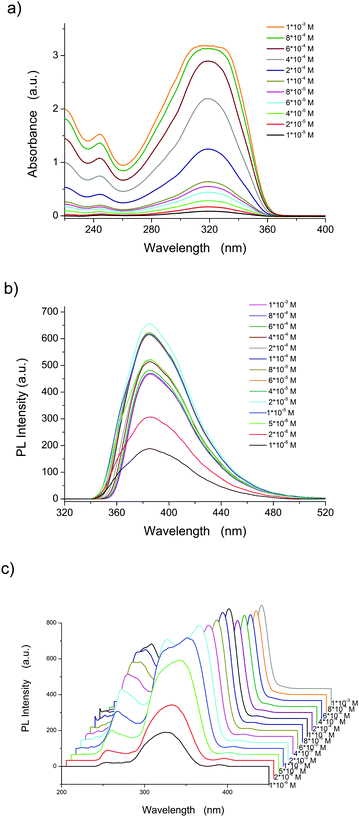 | ||
| Fig. 1 UV-vis absorption (a), photoluminescence (PL) emission (b), and excitation (c, λem = 386 nm) spectra of BOXD-6 in tetrahydrofuran at different concentrations. | ||
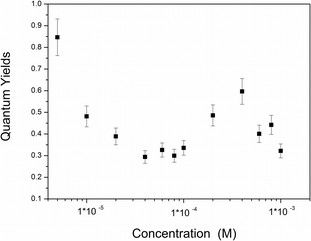
The interesting trends in quantum yields with increasing concentration (Fig. 2) can be explained by the observed phase transitions of molecular aggregation in solution. The initial decrease in quantum yield (from 1 × 10⁻⁵ to 6 × 10⁻⁵ M) can be attributed to concentration-quenching via the formation of H-aggregates; consequent increase (from 8 × 10⁻⁵ to 4 × 10⁻⁴ M) is probably caused by the increasing population of J-aggregates due to the transition from H-aggregation to J-aggregation; and the final decrease (from 4 × 10⁻⁴ to 1 × 10⁻³ M) might be due to serious re-absorption of these molecular aggregates observed in the thick solution. H-aggregates are generally non-emissive; however, in this case, excitations at both 300 (H-aggregates) and 355 nm (J-aggregates) could lead to emission at 386 nm, which might suggest that energy transfer from H-aggregates to J-aggregates is involved, however, unfortunately, there is no further evidence.
3.2 Crystal structures of BOXD-6
Single crystals of BOXD-6 suitable for X-ray analysis were grown by slow evaporation from dilute acetonitrile (ACN), chloroform (CHL), tetrahydrofuran (THF), or ethanol (ETO) solutions (∼10−4 M). Two polymorphs of BOXD-6 crystals were obtained; one polymorph (referred to as α, see below) was grown under various conditions (in different solvents), while the other one (β) was sometimes found to grow from ETO. Table 1 shows the crystallographic data of BOXD-6 from X-ray structural analysis. The ORTEP representations of the molecular structures are displayed in Fig. 3.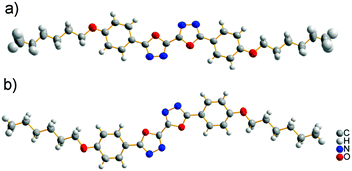 | ||
| Fig. 3 The molecular structures of BOXD-6 with displacement ellipsoids drawn at the 50% probability level: (a) from α polymorph, linear shape and (b) from β polymorph, Z-shape. | ||
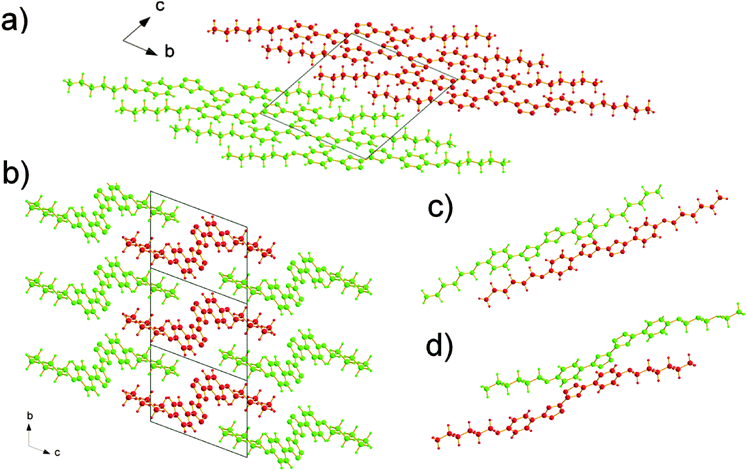
The molecules adopt different conformations and have very different packing structures in the two polymorphs (Fig. 3 and 4). In α polymorph, BOXD-6 adopts a linear conformation (Fig. 3a) and crystallizes in the triclinic space group P![[1 with combining macron]](https://www.rsc.org/images/entities/char_0031_0304.gif) . Such linear molecules stack up along the crystal a axis and form molecular layers parallel to the ab plane (Fig. 4a). To geometrically analyze the extent of π-stacking of neighboring molecules (dimers), the long molecular axis is defined as the line through the ether O atom and the molecular center, the short molecular axis is in the molecular plane and perpendicular to it. The nearest neighbors of BOXD-6 are separated by about 3.58 Å in the stacking direction, and are anti-parallel to each other along the long molecular axis with a rotation of 21.4° (Fig. 4c). Neglecting this rotation, adjacent molecules slip from a ‘co-facial’ π-stacking by 6.46 Å along the long molecular axis direction (D1) and 1.08 Å in the short molecular axis direction (D2).
. Such linear molecules stack up along the crystal a axis and form molecular layers parallel to the ab plane (Fig. 4a). To geometrically analyze the extent of π-stacking of neighboring molecules (dimers), the long molecular axis is defined as the line through the ether O atom and the molecular center, the short molecular axis is in the molecular plane and perpendicular to it. The nearest neighbors of BOXD-6 are separated by about 3.58 Å in the stacking direction, and are anti-parallel to each other along the long molecular axis with a rotation of 21.4° (Fig. 4c). Neglecting this rotation, adjacent molecules slip from a ‘co-facial’ π-stacking by 6.46 Å along the long molecular axis direction (D1) and 1.08 Å in the short molecular axis direction (D2).
The β polymorph also shows triclinic symmetry and a π-stacked structure; here, the molecules adopt a Z-shaped conformation (Fig. 3b). These Z-shaped molecules stack up along the crystal a axis and form a more ordered two-dimensional layered structure; the molecular layer parallel to the ac plane is of single molecular layer type, while the molecular layer parallel to the ab plane had the alkoxy chains intercalated, termed as the intercalated layer (Fig. 4b).38,39 The molecules in the stacking direction are arranged in a parallel fashion and separated by 3.37 Å (Fig. 4d). The molecules in the crystals of β polymorph are packed more tightly than that in α polymorph, which is confirmed by the calculated density. The density of the crystal of β polymorph is 1.251 g cm−3, which is slightly larger than that of α polymorph, 1.224 g cm−3 (Table 1). Adjacent molecules show larger displacements along the long molecular axis direction, calculated to be 7.43 Å (D1), but almost no displacement along the short molecular axis direction (D2). In comparison with that of BOXD-1,31 where D1 = 5.50 Å and D2 is small, it appears that the introduction of the long terminal alkoxy chains enlarged the intermolecular displacements and result in J-aggregation.
3.3 Fine tuning the molecular aggregation structure
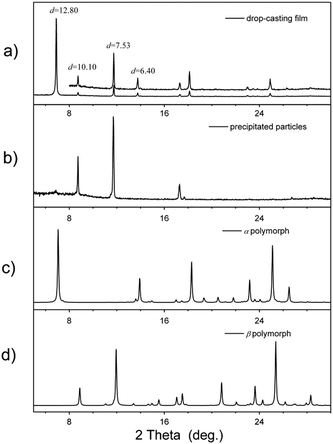
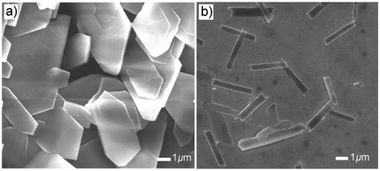
Even though the J-aggregates are almost the only component at a concentration of 10−3 M, a solid film with complex layered structures (Fig. 5a) is found when we transfer these molecular aggregates onto a substrate (silicon or glass) using a drop-casting method. The XRD pattern of this solid film shows several sharp peaks in the low-angle region with a d spacing of 12.80, 10.10, 7.53 and 6.40 Å. The diffraction peak at d = 12.80 Å and its harmonic peak at d = 6.40 Å are very similar to the diffraction peak found in the crystal of α polymorph (Fig. 5c); the other two peaks (at d = 10.10 and 7.53 Å) are similar to the diffraction pattern of crystals of β polymorph (Fig. 5d). This implies that both H- and J-aggregation modes form in the solid film, and J-aggregates can transform into H-aggregates during film formation. A question arises: how can we get only J-aggregation in the film? By examining the whole procedure of film formation, we think that several factors, for example, the interaction between the molecular aggregates and substrates or the evaporation of the solvents, can have strong influence on the film structure. So, in order to avoid these effects, we caused the J-aggregates first to precipitate from solution by adding water into the THF solution; then, these suspended precipitates in solution were transferred onto the substrates. Films with only J-aggregates are successfully obtained via this method (see the XRD curve in Fig. 5b). This observation can be further demonstrated by spectroscopic study. As shown in Fig. S5 (ESI†), increasing the water ratio can decrease the intensity of the peak at 295 nm, indicating that more J-aggregates can be stabilized by adding water into THF solution.SEM was used to observe the morphology of the films (Fig. 6). As shown in Fig. 6a, the SEM images suggest that thick plates with sharp crystal faces are formed in drop-cast films. These plates are about 100 nm in thickness and several micrometers in other two dimensions. The BOXD-6 aggregates precipitated by adding water into THF solutions assemble into relatively thinner sheets (about 10 nm, Fig. 6b), which are several micrometers in length and 0.5 μm in width; this indicates that molecules essentially assemble along one dimension.
The possible mechanism for the phase transition from J-aggregates to H-aggregates during film formation can be attributed to the ease of the formation of α polymorph (H-aggregation), as has been confirmed in single crystal growth experiments. The crystallization of α polymorph disturbed the equilibrium of the molecular conformation and aggregation, making molecules in J-aggregates re-dissolved into solvents, change their conformation, and re-crystallize as H-aggregates. Adding water into the solution can make J-aggregates precipitate out and prevent the following re-dissolving process.
3.4 Potential energy surface (PES)
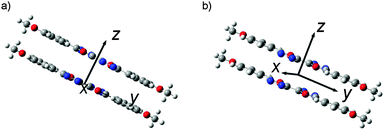
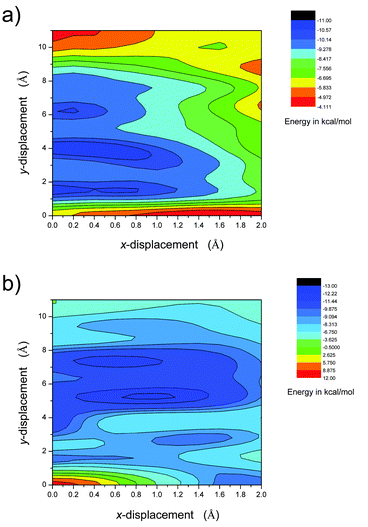
In order to get further information on molecular aggregation, the intermolecular interaction potential energy surfaces (PESs) were evaluated by calculating the single-point energies using a dimer model. As shown in Fig. 7, the dimer structures were built up in a π-stacked face-to-face orientation with an intermolecular separation of 3.33 Å. In order to simulate the molecular packing structures in the crystals, both parallel and anti-parallel dimer models were taken into account in this study. The potential energy was computed as a function of molecular shifts along both the molecular long axis (y-displacement) and short axis (x-displacement) at the M062x level.32In both configurations, the intermolecular interaction potential energy surface points to several energy minimum states (Fig. 8 and Fig. S6, ESI†). For the anti-parallel stacking mode, the global minimum is found at x = 0.4 Å, y = 4.0 Å (denoted as MAP1(0.4, 4.0), and the subscript AP indicates anti-parallel packing). The binding energy is calculated to be Ebin = −10.98 kcal mol−1. Besides, two local energy minimum points, MAP2(0, 1.6) and MAP3(0.2, 6.2), are also predicted. The energy difference for these energy minima is under 0.5 kcal mol−1. For the parallel stacking mode, the global minimum is found at x = 1.0 Å, y = 5.2 Å (denoted as MP1(1.0, 5.2), and the subscript P indicates parallel packing). The binding energy is calculated to be Ebin = −12.37 kcal mol−1. Besides, several local energy minimum points, MP2(0.6, 7.4), MP3(1.4, 2.8) and MP4(0, 1.4), are also obtained. The energy difference among these energy minima is smaller than 3 kcal mol−1. The molecular packing structures corresponding to MAP3(0.2, 6.2), MP1(1.0, 5.2) and MP2(0.6, 7.4) are very similar to that found in the crystals. If we use the same definition of the molecular long axis and short axis as in the crystal structure, the displacement (D1 and D2) of the neighboring molecules in these theoretical predicted structures are very close to that found in corresponding crystal structures (Table 2). The difference in D1 is less than 0.3 Å; a relatively larger deviation could be found for D2 (less than 0.6 Å), which might be due to the small energy differences involved in x displacements.
| No. | Stacking structure | D 1 (Å) | D 2 (Å) |
|---|---|---|---|
| a The values for D2 in BOXD-1 and BOXD-6-β crystal are negligible. | |||
| 1 | MAP3(0.2, 6.2) | 6.18 | 0.45 |
| BOXD-6-α | 6.46 | 1.08 | |
| 2 | MP1(1.0, 5.2) | 5.27 | 0.44 |
| BOXD-1 | 5.50 | 0 | |
| 3 | MP2(0.6, 7.4) | 7.42 | 0.11 |
| BOXD-6-β | 7.43 | 0 | |
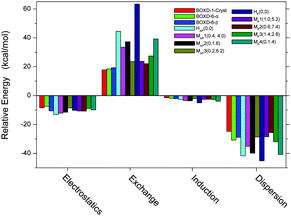
In addition, to get better insight into the origins of the binding in terms of the various fundamental intermolecular forces, we carried out a Symmetry Adapted Perturbation Theory (SAPT) analysis on these energy-minimum molecular stacking structures, as well as the crystal packing and the ideal face-to-face stacking (referred to as H(0,0)) structures. As shown in Fig. 9, London dispersion forces are the strongest attractive components in the binding (∼−25 to −45 kcal mol−1). The electrostatic stabilization (∼−8 to −13 kcal mol−1) is about 1/3–1/2 of the dispersion term. Induction, at about −1.5 to −5 kcal mol−1, provides the remaining stabilization. The dominance of dispersion is consistent with the results of many other π-stacked systems.34,40,41 Compared to electrostatics and induction interactions, exchange and dispersion interactions are more sensitive to the molecular packing structures. The most favorable dispersion energy is for ideal face-to-face configurations (HAP(0,0) and HP(0,0)); this is consistent with the fact that in these configurations, the two molecules are showing the closest contact. However, the greatest exchange repulsive forces are, as expected, also observed in these configurations, especially in the parallel mode (63.35 kcal mol−1). This is the reason why such face-to-face configurations are not favored. Other configurations with moderate dispersion and exchange terms are more favored (∼−16 kcal mol−1). The interaction energy obtained in SAPT analysis is slightly larger than that from the M062x/6-31G** method (Fig. S7, ESI†), due to the difference in the methodologies. However, two methods show very similar trends for these structural changes, which confirm their reliability. Analysis of those crystal packings indicates that the two types of molecular packings found in different crystalline structures of BOXD-6 have similar intermolecular interaction energies (∼−22 kcal mol−1). Although BOXD-6 shows a larger offset in crystalline packing than BOXD-1, the dispersion term for BOXD-6 is somewhat larger than that of BOXD-1; thus, the introduction of the long terminal alkoxy chains results in an increase in dispersive attraction.
4 Conclusions
BOXD-6 forms both H- and J-aggregates in THF at moderate concentration (∼10−4 M), and exclusively J-aggregates at higher concentration (∼10−3 M). The molecular self-assembled structures were determined by powder and single-crystal X-ray diffraction analysis. In H-aggregation (α polymorph), BOXD-6 adopts a linear conformation and forms a one-dimensional layered structure; in J-aggregation (β polymorph), the molecules adopt a Z-shaped conformation and form a more ordered two-dimensional layered structure. BOXD-6 exhibits a π-stacking structure in either H or J-aggregation. Compared to that of H-aggregation, the displacement along the molecular long-axis direction in J-aggregation is larger. Moreover, an effective method was developed to control the molecular self-assembled structures deposited on substrates. Films with pure J-aggregates of BOXD-6 were successfully obtained by adding water as a precipitator into THF solution. The calculated intermolecular interaction potential energy surfaces (the M062x/6-31G** method) are fully consistent with the molecular stacking structures. London dispersion forces are found to play an important role in stabilizing the molecular aggregation. Several additional stable structures are also predicted by these PESs, which will be the target of future experiments.Acknowledgements
Author H.W. would like to thank Dr Jian Wang (Jilin University) for technical assistance. This work was supported by the National Science Foundation of China (51103057, 51073071, 21173096, 61274126, and 21003057), the Postdoctoral Science Foundation of China (2012T50294) and King Abdullah University of Science and Technology.Notes and references
- C. W. Tang and S. A. VanSlyke, Appl. Phys. Lett., 1987, 51, 913 CrossRef CAS PubMed.
- G. Malliaras and R. Friend, Phys. Today, 2005, 58, 53 CrossRef CAS PubMed.
- F. So, J. Kido and P. Burrows, MRS Bull., 2008, 33, 663–669 CrossRef CAS.
- J. Shinar and R. Shinar, J. Phys. D: Appl. Phys., 2008, 41, 133001 CrossRef.
- N. Thejokalyani and S. J. Dhoble, Renewable Sustainable Energy Rev., 2014, 32, 448–467 CrossRef CAS PubMed.
- L. Yao, B. Yang and Y. G. Ma, Sci. China: Chem., 2014, 57, 335–345 CrossRef CAS.
- H. Sasabe and J. Kido, Chem. Mater., 2011, 23, 621–630 CrossRef CAS.
- A. Facchetti, Mater. Today, 2007, 10, 28–37 CrossRef CAS.
- C. L. Wang, H. L. Dong, W. P. Hu, Y. Q. Liu and D. B. Zhu, Chem. Rev., 2012, 112, 2208–2267 CrossRef CAS PubMed.
- H. Usta, A. Facchetti and T. J. Marks, Acc. Chem. Res., 2011, 44, 501–510 CrossRef CAS PubMed.
- L. Torsi, M. Magliulo, K. Manoli and G. Palazzo, Chem. Soc. Rev., 2013, 42, 8612–8628 RSC.
- J. G. Mei, Y. Diao, A. L. Appleton, L. Fang and Z. N. Bao, J. Am. Chem. Soc., 2013, 135, 6724–6746 CrossRef CAS PubMed.
- J. B. You, L. T. Dou, K. Yoshimura, T. Kato, K. Ohya, T. Moriarty, K. Emery, C. C. Chen, J. Gao, G. Li and Y. Yang, Nat. Commun., 2013, 4, 1446 CrossRef PubMed.
- Y. M. Sun, G. C. Welch, W. L. Leong, C. J. Takacs, G. C. Bazan and A. J. Heeger, Nat. Mater., 2012, 11, 44–48 CrossRef CAS PubMed.
- A. Mishra and P. Bauerle, Angew. Chem., Int. Ed., 2012, 51, 2020–2067 CrossRef CAS PubMed.
- Y. Z. Lin, Y. F. Li and X. W. Zhan, Chem. Soc. Rev., 2012, 41, 4245–4272 RSC.
- A. W. Hains, Z. Q. Liang, M. A. Woodhouse and B. A. Gregg, Chem. Rev., 2010, 110, 6689–6735 CrossRef CAS PubMed.
- T. M. Clarke and J. R. Durrant, Chem. Rev., 2010, 110, 6736–6767 CrossRef CAS PubMed.
- J. Cornil, D. Beljonne, J. P. Calbert and J. L. Bredas, Adv. Mater., 2001, 13, 1053–1067 CrossRef CAS.
- P. M. Beaujuge and J. M. Frechet, J. Am. Chem. Soc., 2011, 133, 20009–20029 CrossRef CAS PubMed.
- Z. B. Henson, K. Mullen and G. C. Bazan, Nat. Chem., 2012, 4, 699–704 CrossRef CAS PubMed.
- M. Mas-Torrent and C. Rovira, Chem. Rev., 2011, 111, 4833–4856 CrossRef CAS PubMed.
- F. Wurthner and R. Schmidt, ChemPhysChem, 2006, 7, 793–797 CrossRef PubMed.
- J. C. Sumrak, A. N. Sokolov and L. R. Macgillivray, Crystal Engineering Organic Semiconductors, in Self-Organized Organic Semiconductors: From Materials to Device Applications, John Wiley & Sons Inc., 2011 Search PubMed.
- J. E. Anthony, Chem. Rev., 2006, 106, 5028–5048 CrossRef CAS PubMed.
- Y. N. Hong, J. W. Y. Lam and B. Z. Tang, Chem. Commun., 2009, 4332–4353 RSC.
- S. Varghese and S. Das, J. Phys. Chem. Lett., 2011, 2, 863–873 CrossRef CAS PubMed.
- Z. Q. Xie, B. Yang, F. Li, G. Cheng, L. L. Liu, G. D. Yang, H. Xu, L. Ye, M. Hanif, S. Y. Liu, D. G. Ma and Y. G. Ma, J. Am. Chem. Soc., 2005, 127, 14152–14153 CrossRef CAS PubMed.
- N. S. S. Kumar, S. Varghese, C. H. Suresh, N. P. Rath and S. Das, J. Phys. Chem. C, 2009, 113, 11927–11935 CAS.
- R. Thomas, S. Varghese and G. U. Kulkarni, J. Mater. Chem., 2009, 19, 4401–4406 RSC.
- S. Qu, X. Chen, X. Shao, F. Li, H. Zhang, H. Wang, P. Zhang, Z. Yu, K. Wu, Y. Wang and M. Li, J. Mater. Chem., 2008, 18, 3954–3964 RSC.
- Y. Zhao and D. G. Truhlar, Theor. Chem. Acc., 2008, 120, 215–241 CrossRef CAS.
- H. Wang, F.-Q. Bai, H. Liu, B. Bai, X. Ran, S. Qu, J. Shi, D. Xie, H.-Y. Li, M. Li and H.-X. Zhang, Phys. Chem. Chem. Phys., 2011, 13, 9697–9705 RSC.
- H. Wang, F. Bai, X. Jia, D. Cao, R. Kumar, J. Bredas, S. Qu, B. Bai, H. Zhang and M. Li, RSC Adv., 2014, 4, 51942–51949 RSC.
- M. J. Frisch, G. W. Trucks, H. B. Schlegel, G. E. Scuseria, M. A. Robb, J. R. Cheeseman, G. Scalmani, V. Barone, B. Mennucci, G. A. Petersson, H. Nakatsuji, M. Caricato, X. Li, H. P. Hratchian, A. F. Izmaylov, J. Bloino, G. Zheng, J. L. Sonnenberg, M. Hada, M. Ehara, K. Toyota, R. Fukuda, J. Hasegawa, M. Ishida, T. Nakajima, Y. Honda, O. Kitao, H. Nakai, T. Vreven, J. A. Montgomery Jr, J. E. Peralta, F. Ogliaro, M. Bearpark, J. J. Heyd, E. Brothers, K. N. Kudin, V. N. Staroverov, R. Kobayashi, J. Normand, K. Raghavachari, A. Rendell, J. C. Burant, S. S. Iyengar, J. Tomasi, M. Cossi, N. Rega, J. M. Millam, M. Klene, J. E. Knox, J. B. Cross, V. Bakken, C. Adamo, J. Jaramillo, R. Gomperts, R. E. Stratmann, O. Yazyev, A. J. Austin, R. Cammi, C. Pomelli, J. W. Ochterski, R. L. Martin, K. Morokuma, V. G. Zakrzewski, G. A. Voth, P. Salvador, J. J. Dannenberg, S. Dapprich, A. D. Daniels, Ö. Farkas, J. B. Foresman, J. V. Ortiz, J. Cioslowski and D. J. Fox, Gaussian 09, Revision A.02, Gaussian, Inc., Wallingford CT, 2009 Search PubMed.
- J. M. Turney, A. C. Simmonett, R. M. Parrish, E. G. Hohenstein, F. A. Evangelista, J. T. Fermann, B. J. Mintz, L. A. Burns, J. J. Wilke, M. L. Abrams, N. J. Russ, M. L. Leininger, C. L. Janssen, E. T. Seidl, W. D. Allen, H. F. Schaefer, R. A. King, E. F. Valeev, C. D. Sherrill and T. D. Crawford, Wiley Interdiscip. Rev.: Comput. Mol. Sci., 2012, 2, 556–565 CrossRef CAS PubMed.
- H. Wang, H. Liu, F.-Q. Bai, S. Qu, X. Jia, X. Ran, F. Chen, B. Bai, C. Zhao, Z. Liu, H.-X. Zhang and M. Li, J. Photochem. Photobiol., A, 2015, 312, 20–27 CrossRef CAS PubMed.
- C. T. Imrie and P. A. Henderson, Curr. Opin. Colloid Interface Sci., 2002, 7, 298–311 CrossRef CAS.
- C. T. Imrie and P. A. Henderson, Chem. Soc. Rev., 2007, 36(12), 2096–2124 RSC.
- M. O. Sinnokrot and C. D. Sherrill, J. Am. Chem. Soc., 2004, 126, 7690–7697 CrossRef CAS PubMed.
- C. D. Sherrill, Acc. Chem. Res., 2013, 46, 1020–1028 CrossRef CAS PubMed.
Footnote |
| † Electronic supplementary information (ESI) available: Fig. S1–S7. CCDC 1018246 and 1018247. For ESI and crystallographic data in CIF or other electronic format see DOI: 10.1039/c5tc02445e |
| This journal is © The Royal Society of Chemistry 2015 |


