 Open Access Article
Creative Commons Attribution 3.0 Unported Licence
Analysing the effect of the crystal structure on upconversion luminescence in Yb3+,Er3+-co-doped NaYF4 nanomaterials†
D. T.
Klier‡
and
M. U.
Kumke‡
*
University of Potsdam, Department of Chemistry (Physical Chemistry), Karl-Liebknecht-Str. 24-25, 14476 Potsdam, Germany. E-mail: kumke@uni-potsdam.de
First published on 25th September 2015
Abstract
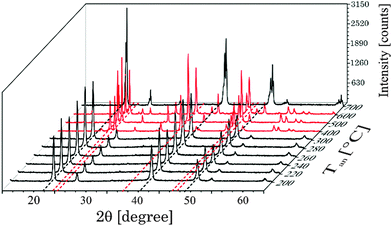
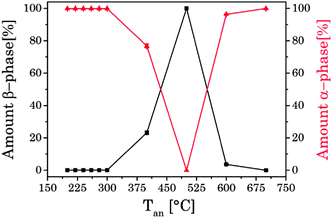
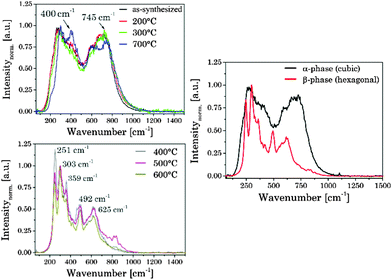
NaYF4:Yb:Er nanoparticles (UCNP) were synthesized under mild experimental conditions to obtain a pure cubic lattice. Upon annealing at different temperatures up to Tan = 700 °C phase transitions to the hexagonal phase and back to the cubic phase were induced. The UCNP materials obtained for different Tan were characterized with respect to the lattice phase using standard XRD and Raman spectroscopy as well as steady state and time resolved upconversion luminescence. The standard techniques showed that for the annealing temperature range 300 °C < Tan < 600 °C the hexagonal lattice phase was dominant. For Tan < 300 °C hardly any change in the lattice phase could be deduced, whereas for Tan > 600 °C a back transfer to the α-phase was observed. Complementarily, the luminescence upconversion properties of the annealed UCNP materials were characterized in steady state and time resolved luminescence measurements. Distinct differences in the upconversion luminescence intensity, the spectral intensity distribution and the luminescence decay kinetics were found for the cubic and hexagonal lattice phases, respectively, corroborating the results of the standard analytical techniques used. In laser power dependent measurements of the upconversion luminescence intensity it was found that the green (G1, G2) and red (R) emission of Er3+ showed different effects of Tan on the number of required photons reflecting the differences in the population routes of different energy levels involved. Furthermore, the intensity ratio of Gfull/R is highly effected by the laser power only when the β-phase is present, whereas the G1/G2 intensity ratio is only slightly effected regardless of the crystal phase. Moreover, based on different upconversion luminescence kinetics characteristics of the cubic and hexagonal phase time-resolved area normalized emission spectra (TRANES) proved to be a very sensitive tool to monitor the phase transition between cubic and hexagonal phases. Based on the TRANES analysis it was possible to resolve the lattice phase transition in more detail for 200 °C < Tan < 300 °C, which was not possible with the standard techniques.
1. Introduction
Nanomaterials labeled with fluorescent dyes have been widely used in life-science applications and biological studies.1–6 Typically, these labeling compounds are organic dyes, such as Alexa Fluor, fluorescein isothiocyanate (FITC), cyanine dyes (Cy3, Cy5 or Cy7) and rhodamin derivates.7–9 Recently, semiconductor quantum dots have emerged as great potential candidates for life-science applications.10–16 These conventional down conversion luminescence probes require light in the ultra violet or visible spectral range for excitation. Their main disadvantages are the background-related auto-fluorescence of biological samples due to the UV/VIS excitation wavelengths typically used, photobleaching of the probes, low light penetration depth in tissues like skin and possible damages to the biological matrix under investigation.1,7,17Upconversion (UC) luminescent materials have attracted great interest in recent years due to their outstanding photophysical properties and the resulting application potentials in various fields such as solid-state lasers, solar cells, color displays or life sciences.18–27 Upconversion materials based on lanthanide-doped fluorides received a lot of attention owing to their high UC efficiency and photostability. Highly efficient UC materials among various fluoride based UC phosphors are β-phase NaYF4 doped with Yb3+ and Er3+ or Yb3+ and Tm3+ as a sensitizer–activator pair, respectively.28–33 The luminescence properties of upconversion nanoparticles (UCNP) are dependent on a complex interplay between different dopant ions on the one hand and the host lattice on the other hand.8,9,34 Thus, the luminescence of these particles can be tuned by the crystal structure of the host lattice, the particle size, the ratio of different lanthanides used as dopants, and the power density of the excitation light.35 For example, for NaYF4 the host lattice geometry can be switched by annealing between the cubic (α) and the hexagonal (β) phases subsequently also tuning the UC properties of the materials.20,36–39
In the present study, the UCNPs were synthesized under mild reaction conditions (Tsynthesis = 160 °C) in order to obtain a pure cubic (α) phase host lattice. Subsequently, in order to investigate the influence of the crystal phase on the upconversion luminescence properties different annealing temperatures (Tan) were applied to induce a phase transition in the material. The alterations in the photophysical properties of the UCNP materials obtained for different Tan were monitored using steady state and time-resolved luminescence techniques. Time-resolved area normalized emission spectra (TRANES) can often be a useful method to illustrate the overall dynamics, especially to identify at least two emissive states.40–45 Based on the luminescence data the interplay of the population routes of sensitizer and activator electronic states involved in different luminescence upconversion processes was analyzed in order to increase the understanding of the UCNP photophysics. The detailed knowledge of it at a molecular level provides the basis for UCNP material synthesis tailored for the specific needs of applications they are going to be used such as multiplexing applications like temperature sensing or in vivo imaging. The upconversion luminescence data are complemented by Raman, SEM and XRD measurements to determine the size and the crystal phase of the UCNP investigated and to underline the power of luminescence techniques in the structural characterization of such materials.
2. Experimental
2.1 Materials
All rare earth oxides RE2O3 (RE: Y, Yb and Er) were purchased from Chem Pur Feinchemikalien and Forschungsbedarf GmbH. Sodium fluoride (NH4F, 99%) was purchased from Sigma Aldrich. Nitric acid solution (HNO3, 65%), sodium chloride, polyvinylpyrrolidone (PVP 40) and ethanol (99.5%) were purchased from Carl Roth. In the experiments double distilled water was used. In the synthesis all chemical reagents were used as received.2.2 Synthesis of NaYF4:Yb3+:Er3+ UCNPs
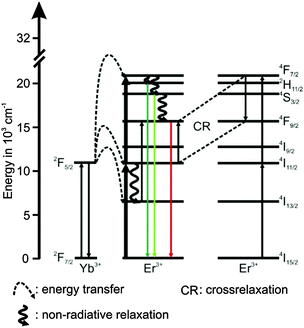
The UCNPs were synthesized according to a previously reported procedure in which a well-known hydrothermal method with PVP 40 as a capping agent was applied.1,29,46 The rare earth nitrates (RE(NO3)3) were prepared from the corresponding oxides in stoichiometric amounts of Y2O3 (3.9 mmol), Yb2O3 (1.0 mmol) and Er2O3 (0.1 mmol) dissolved in nitric acid (200 mL, 10%) according to the literature method.47 Typically, the obtained RE(NO3)3, was dissolved in 200 mL ethylene glycol and was treated with a mixture of NaCl (20 mmol) and 8.9 g PVP 40 (solution A). NH4F (80 mmol) was dissolved in 200 mL ethylene glycol and heated to 80 °C in a second reaction vessel until a clear solution was obtained (solution B). Subsequently, solution A was heated to 80 °C and solution B was released into the hot solution within a few seconds. The combined solutions were heated to 160 °C. After 2 h the solution was cooled down to room temperature (RT) and the product was separated via centrifugation (4000 rpm for 20 min). The particles were further purified alternately with water and absolute ethanol. Finally, the precipitate was dried at 85 °C for 5 h and a white powder was obtained. Taking into account the amount of volatile organic material present in the material (approximately 11% mass loss according to thermo gravimetric studies) a yield of 75–90% was calculated. The composition of the UCNP is shown in Table 1. The chosen Er3+ concentration was small in order to eliminate possible cross relaxation between two excited Er3+ ions (see Scheme 1). To calculate the yields of the synthesis for different as-synthesized UCNPs a thermo-balance (L81 and STA PT-1600 Fa. Linseis) with simultaneously different thermal analysis (TG/DTA) was used.| Parameter | UCNPAS |
|---|---|
Yb3+![[thin space (1/6-em)]](https://www.rsc.org/images/entities/char_2009.gif) : :![[thin space (1/6-em)]](https://www.rsc.org/images/entities/char_2009.gif) Er3+ Er3+ |
10![[thin space (1/6-em)]](https://www.rsc.org/images/entities/char_2009.gif) : :![[thin space (1/6-em)]](https://www.rsc.org/images/entities/char_2009.gif) 1 1 |
| Mean diameter (SEM)/nm | 41 ± 4 |
| Mean diameter of nanocrystaline domain size (XRD)/nm | 31 ± 7 |
| T an/°C | 200–700 (for 5 h) |
| Steps of annealing/°C | ΔT = 20 (for 200–300 °C) |
| ΔT = 100 (for 300–700 °C) |
2.3 Annealing procedures
The as-synthesized UCNPAS were subjected to annealing at different temperatures Tan in a range of 200 °C < Tan < 700 °C for 5 h using a muffle furnace (LM 212.11, VEB Elektro) to induce phase transitions in the NaYF4 host lattice (see Table 1). The UCNP materials are denoted as UCNPx with x = AS for as-synthesized and x = Tan (Tan = 200–700 °C).2.4 Structural characterization
The size and morphology of the as-synthesized UCNP were obtained using a SEM S-4800 scanning electron microscope (Hitachi High-Technologies Canada, Inc., Toronto, Canada) operated with a cold field emission gun (FEG) as a cathode and an accelerating voltage of 2 kV. The samples were sputtered with platinum in order to reduce the tendency of electrostatic charging.X-ray powder diffraction (XRD) patterns were collected using a D5005 instrument (Siemens AG, Munich, Germany) in a range of 3–70°/2θ with divergence aperture, scattering ray aperture and graphite monochromatized Cu Kα radiation (λ = 0.15406 nm). The scanning step was 0.02°/2θ with a counting time of 4 s per step. From the XRD spectra the nanocrystalline domain sizes were calculated using the Debye–Scherrer equation (see eqn (1)):
 | (1) |
Raman measurements were carried out using a confocal Raman microscope 300α (WITec Wissenschaftliche Instrumente und Technologie GmbH, Ulm, Germany) equipped with an upright optical microscope. For Raman excitation, laser light at λ = 532 nm was used, which was coupled into a single-mode optical fiber and focused through a 100× objective (Olympus MPlanFL N, NA = 0.9) to a diffraction-limited spot of about 1.3 μm2. The laser power was set between 0.4 and 1 mW and the integration time was 5 s for all samples under investigation. For the detection the UHTS 300 spectrograph (WITec, Wissenschaftliche Instrumente und Technologie GmbH, Ulm, Germany) was equipped with a grating (600 lines per mm) and a cooled CCD camera (DU40LA-BR-DD-532, WITec, Wissenschaftliche Instrumente und Technologie GmbH, Ulm, Germany).
2.5 Luminescence characterization
 | (2) |
I(t) = A + B1![[thin space (1/6-em)]](https://www.rsc.org/images/entities/char_2009.gif) exp(−k1t) + B2 exp(−k1t) + B2![[thin space (1/6-em)]](https://www.rsc.org/images/entities/char_2009.gif) exp(−k2t) exp(−k2t) | (3) |
 | (4) |
| t(n) = tI + tn(n) = tI + (n − 1)·tk | (5) |
| m(λ) = Cα(λ) + Dβ(λ) | (6) |
3. Results and discussion
3.1 As-synthesized (cubic) UCNPAS
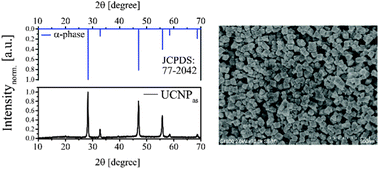
The XRD diffractogram of UCNPAS with the corresponding Millerschen indices48 of the lattice planes is shown in Fig. 1 (left). A comparison of the XRD diffractogram with the database of the International center of diffraction data (ICCD, No. 77-2042) showed that UCNPAS is composed of the cubic α-phase found for NaYF4. The very sharp reflexes of different lattice planes seen in the diffractograms indicate that even though the synthesis was carried out under mild conditions a defined crystal lattice was formed.
The particle size and morphology of UCNPAS were further studied using SEM. The SEM image of UCNPAS shows a cubic shape (Fig. 1, right).50–53 In order to determine an average particle size from SEM images approximately 500 particles were evaluated. The results of the statistical analysis of the SEM images are shown in Table 1. In addition, the particle size was calculated using the Debye–Scherrer equation. Here, the XRD data were fitted with Lorentz functions and the average particle diameter was obtained. In comparison to the SEM-based size the average diameter is determined approximately 25% smaller. Based on the Debye–Scherrer equation only the crystallite size of the particle is considered in the calculation, which accounts for the observed difference in size found by the two methods. Because of the mild synthesis conditions, the UCNPAS may not be fully crystallized and some amorphous domains may still be present in the particles.
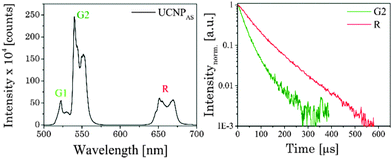
Fig. 2 (right) shows the luminescence decay kinetics (λex = 976 nm) of UCNPAS G and R, respectively. For the emission bands G2 and R a distinctly different time dependence of the luminescence was observed (see Fig. 2, right), whereas no difference between G1 and G2 was observed (see ESI,† Fig. S1). In the data analysis a bi-exponential decay law was applied.55,60,61 As a trend, the calculated luminescence decay times (τ1 and τ2) were longer for the red emission band (R) compared to the green emission bands (G1, G2) (Table 2).
| Decay time [μs] | UCNPAS | Relative fraction [%] |
|---|---|---|
| τ G2,1 | 23 ± 1 | 71 |
| τ G2,2 | 65 ± 5 | 29 |
| τ R,1 | 51 ± 1 | 64 |
| τ R,2 | 118 ± 6 | 36 |
3.2 Annealed UCNPx
The NaYF4 lattice shows a phase transition from cubic to hexagonal and as a consequence the upconversion properties of UCNPs are distinctly influenced due to structure-related parameters like lattice vibrations. To study the phase transfer from the cubic (α) to the hexagonal (β) phase in more detail the UCNPAS were annealed at different temperatures Tan.At Tan > 400 °C the nanoparticles tend to build up micro-domains (see ESI,† Fig. S2); therefore the samples are further denoted as UCNPx materials.7
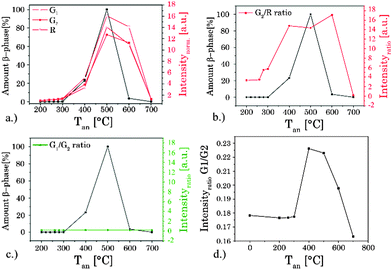
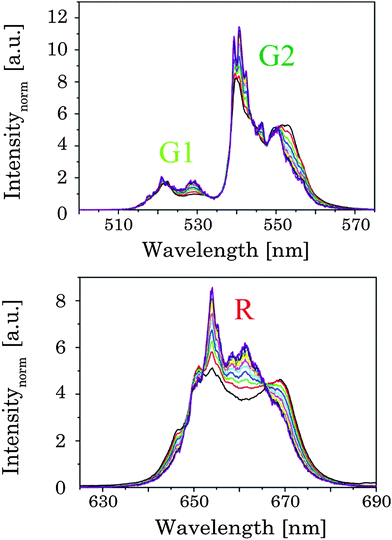
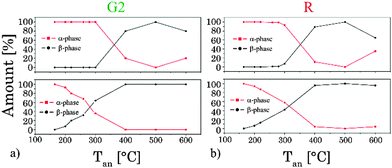
While the ratio of G1/G2 was found to be nearly independent of the annealing temperature the ratio G2/R showed a distinct change for Tan > 300 °C (see Fig. 6). The sample obtained at Tan = 700 °C showed a reversed effect, here the overall intensity as well as the spectral intensity distribution were changed back according to materials obtained for Tan < 300 °C. In Fig. 6 the overall intensity, the ratio G2/R (as well as the G1/G2 ratio), and the amount of β-phase in different samples are compared.71 The spectral changes are well correlated with the phase transition from the cubic (α) phase to the hexagonal (β) phase corroborating the results of the XRD and Raman measurements.34,41,44 In addition, for high Tan a reduction in lattice defects due to the annealing process and a subsequent decrease of radiationless deactivation improving the energy migration between Yb3+ ions within the crystal may also have a positive effect on the overall upconversion luminescence intensity.
| IUC ∼ InIR | (7) |
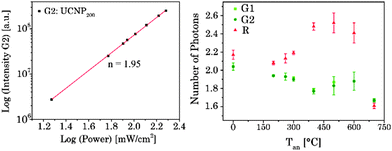
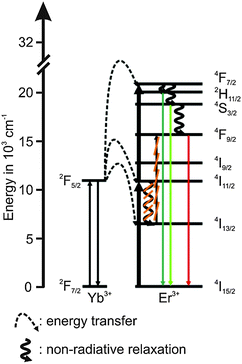
For G1 and G2 luminescence two NIR photons need to be transferred (n = 2, see Fig. 7) from two Yb3+ ions (sensitizer) to one Er3+ ion (activator).61,72,73
First, the 4I11/2 energy level and then the 4F7/2 energy level of Er3+ are populated. Followed by a non-radiative deactivation from the 4F7/2 to the 2H11/2 energy level (G1) or further to the 4S3/2 energy level (G2). Alternatively the 4S3/2 energy level can also be deactivated non-radiatively through multiphonon interaction with the host lattice to the 4F9/2 energy level yielding the emission band R (also via two energy transfer steps, n = 2). In addition, the 4F9/2 energy level can be populated via the two different three photon energy transfer process (n = 3).20,55,56,67,77
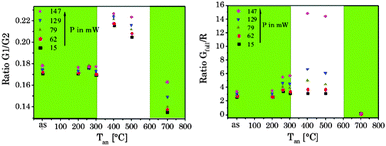
The 4S3/2 energy level of one Er3+ ion is populated by two energy transfer steps from excited Yb3+ ions whereas a second Er3+ ion is in the 4I11/2 energy level via one energy transfer step from Yb3+. Following a cross relaxation between the two excited Er3+ ions both Er3+ ions reached the 4F9/2 energy level from which the red emission (R) can occur (three photon process A). The three photon process A is only possible at high Er3+ concentration and can be neglected in our materials due to the low Er3+ concentration.57,67,78–80 In a second three photon process B the 4S3/2 energy level of the Er3+ ion is populated by two energy transfer steps from excited Yb3+ ions. Then, the 4I13/2 level of Er3+ can be populated via an energy back transfer (BET) from the 4S3/2 level of Er3+ to neighbouring Yb3+ ions.81 A subsequent energy transfer from excited Yb3+ ions to the 4I13/2 level of Er3+ leads to the population of the 4F9/2 energy level and the red emission band R.82 The n-value for G1 and G2 is slightly, but steadily decreased with increasing annealing temperature from n − 2 (UCNPAS) to n − 1.7 (for Tan = 700 °C) (see Fig. 7, right). In contrast the n-value for the R band increased from n − 2.1 (UCNPAS) to n − 2.5 (Tan = 600 °C). A distinct difference in the n-values is found for the cubic phase (UCNPAS) and the hexagonal phase (UCNP400), but already at Tan < 400 °C a slight but steady change in the n-values was observed (see Fig. 7 (right)). Opposing effects originating from the differences in phonon coupling in the cubic and hexagonal lattices as well as from the interplay between radiationless deactivation and saturation effects at higher laser power may be the reason for the observed trends in n for the G and R band(s), respectively. While for the green emission bands G1 and G2 theoretically n = 2 is expected and the observed decrease of n with increasing Tan points toward a saturation effect, for the R band the change in the matrix-related phonon coupling is the major factor responsible for the overall increase of n.61,83 To further elucidate different factors the power dependence of the spectral intensity distribution was analyzed in more detail. In Fig. 8 the ratio of the green luminescence bands G1/G2 (left) as well as the ratio of the overall green and red luminescence Gfull/R (right) are shown for different laser power (λex = 976 nm). For the G1/G2 ratio almost no influence of the laser power is found for the UCNPx annealed at Tan < 300 °C. For Tan > 300 °C a slight jump in the G1/G2 ratio was found but no significant influence of the laser power. The observed “jump” falls well within the range of Tan for which the hexagonal phase is dominant.72,74 At Tan = 700 °C a decrease and a slight power dependence were observed for the G1/G2 ratio. It is known that G1 is mainly populated via thermal excitation from the 4S3/2 level (G2). The energy gap between the 4S3/2 – and 2H11/2 level is decreased due to thermal treatment (associated therewith phase transfer from the α- to β-phase) and leads to a more efficient thermal population of the 2H11/2 level, subsequently increasing the G1/G2 ratio (see Fig. 8, left). In contrast, for the Gfull/R ratio a distinct laser power dependence was found. Especially in the range of 300 °C < Tan ≤ 600 °C representative for the hexagonal phase a large increase by a factor of about 7 was measured (see Fig. 8, right). As for the G1/G2 ratio at Tan = 700 °C the Gfull/R ratio dropped back (even below) to the value found for Tan < 300 °C and the laser power influence disappeared. The energy mismatch of the 2F5/2 level of Yb3+ and the 4I11/2 level of Er3+ is smaller in the hexagonal phase than in the cubic phase and a better phonon matched energy transfer process between Yb3+- and Er3+-ions is possible which accounts for the observed lattice phase influence (especially for the G1/G2 ratio). The possibility of saturation effects (e.g., BET, cross relaxation) might also be increased due to the improved phonon matching. In the case of the Gfull/R ratio the alteration of the R is the dominant factor. In the case of a high concentration of excited Yb3+ ions (sensitizers) the activation into the 4F7/2 state becomes faster and can successfully compete with the radiationless deactivation from the 4I11/2 into the 4I13/2 state, which is a necessary prior step to the activation into the 4F9/2 state. From the 4F9/2 state R emission occurs subsequently (see Scheme 2).
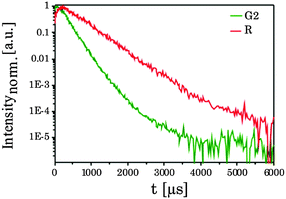 | ||
| Fig. 9 Normalized upconversion luminescence decays of the G2 and R bands of Er3+ in UCNP300 (λex = 976 nm). | ||
For R an initial rise in the luminescence intensity is observed (for t < 500 μs, see Fig. 9). The complexity of the observed decay kinetics could be a result of the contributions from Er3+ ions located in different chemical environments (e.g., surface vs. volume effects, amorphous domains, which are reduced due to annealing). The experimental data of G1, G2 and R were analyzed by a bi-exponential decay kinetics.
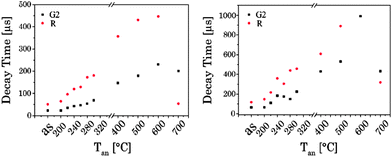
Luminescence decay times τ1 and τ2 were calculated for different bands G1, G2 and R of the UCNPx materials. An increase in both luminescence decay times with increasing Tan was observed. Moreover, at Tan > 300 °C for both luminescence decay times an accelerated increase with increasing Tan was calculated (see Fig. 10). This trend in the decay time is accompanied by the crystal phase transfer from cubic to hexagonal (vide supra). The drop observed for τ1 and τ2 at Tan = 700 °C (here, the material switched back to a cubic phase) supports the correlation of the luminescence decay kinetics and the lattice phase. The results of the luminescence kinetics measurements are in very good agreement with the other spectroscopic data presented for the G1/G2 and Gfull/R ratios.
4. Conclusion
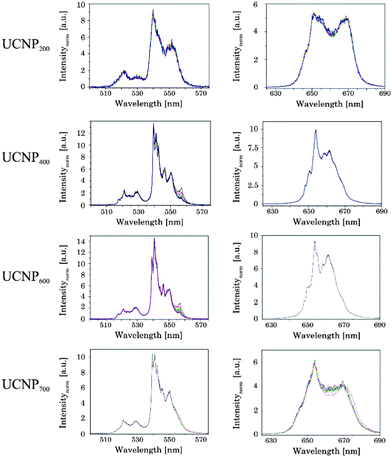
NaYF4 nanoparticles co-doped with Er3+ and Yb3+ were synthesized under mild conditions using PVP 40 as a capping agent and as a stabilizer, respectively. The UCNPAS were uniform in size and shape with a cubic crystal lattice. After annealing between 200 °C < Tan < 700 °C for 5 h changes in the crystal lattice phase and subsequently in the upconversion luminescence properties of the UCNP materials were induced. The lattice phase and the structure of the UCNP materials obtained at different Tan were analyzed using XRD, Raman spectroscopy as well as SEM. The upconversion luminescence properties of the annealed UCNP materials were studied by steady state and time resolved luminescence. Upconversion luminescence proved to be a sensitive tool to monitor the phase transition of the host lattice. While based on XRD and Raman spectroscopy no clear indication for a change in the lattice phase was found for Tan < 300 °C, the upconversion luminescence proved to be more sensitively capable of resolving even small contributions of cubic and hexagonal phases, respectively, in the materials. Based on the upconversion fluorescence studies of the UCNPx materials the complex interplay of the host lattice crystal phases and the population routes of the Er3+ energy levels involved in the upconversion processes was evaluated. The laser power dependence of the green (G1, G2) and red (R) luminescence was found to be dependent on the annealing temperature. In addition, green and red luminescence was found to respond differently in the host lattice phase. A major population route of the R luminescence is attenuated at higher laser power, which is more efficient for the hexagonal lattice phase; the relative contributions expressed as the ratio between Gfull and R are altered (see Scheme 2). Although already regular upconversion data, like spectral intensity distribution from steady state luminescence measurements or luminescence decay kinetics, show a clear lattice phase dependent behavior, TRANES analysis proved to be superior. The basis for the full exploitation of the power of TRANES is the different luminescence decay kinetics of the upconversion in cubic and hexagonal lattice phases. Because the analysis of the luminescence kinetics with respect to physical meaningful luminescence decay times is difficult due to the complex time dependence and the related challenges in the data analysis, TRANES employ a model-free combination of time and spectral information. Based on TRANES even minor amounts of cubic or hexagonal phase could be identified in different UCNP materials. TRANES could also be a great tool for monitoring the phase composition of UCNP in situ during synthesis.84,85Acknowledgements
We are thankful to Dr C. Günter and Dr C. Prietzel (work group of Prof. J. Kötz) for XRD and SEM measurements of the samples, respectively.References
- Z. Li and Y. Zhang, Angew. Chem., Int. Ed., 2006, 45, 7732–7735 CrossRef CAS PubMed.
- J. Yin, Y. Hu and J. Yoon, Chem. Soc. Rev., 2015, 44, 4619–4644 RSC.
- N. Kaur, W. Hyland and J. F. Callan, Chem. Soc. Rev., 2015, 44, 4415–4432 RSC.
- T. D. Ashton, K. a. Jolliffe and F. M. Pfeffer, Chem. Soc. Rev., 2015, 44, 4547–4595 RSC.
- Y. Tang, D. Lee, J. Wang, G. Li, J. Yu, W. Lin and J. Yoon, Chem. Soc. Rev., 2015, 44, 5003–5015 RSC.
- L. Niu, Y. Chen, H. Zheng, L. Wu, C. Tung and Y. Chen, Chem. Soc. Rev., 2015, 44, 6143–6160 RSC.
- G. Yi, H. Lu, S. Zhao, Y. Ge and W. Yang, Nano Lett., 2004, 4, 2191–2196 CrossRef CAS.
- J. Shan, W. Kong, R. Wei, N. Yao and Y. Ju, J. Appl. Phys., 2010, 107, 054901 CrossRef PubMed.
- K. Wu, J. Cui, X. Kong and Y. Wang, J. Appl. Phys., 2011, 110, 053510 CrossRef PubMed.
- J. Shen, Y. Zhu, X. Yang and C. Li, Chem. Commun., 2012, 48, 3686 RSC.
- S. Zhu, J. Zhang, C. Qiao, S. Tang, Y. Li, W. Yuan, B. Li, L. Tian, F. Liu, R. Hu, H. Gao, H. Wei, H. Zhang, H. Sun and B. Yang, Chem. Commun., 2011, 47, 6858–6860 RSC.
- M. Montalti, A. Cantelli and G. Battistelli, Chem. Soc. Rev., 2015, 44, 4853–4921 RSC.
- S. Silvi and A. Credi, Chem. Soc. Rev., 2015, 44, 4275–4289 RSC.
- K. D. Wegner, N. Hildebrandt and N. Hildebrandt, Chem. Soc. Rev., 2015, 44, 4792–4834 RSC.
- O. S. Wolfbeis, Chem. Soc. Rev., 2015, 44, 4743–4768 RSC.
- H. Peng and D. T. Chiu, Chem. Soc. Rev., 2015, 44, 4699–4722 RSC.
- J. Thomas, Chem. Soc. Rev., 2015, 44, 4494–4500 RSC.
- J. Zhou, Z. Liu and F. Li, Chem. Soc. Rev., 2012, 41, 1323 RSC.
- Q. Liu, Y. Sun, T. Yang, W. Feng, C. Li and F. Li, J. Am. Chem. Soc., 2011, 133, 17122–17125 CrossRef CAS PubMed.
- F. Wang, Y. Han, C. S. Lim, Y. Lu, J. Wang, J. Xu, H. Chen, C. Zhang, M. Hong and X. Liu, Nature, 2010, 463, 1061–1065 CrossRef CAS PubMed.
- E. M. Chan, Chem. Soc. Rev., 2015, 44, 1653–1679 RSC.
- N. M. Idris, M. K. G. Jayakumar, A. Bansal and Y. Zhang, Chem. Soc. Rev., 2014, 44, 1449–1478 RSC.
- A. Sedlmeier and H. H. Gorris, Chem. Soc. Rev., 2014, 44, 1526–1560 RSC.
- M.-K. Tsang, G. Bai and J. Hao, Chem. Soc. Rev., 2015, 44, 1585–1607 RSC.
- D. Yang, P. Ma, Z. Hou, Z. Cheng, C. Li and J. Lin, Chem. Soc. Rev., 2014, 44, 1416–1448 RSC.
- W. Zheng, P. Huang, D. Tu, E. Ma, H. Zhu and X. Chen, Chem. Soc. Rev., 2014, 44, 1379–1415 RSC.
- L. Prodi, E. Rampazzo, F. Rastrelli, A. Speghini and N. Zaccheroni, Chem. Soc. Rev., 2015, 44, 4922–4952 RSC.
- H. Guo, Z. Li, H. Qian, Y. Hu and I. N. Muhammad, Nanotechnology, 2010, 21, 125602 CrossRef PubMed.
- J. Jin, Y.-J. Gu, C. W.-Y. Man, J. Cheng, Z. Xu, Y. Zhang, H. Wang, V. H.-Y. Lee, S. H. Cheng and W.-T. Wong, ACS Nano, 2011, 5, 7838–7847 CrossRef CAS PubMed.
- G. Chen, T. Y. Ohulchanskyy, R. Kumar, H. Ågren and P. N. Prasad, ACS Nano, 2010, 4, 3163–3168 CrossRef CAS PubMed.
- Q. Cheng, J. Sui and W. Cai, Nanoscale, 2012, 4, 779 RSC.
- F. Auzel, Chem. Rev., 2004, 104, 139–173 CrossRef CAS PubMed.
- F. Auzel, J. Lumin., 1990, 45, 341–345 CrossRef CAS.
- H. H. Gorris and O. S. Wolfbeis, Angew. Chem., 2013, 125, 3668–3686 CrossRef PubMed.
- F. Wang and X. Liu, Chem. Soc. Rev., 2009, 38, 976–989 RSC.
- X. Chen, D. Peng, Q. Ju and F. Wang, Chem. Soc. Rev., 2014, 44, 1318–1330 RSC.
- L. Tu, X. Liu, F. Wu and H. Zhang, Chem. Soc. Rev., 2015, 44, 1331–1345 RSC.
- G. Liu, Chem. Soc. Rev., 2014, 44, 1635–1652 RSC.
- M. He, P. Huang, C. Zhang, H. Hu, C. Bao, G. Gao, R. He and D. Cui, Adv. Funct. Mater., 2011, 21, 4470–4477 CrossRef CAS PubMed.
- K. Gavvala, R. K. Koninti, A. Sengupta and P. Hazra, Phys. Chem. Chem. Phys., 2014, 16, 14953 RSC.
- S. N. Lee, J. Park, M. Lim and T. Joo, Phys. Chem. Chem. Phys., 2014, 16, 9394 RSC.
- A. Chatterjee and D. Seth, Photochem. Photobiol. Sci., 2013, 369–383 CAS.
- T. Shanmugapriya, R. Vinayakan, K. G. Thomas and P. Ramamurthy, CrystEngComm, 2011, 13, 2340 RSC.
- B. Carlotti, E. Benassi, A. Cesaretti, C. G. Fortuna, A. Spalletti, V. Barone and F. Elisei, Phys. Chem. Chem. Phys., 2015, 17, 20981–20989 RSC.
- B. Carlotti, A. Cesaretti, C. G. Fortuna, A. Spalletti and F. Elisei, Phys. Chem. Chem. Phys., 2015, 17, 1877–1882 RSC.
- F. Meng, S. Liu, Y. Wang, C. Tao, P. Xu, W. Guo, L. Shen, X. Zhang and S. Ruan, J. Mater. Chem., 2012, 22, 22382 RSC.
- L. Wang, R. Yan, Z. Huo, L. Wang, J. Zeng, J. Bao, X. Wang, Q. Peng and Y. Li, Angew. Chem., Int. Ed., 2005, 44, 6054–6057 CrossRef CAS PubMed.
- L. Wang, X. Xue, H. Chen, D. Zhao and W. Qin, Chem. Phys. Lett., 2010, 485, 183–186 CrossRef CAS PubMed.
- H. Li and L. Y. Wang, Chin. Sci. Bull., 2013, 58, 4051–4056 CrossRef CAS.
- B. Voß, J. Nordmann, A. Uhl, R. Komban and M. Haase, Nanoscale, 2013, 5, 806–812 RSC.
- R. Komban, J. P. Klare, B. Voss, J. J. Nordmann, H.-J. Steinhoff and M. Haase, Angew. Chem., Int. Ed., 2012, 51, 6506–6510 CrossRef CAS PubMed.
- Q. Tian, K. Tao, W. Li and K. Sun, J. Phys. Chem. C, 2011, 115, 22886–22892 CAS.
- J. Shan and Y. Ju, Nanotechnology, 2009, 20, 275603 CrossRef PubMed.
- J. Shan, M. Uddi, N. Yao and Y. Ju, Adv. Funct. Mater., 2010, 20, 3530–3537 CrossRef CAS PubMed.
- J. F. Suyver, J. Grimm, K. W. Krämer and H. U. Güdel, J. Lumin., 2005, 114, 53–59 CrossRef CAS PubMed.
- H. U. G. A. Shalav, B. S. Richards and K. W. Krämer, Conf. Rec. IEEE Photovoltaic Spec. Conf., 2005, 31, 114–117 Search PubMed.
- F. Vetrone, J. C. Boyer, J. A. Capobianco, A. Speghini and M. Bettinelli, J. Phys. Chem. B, 2003, 107, 1107–1112 CrossRef CAS.
- S. V. Eliseeva and J.-C. G. Bünzli, Chem. Soc. Rev., 2010, 39, 189–227 RSC.
- J. M. F. van Dijk, J. Chem. Phys., 1983, 78, 5317 CrossRef CAS PubMed.
- J. Zhao, Z. Lu, Y. Yin, C. McRae, J. A. Piper, J. M. Dawes, D. Jin and E. M. Goldys, Nanoscale, 2013, 5, 944–952 RSC.
- W. Yu, W. Xu, H. Song and S. Zhang, Dalton Trans., 2014, 43, 6139–6147 RSC.
- R. Thoma, H. Insley and G. Hebert, Inorg. Chem., 1966, 1005, 1222–1229 CrossRef.
- R. E. Thoma, C. F. Weaver, H. A. Friedman, H. Insley, L. A. Harris and H. A. Yakel, J. Phys. Chem., 1961, 65, 1096–1099 CrossRef CAS.
- K. W. Krämer, D. Biner, G. Frei, H. U. Güdel, M. P. Hehlen and S. R. Lüthi, Chem. Mater., 2004, 16, 1244–1251 CrossRef.
- Y. Song, Q. Tian, R. Zou, Z. Chen, J. Yang and J. Hu, J. Alloys Compd., 2011, 509, 6539–6544 CrossRef CAS PubMed.
- S. Wilhelm, T. Hirsch, W. M. Patterson, E. Scheucher, T. Mayr and O. S. Wolfbeis, Theranostics, 2013, 3, 239–248 CrossRef CAS PubMed.
- J. F. F. Suyver, J. Grimm, M. K. K. van Veen, D. Biner, K. W. W. Krämer and H. U. U. Güdel, J. Lumin., 2006, 117, 1–12 CrossRef CAS PubMed.
- S. Schietinger, L. D. S. Menezes and O. Benson, Nano Lett., 2009, 9, 2477–2481 CrossRef CAS PubMed.
- S. Mishra, G. Ledoux, E. Jeanneau, S. Daniele and M.-F. Joubert, Dalton Trans., 2012, 41, 1490 RSC.
- M. Wang, G. Abbineni, A. Clevenger, C. Mao and S. Xu, Nanomed. Nanotechnol. Biol. Med., 2011, 7, 710–729 CrossRef CAS PubMed.
- Y. Chen, W. He, H. Wang, X. Hao, Y. Jiao, J. Lu and S. Yang, J. Lumin., 2012, 132, 2404–2408 CrossRef CAS PubMed.
- J. Shan, M. Uddi, R. Wei, N. Yao and Y. Ju, J. Phys. Chem. C, 2009, 114, 2452–2461 Search PubMed.
- D. Lu, S. K. Cho, S. Ahn, L. Brun, C. J. Summers and W. Park, ACS Nano, 2014, 7780–7792 CrossRef CAS PubMed.
- J. F. Suyver, A. Aebischer, S. García-Revilla, P. Gerner and H. U. Güdel, Phys. Rev. B: Condens. Matter Mater. Phys., 2005, 71, 1–9 CrossRef.
- J. D. Kingsley, Appl. Phys. Lett., 1969, 15, 115 CrossRef CAS PubMed.
- J. L. Sommerdijk, J. Lumin., 1971, 4, 441–449 CrossRef CAS.
- A. Pandey, V. K. Rai, R. Dey and K. Kumar, Mater. Chem. Phys., 2013, 139, 483–488 CrossRef CAS PubMed.
- H. W. Song, H. P. Xia, B. J. Sun, S. Z. Lu, Z. X. Liu and L. X. Yu, Chin. Phys. Lett., 2006, 23, 474–477 CrossRef CAS PubMed.
- Y. Wang, L. Tu, J. Zhao and Y. Sun, J. Phys. Chem. C, 2009, 113, 7164–7169 CAS.
- F. Liu, E. Ma, D. Chen, Y. Yu and Y. Wang, J. Phys. Chem. B, 2006, 110, 20843–20846 CrossRef CAS PubMed.
- J. Liao, L. Nie, S. Liu, B. Liu and H. Wen, J. Mater. Sci., 2014, 49, 6081–6086 CrossRef CAS.
- L. Lei, D. Chen, W. Zhu, J. Xu and Y. Wang, Chem. – Asian J., 2014, 9, 2765–2770 CrossRef CAS PubMed.
- X. Bai, H. Song, G. Pan, Y. Lei, T. Wang, X. Ren, S. Lu, B. Dong, Q. Dai and L. Fan, J. Phys. Chem. C, 2007, 111, 13611–13617 CAS.
- J. D. Suter, N. Pekas, M. T. Berry and P. S. May, J. Phys. Chem. C, 2014, 118, 13238–13247 CAS.
- S. Wilhelm, M. Kaiser, C. Würth, J. Heiland, C. Carrillo-Carrion, V. Muhr, O. S. Wolfbeis, W. J. Parak, U. Resch-Genger and T. Hirsch, Nanoscale, 2015, 7, 1403–1410 RSC.
Footnotes |
| † Electronic supplementary information (ESI) available: TEM image of UCNP400 as well as further detailed XRD diffractograms of UCNPx and crystallite size out of the Debye–Scherrer calculation are shown. See DOI: 10.1039/c5tc02218e |
| ‡ These authors equally contributed to this study. |
| This journal is © The Royal Society of Chemistry 2015 |

