 Open Access Article
Creative Commons Attribution 3.0 Unported Licence
Raman scattering studies of order parameters in liquid crystalline dimers exhibiting the nematic and twist-bend nematic phases
Zhaopeng
Zhang
a,
Vitaly P.
Panov
a,
Mamatha
Nagaraj
a,
Richard J.
Mandle
b,
John W.
Goodby
b,
Geoffrey R.
Luckhurst
c,
J. Cliff
Jones
ad and
Helen F.
Gleeson
*ad
aSchool of Physics and Astronomy, University of Manchester, Manchester M13 9PL, UK
bDepartment of Chemistry, University of York, York YO10 5DD, UK
cSchool of Chemistry, University of Southampton, Highfield, Southampton SO171BJ, UK
dSchool of Physics and Astronomy, University of Leeds, Leeds LS2 9JT, UK. E-mail: H.F.Gleeson@leeds.ac.uk
First published on 7th September 2015
Abstract
Polarized Raman Spectroscopy (PRS) is used to quantify the orientational order in the conventional (N) and twist-bend (NTB) nematic phases of a homologous series of liquid crystalline dimers. The dimers investigated have 7, 8, 9 and 11 methylene groups connecting two cyanobiphenyl mesogens and data for 4-pentyl-4′-cyanobiphenyl (5CB) and 4-octyl-4′-cyanobiphenyl (8CB) are included for comparison. Simulated and measured Raman spectra for the materials are compared. PRS is used to determine both 〈P2〉 and 〈P4〉 order parameters across the nematic temperature range and immediately below the NTB–N phase transition using a model that takes into account the molecular bend of the odd dimers, which is described in detail. In the nematic phase, the odd dimers are found to exhibit rather low order parameters with 〈P2〉 taking values between 0.3 and 0.5 and 〈P4〉 about 0.25. In contrast, the even dimer shows extremely high values of the order parameters with 〈P2〉 taking values between 0.7 and 0.8 and 〈P4〉 between 0.4 and 0.45. For the odd dimers, the values of 〈P2〉 in the NTB phase are similar to those of the N phase, whereas 〈P4〉 jumps by approximately 5–10% and then decreases with temperature. On comparing the experimental data with the theoretical predictions, we find reasonable qualitative agreement for all materials with molecular field theory. The odd dimers, however, show higher 〈P4〉 values than obtained from theoretical models, a factor attributed to the neglect of molecular flexibility and biaxiality in the PRS analysis.
1 Introduction
Use of the liquid crystal (LC) nematic phase has revolutionised display technology over the past thirty years and this state of matter promises to be equally important in emerging non-display applications.1 The success of liquid crystal phases (mesophases) in applications is driven by their unique combination of fluidity and orientational anisotropy. The nematic (N) phase is the simplest LC phase, in which the molecules tend to lie with their long axes oriented parallel to a single symmetry axis, the director, described by a unit vector n. Variations of the N phase exist, the most common being the chiral nematic phase (N*), which occurs in chiral systems and is characterised by a helicoidal structure. The long-predicted twist-bend nematic (NTB)2–4 phase was discovered recently.5–7 In common with the N and N* phases, the NTB phase has no long-range positional order, and several studies imply a locally helicoidal structure with a pitch of approximately 8 nm,8,9 though Hoffmann et al. have recently suggested an alternative structure.10 However, in contrast to the N* phase, the local director in the NTB phase is reported to be tilted from the helix axis by a temperature-dependent angle of between 9° and 30°.11 An increasing number of materials are being discovered that exhibit the NTB phase, though the most-studied examples are liquid crystalline dimers with an odd methylene spacer unit, which exhibit both N and NTB phases.The NTB phase is found for molecules with, on average, some degree of bend,12–18 a property that is known to have a strong influence on the nematic elastic constants.12,19,20 The NTB phase is most commonly exhibited by dimeric molecules, such as those shown in Fig. 1 with odd alkyl spacer lengths.5,6,8,9,21 On average, such molecules exhibit a bent shape and, in common with systems with the nematic phases formed from molecules with bend in the rigid core,22 intriguing properties such as self-assembly of the non-chiral molecules into chiral structures,6,8,9 and unusual electro-optic, elastic and flexoelectric behaviours5,21,23–26 are observed.
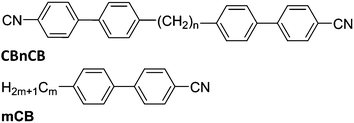 | ||
| Fig. 1 Molecular structures of the materials under investigation: dimers with n = 7, 8, 9 and 11; and the 4-alkyl-4′-cyanobiphenyl reference materials with m = 5 (N 35 °C Iso) and m = 8 (SmA 32.9 °C N 40.8 °C Iso).27 | ||
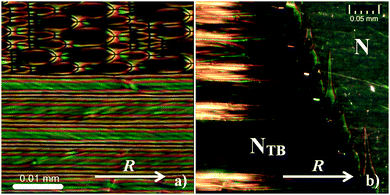
The structure of the NTB phase has been studied widely and it appears to be best explained as a hierarchy of assemblies on different length scales (from nanometers to microns). In contrast to the higher ordered smectic liquid crystal phases, the molecules in the NTB phase do not seem to exhibit a layered structure, a feature that has been confirmed by X-ray5 and freeze-fracture transmission electron microscopy studies.8,9 The helicoidal structures that are reported form despite the fact that the dimer molecules are achiral, so domains with both left- and right-handed helices usually exist in a sample of such materials.28,29 The NTB phase can be distinguished from the conventional nematic phase using polarizing microscopy, with typical textures shown in Fig. 2. The intriguing stripe patterns exhibited form spontaneously and while they are undoubtedly a consequence of the NTB structure, they are still not completely understood.5,30,31 Importantly for this work, the texture remains extremely uniform over a narrow temperature-range just below the N–NTB transition, though a clear phase boundary can be observed.
The NTB phase is currently generating much excitement; it is a challenge to understand the structure of the phase as well as the molecular features that dominate its formation. However, a key aspect of understanding any LC phase is to quantify the orientational order of the system as this allows a test of theory as well as a more complete description of the state of matter. This paper reports a detailed study of the orientational order of the N and NTB phases exhibited by odd dimers. The order parameters deduced are compared with those determined for the N phase of an even dimer and well-known rod-like cyanobiphenyl materials, none of which exhibit the NTB phase. We use Polarized Raman Spectroscopy (PRS) as this allows a deeper insight into liquid crystal order than many other experimental techniques.32
The orientational order of a nematic phase composed of uniaxial molecules can be described by the orientational distribution function represented by a series of Legendre polynomials PL(cos![[thin space (1/6-em)]](https://www.rsc.org/images/entities/char_2009.gif) β) where β is an Euler or polar angle between the prime molecular axis and the director, and L is 2, 4, etc., with the resulting order parameters commonly denoted by 〈P2〉, 〈P4〉 etc. Most experimental measurements of the orientational order in liquid crystals are restricted to determining 〈P2〉 which is the first non-trivial term in the expansion of the orientational distribution function.32 PRS is a particularly powerful technique for determining order parameters as it allows both 〈P2〉 and 〈P4〉 to be accessed readily, therefore providing better accuracy in the orientational distribution function at low order.27 The idea of using Raman spectroscopy to determine liquid-crystalline order was originally proposed by Jen et al.,33,34 and the approach was later modified to include an analysis of the full Raman depolarization ratio27,35,36 to achieve realistic values of 〈P2〉 and 〈P4〉 for simple mesogenic molecules such as the cyanobiphenyls shown in Fig. 1. Here, we employ PRS to deduce both 〈P2〉 and 〈P4〉 in several liquid crystal dimers of different spacer length, the odd members of which exhibit the NTB phase. We investigate the temperature dependence of both 〈P2〉 and 〈P4〉 across the conventional nematic (N) phase range and into the uniformly ordered regime of the NTB phase. We compare the order parameters determined for both odd and even dimers, as well as with conventional alkyl cyanobiphenyl materials. We further compare the results against the classical theoretical models (HJL (Humphries, James and Luckhurst) and Maier–Saupe theory)37,38 and consider the implications of the LZNS (Luckhurst, Zannoni, Nordio and Segre) theory39 that predicts the influence of molecular biaxiality on 〈P2〉 and 〈P4〉 For many years the Maier–Saupe molecular field theory was the classic and particularly successful approach to the prediction and interpretation of the orientational order parameters of nematics. This theory assumed that the anisotropic molecular interactions were second rank and that the molecules were uniaxial. Subsequently Humphries, James and Luckhurst (HJL) removed the first assumption and added a fourth-rank interaction to the second rank used by Maier–Saupe. The second assumption that the molecules were uniaxial was removed by Luckhurst, Zannoni, Nordio and Segre (LZNS) who allowed for an arbitrary molecular symmetry although often this is reduced to just D2h point group symmetry.
β) where β is an Euler or polar angle between the prime molecular axis and the director, and L is 2, 4, etc., with the resulting order parameters commonly denoted by 〈P2〉, 〈P4〉 etc. Most experimental measurements of the orientational order in liquid crystals are restricted to determining 〈P2〉 which is the first non-trivial term in the expansion of the orientational distribution function.32 PRS is a particularly powerful technique for determining order parameters as it allows both 〈P2〉 and 〈P4〉 to be accessed readily, therefore providing better accuracy in the orientational distribution function at low order.27 The idea of using Raman spectroscopy to determine liquid-crystalline order was originally proposed by Jen et al.,33,34 and the approach was later modified to include an analysis of the full Raman depolarization ratio27,35,36 to achieve realistic values of 〈P2〉 and 〈P4〉 for simple mesogenic molecules such as the cyanobiphenyls shown in Fig. 1. Here, we employ PRS to deduce both 〈P2〉 and 〈P4〉 in several liquid crystal dimers of different spacer length, the odd members of which exhibit the NTB phase. We investigate the temperature dependence of both 〈P2〉 and 〈P4〉 across the conventional nematic (N) phase range and into the uniformly ordered regime of the NTB phase. We compare the order parameters determined for both odd and even dimers, as well as with conventional alkyl cyanobiphenyl materials. We further compare the results against the classical theoretical models (HJL (Humphries, James and Luckhurst) and Maier–Saupe theory)37,38 and consider the implications of the LZNS (Luckhurst, Zannoni, Nordio and Segre) theory39 that predicts the influence of molecular biaxiality on 〈P2〉 and 〈P4〉 For many years the Maier–Saupe molecular field theory was the classic and particularly successful approach to the prediction and interpretation of the orientational order parameters of nematics. This theory assumed that the anisotropic molecular interactions were second rank and that the molecules were uniaxial. Subsequently Humphries, James and Luckhurst (HJL) removed the first assumption and added a fourth-rank interaction to the second rank used by Maier–Saupe. The second assumption that the molecules were uniaxial was removed by Luckhurst, Zannoni, Nordio and Segre (LZNS) who allowed for an arbitrary molecular symmetry although often this is reduced to just D2h point group symmetry.
2 Experimental details
The general molecular structures and transition temperatures of the dimers used are given in Fig. 1 and Table 1, respectively. Glass sandwich devices (cells) with antiparallel rubbed SE130 polyimide alignment layers with 1–2° pre-tilt and a 30 μm cell gap (AWAT, Poland) were used to achieve the uniform planar alignment necessary for the order parameter measurements. Such devices induce excellent alignment in the N phase but, as has already been noted, there is only a narrow temperature range in the NTB phase close to the NTB–N phase transition where uniform alignment of the director is observed (Fig. 2b). The temperature regime of uniform NTB alignment is close to the NTB–N phase transition and is found to be slightly wider for the dimers with longer spacer alkyl chains where the transitions are weaker. The width of the NTB regime having a uniform texture depends on the sample heating/cooling rates, varying from approximately 0.5 K in CB7CB, 1 K in CB9CB and 2 K in CB11CB for 30 μm cells. It is this uniform regime that dictates the temperature range over which PRS can be used to determine order parameters in the NTB phase.| Length of alkyl chain (n): name | NTB–N | N–I |
|---|---|---|
| 7: CB7CB | 106.5 | 118.9 |
| 8: CB8CB | — | 205.0 |
| 9: CB9CB | 109.9 | 126.4 |
| 11: CB11CB | 108.8 | 125.1 |
The apparatus used to acquire Raman spectra has been described in detail elsewhere27 and is summarised briefly here. Raman spectra were acquired using a Renishaw 1000 Raman microscope in a backscattering geometry. The homogenously aligned nematic liquid crystal was held in a temperature controlled environment provided by a Linkam hot stage and temperature controller with a relative accuracy of ±0.1 °C. A microscope rotation stage allowed spectra to be acquired for specific orientations of the nematic director with respect to the input and output polarization states. The Raman spectrometer was equipped with a 515.32 nm solid state laser (Spectra Physics) set to provide ∼1 mW of power to the sample. The laser beam is focused to a 5 μm diameter spot size using a 50× objective lens, and the spectra were collected using GRAMS data acquisition software coupled to a charge coupled detector (CCD). The 1 mW incident laser power was combined with an exposure time of 30 s to achieve an optimal signal/noise ratio while avoiding any sample ageing. This can be a feature of organic molecules held at the relatively high temperatures at which the nematic phases of the dimers occur. An increase in the background signal indicates fluorescence which is associated with sample ageing; any such samples were replaced. We have observed no evidence of heating in these or other liquid crystal samples with this exposure time and laser power.
3 Calculations of the Raman spectra
Density functional theory (DFT) was employed to calculate the Raman spectra (peak positions and intensities) of the dimer molecules studied, CB7CB, CB8CB, CB9CB, CB11CB and two additional molecules 8CB and 5CB. This allows the unambiguous assignment of the experimentally determined Raman peaks for the dimers, as well as an understanding of the evolution of the Raman spectra as a function of the molecular structure in the systems under study. The calculations were performed using Becke-(3-parameter)–Lee–Yang–Parr (B3LYP) hybrid functional and 6-31(d) basis set in the Gaussian 09 package.41 The 6-31(d) basis set has been applied successfully to large organic molecules42,43 and liquid crystals.44–47 Geometry optimization for all molecules was carried out without imposing constraints. Fig. 3 compares the calculated spectrum of the dimer molecule CB7CB with the experimental data. It also shows the calculated Raman spectra for all of the materials; peak assignments are listed in Table 2.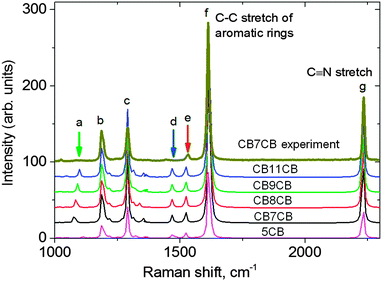 | ||
| Fig. 3 The simulated Raman spectra of the dimers compared with the experimental data for CB7CB at 104 °C in the NTB phase (top line). The letters refer to specific vibrations defined in Table 2. | ||
| a | C–C stretching in the alkyl chain |
| b | C–H deformation in the outer phenyls |
| c | C–C stretching of the biphenyl ring |
| d | CH2 scissoring mode in the alkyl spacer |
| e | Aromatic C–C stretching, asymmetric |
| f | Aromatic C–C stretching, symmetric |
| g | C![[triple bond, length as m-dash]](https://www.rsc.org/images/entities/char_e002.gif) N stretching N stretching |
A comparison of the calculated spectra reveals that although the spectra for the different materials are very similar, some small shifts are expected in some of the peak positions as the molecular structure of the dimers is changed. For example, the calculated position of peak (a) corresponding to the C–C stretch of the spacer alkyl chain shifts from 1075 cm−1 in CB7CB to 1099 cm−1 in CB11CB (Fig. 3, green arrow). The equivalent peak in the calculated spectrum of 5CB is the C–C stretch of the terminal alkyl chain, which occurs at 1016 cm−1 and has a much lower intensity. This position is consistent with the experimentally observed Raman spectrum for 8CB in the nematic phase (see, for example Fig. 5 in ref. 27).
The calculations can be compared to experimentally determined Raman spectra for the dimers; experimental data for CB7CB is included in Fig. 3. We find excellent agreement between the calculated peak positions and those determined experimentally, but the relative intensity of the Raman peaks can vary. For example, the intensity of peak c is almost 2.5 times stronger than peak b in the calculated spectra, whereas in the experimental data the difference is less than a factor of 1.5. Further, peaks a and d are extremely weak experimentally, with relative intensities almost 3 times lower than the simulation implies. Such differences can be attributed to the influence of the molecular environment in the liquid crystal phase, which is not taken into account in the simulation where the calculations are for isolated molecules. The strongest peak both experimentally and from the simulation is attributed to the C–C stretch of the aromatic rings (peak f). This peak has been shown to be an excellent choice from which to evaluate the order parameters using PRS, in addition to offering the best signal to noise ratio; it is this peak that we use in our PRS analysis.
4 Obtaining orientational order parameters from the depolarization ratio: molecules with a bent average shape
The application of PRS to determining orientational order parameters for liquid crystals has been limited, almost entirely, to rod-like molecules.27,32–36 Further, the most commonly used Raman vibration is the phenyl C–C stretching mode,32 which, as can be seen from Fig. 3, provides the strongest scattering peak, with a Raman shift of ∼1600 cm−1. This mode is strongly polarized along the molecular long axis for rod-like molecules such as 5CB and 8CB and satisfies the assumptions made in determining order parameters from Raman spectra. Here, we briefly describe a model that can take a bent molecular geometry into account. Such a modification is required since it has been shown that using a simple linear model for bend molecules can result in anomalously low values of order parameter being calculated from the experimental data.48,49 As mentioned, a key defining feature of molecules forming the twist-bend nematic phase is their averaged bent form so ignoring the molecular bend may not be justified.To determine the order parameters from PRS, spectra are measured at 10° intervals over a 360° sample rotation around the beam optical axis, for both parallel and perpendicular polarizer–analyzer orientations. The C–C stretching peak is fitted with a biased Lorentzian function in order to obtain precise peak intensity, separated from the background. The need for absolute intensity measurements is removed by defining the depolarization ratio R(θ) = I⊥(θ)/I∥(θ), calculated for each polarization angle, θ, by taking the ratio of the measured intensities for polarizations perpendicular and parallel to the director.
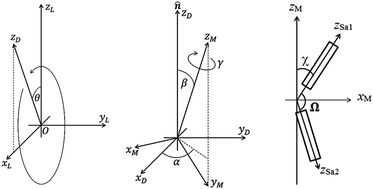
The model used for the dimer system is shown in Fig. 4 and is essentially the same as that of ref. 48 described in more detail here. For dimers with even spacers the conformationally averaged molecular shape has the two monomer arms anti-parallel to each other, i.e. Ω = 180°, while an odd spacer produces an averaged bent shape for the mesogenic molecule. We have fitted our data using both cases to show the differences in the orientational order parameters deduced from the two models.
In order to predict the scattered intensity for the dimer systems, the two mesogenic arms are treated as an entirety, both of which contribute to the molecular Raman tensor. The intensity of the Raman scattered light is proportional to the square of the polarizability derivative with respect to the displacement Q as described in eqn (1):
 | (1) |
 | (2) |
 | (3) |
 | (4) |
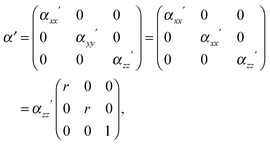
This basic approach, which is relevant for linear molecules, can be adapted for the dimer system as follows. Fig. 4 shows the basic model of a V-shaped dimer system with a bend angle of Ω. The molecular long axis, zM, lies in a certain direction in the molecular bend plane, having a set of Euler angles (α,β,γ) with respect to the nematic director n. Two different Raman active arms (arm 1 and arm 2) are assumed to be along the two rigid mesogenic groups that have different tilt angles from the molecular long axis. The tilt angles of arm 1 and 2 with respect to the molecular axis zM are 90° − Ω/2 and 90° + Ω/2 respectively. Thus, the conformationally averaged dimer molecule can be taken to be a combination of two moieties separated by the angle Ω making tilt angles of 90° − Ω/2 and 90° + Ω/2 with respect to the molecular long axis, zM. For our particular odd dimers (1) the two arms have exactly the same vibrational modes, (2) the modes for each arm exhibit cylindrical symmetry and (3) the liquid crystal system has no ferroelectric properties which means n = −n in keeping with the phase symmetry of D∞h and D∞ in the N and NTB phases, respectively.
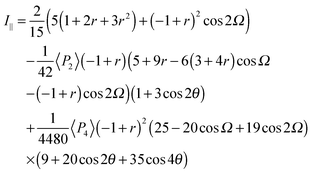
Since no global phase biaxiality was found in the nematic phases for this class of molecules6eqn (4) can still be used. The effect of the molecular biaxiality will be ignored, in common with all other published work on PRS, although we recognise that bent (dimer) molecules are certainly biaxial. We can justify making this assumption as analysis of the C–C phenyl stretch in the cyanobiphenyl and bent-core molecules results in values of 〈P2〉 deduced from PRS that are comparable to those determined using other approaches.20,32 However, we note that neglecting molecular biaxiality in this analysis will lead to higher than expected values of 〈P4〉 being calculated from the data. Details of this complex issue will be the subject of a further publication, although this point will be mentioned again in the discussion section of this paper. All the other assumptions that are implicit in determining 〈P2〉 and 〈P4〉 from PRS are also made here. Specifically we combine the assumptions that the Raman active vibrations have cylindrical symmetry and the two vibrations are the same so that the Raman tensor for each arm can be obtained. They can be expressed in the diagonal form given in eqn (2). It is worth noting that the two diagonal tensors are in different frames. The z axes for arm 1 and arm 2 are zSa1 and zSa2, respectively (see Fig. 4). In order to derive the intensity expression, the Raman tensor of each arm needs appropriate coordinate transformations to the laboratory frame. Both arms of the dimer will scatter the beam inelastically and so contribute to the same Raman peak intensity. Following the approach of ref. 48, the contributions are treated as superimposed so the total Raman scattered intensity can be expressed as:
 | (5) |
 | (6) |
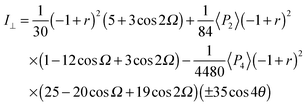 | (7) |
The depolarization ratio R is given by R = I⊥/I∥ from eqn (6) and (7). The depolarization ratio for every sample rotation angle θ can be obtained and a fit to the full depolarization data made; the order parameters can be deduced from the fitting process. The depolarization ratio expression has five variables with which to fit the scattering data: the order parameters 〈P2〉 and 〈P4〉, the differential polarizability ratio r, the bend angle Ω, and the initial azimuthal angle of the sample with respect to the polarization plane of the incident beam. To keep only independent fitting parameters, we take the bend angle Ω to be known and constant. For the dimers, we have assumed Ω as determined from the known chemical structures of the molecules and measured experimentally.12 This assumption eliminates any redundancy and makes the fitting feasible.
Fig. 5 shows typical data in the form of the experimentally determined depolarization ratio and the fitting results for CB9CB. In order to ensure that our model does not introduce artefacts into the order parameters measured, we perform the fitting using two sets of values for the angle Ω. Simple rod-like molecules have Ω = 180° while we assume that the dimer molecules have Ω = 122°, corresponding to measurements of the bent conformers of the odd dimers.11Fig. 5 shows the results of the fitting procedure for these two cases. The fitting curves for both models are indistinguishable. However, the changes in the molecular bend angle lead to different values for the order parameters 〈P2〉 and 〈P4〉. In this particular case the deduced order parameters at T = 120 °C are:
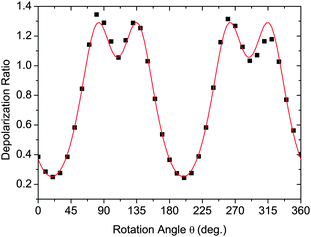 | ||
| Fig. 5 Fitting the depolarization ratio with eqn (6) and (7) for CB9CB at T = 120 °C in the N phase. Black squares – experimental data, red line – fitted curve (the two theoretical fits are indistinguishable). | ||
• Ω = 180° leads to 〈P2〉 = 0.40 ± 0.03, 〈P4〉 = 0.18 ± 0.03, r = −0.27 ± 0.03;
• Ω = 122° leads to 〈P2〉 = 0.45 ± 0.03, 〈P4〉 = 0.19 ± 0.03, r = −0.34 ± 0.03.
The uncertainties quoted are those described in ref. 48. Although excellent fits are obtained in both cases, there are clear differences in the order parameters with the linear model leading to lower values compared with those of the V-shaped model with its bend.
5 Order parameter results and discussion
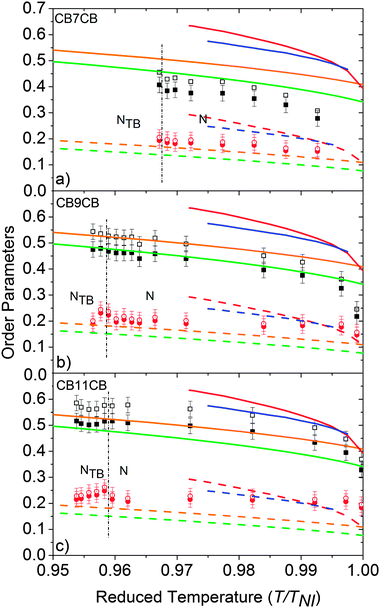
Fig. 6 shows the temperature dependence of the order parameters 〈P2〉 and 〈P4〉 for the odd dimers. The data for the even dimer are shown, together with results for 5CB and 8CB (included here for comparison)27 in Fig. 7. For the odd dimers, we have presented the order parameters deduced from fits using both linear and bent models as discussed; the rod-like model has Ω = 180° and the bent model with Ω = 122° In both cases, the order parameters are for the molecular z-axis. It can be seen that inclusion of the molecular bend angle clearly affects the values of 〈P2〉 and 〈P4〉 obtained, with consistently lower order parameter values obtained if the molecular bend is neglected. For all the nematic mesogens the order parameters decrease with increasing temperature, which is a natural consequence of the thermal fluctuations with respect to the director. Fig. 6 and 7 include lines calculated from the HJL37 theory and the LZNS39 theory; the parameters λ and γ are as defined in the original references, and represent deviations from molecular cylindrical symmetry. We note that the LZNS approach includes molecular biaxiality, neglected in our determination of the order parameters and of more relevance to the odd dimers than to the effectively linear molecules shown in Fig. 7. The order parameters obtained for the monomers 5CB and 8CB and the dimer CB11CB show reasonable agreement with HJL theory, while CB7CB and CB9CB are in marginally better agreement with LZNS theory. CB8CB (Fig. 7) does not fit with either approach. An overall comparison with LZNS theory suggests that the measured values of 〈P4〉 determined experimentally should be lower for the odd dimers, which they would be if molecular biaxiality was considered in our analysis model, a point returned to later.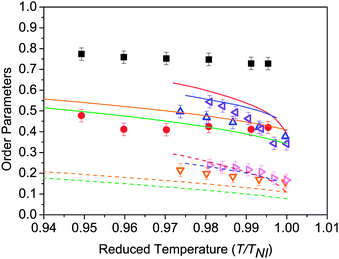 | ||
| Fig. 7 The 〈P2〉 (black squares) and 〈P4〉 (red circles) order parameters measured in CB8CB, fitted assuming linear molecules, compared with the monomers 5CB (up-down triangles) and 8CB (left-right triangles). The values for 8CB are taken from ref. 23. Theoretical lines based on HJL and LZNS theory are also shown. For HJL theory, the red lines represent λ = 0.15, γ = 4 and blue lines λ = 0.25, γ = 0; the solid and dashed lines represent 〈P2〉 and 〈P4〉 respectively. For the LZNS theory, the orange lines represent λ = 0.1, and the green line λ = 0.2. | ||
There are several features of the results in Fig. 6 and 7 worthy of discussion. We consider first the behaviour of the order parameters at the NTB–N phase transition, in Fig. 6 only. The discussion assumes the helicoidal model of the NTB phase, but we note that it is would also be consistent with the model proposed by Hoffmann et al. who proposed a structure based on highly correlated chiral assemblies.10 Although the spontaneous formation of the defect texture in the NTB phase makes the measurements impossible over a wide temperature range, some data can be determined in the uniform state over the narrow temperature region close to the NTB–N phase transition. At the transition to the twist-bend nematic phase the helix axis is parallel to the rubbing direction on the surface. The director is tilted with respect to the helix axis but the tilt angle is found to be small at the transition.10 Accordingly, despite the helical structure of the phase, the director remains in effect parallel to the rubbing direction which facilitates the analysis of the angular dependence of the Raman scattering intensity. However, the director distribution changes rapidly with temperature in the vicinity of the transition,11 presumably causing the defect textures to form. We have assumed that the uniformly aligned NTB phase can be treated in the same way as the N phase, i.e. that the helix axis is aligned parallel to the rubbing direction and the director is along the rubbing direction. Given the relatively small tilt angles associated with the NTB structure close to the transition to the N phase, and noting the averaging role of molecular diffusion along the helix axis, we believe that our assumptions are both pragmatic and reasonable, potentially leading to a slight underestimate in the values of the order parameters. However, strictly a further modification of the theory which takes into account the director tilt in the NTB structure is necessary, though it is unlikely that the additional number of parameters that would have to be included would allow robust fitting to the PRS data.
Fig. 6 shows no significant discontinuity in the behaviour of 〈P2〉 and 〈P4〉 at the N–NTB phase transition for the three dimers. This is surprising for CB7CB because the NTB–N transition has been shown to be first order by DSC and NMR spectroscopy,6 though only one data point is obtained in the NTB phase for this system via PRS. Nonetheless some minor changes are seen in 〈P4〉 for CB11CB including an initial slight increase in value on cooling into the NTB phase. Moreover, the temperature gradient of 〈P4〉 changes its sign at the NTB–N phase transition for both CB9CB and CB11CB.
The lack of a clear discontinuity in 〈P2〉 across the NTB–N phase transition of the materials studied here can be compared with other observations. The birefringence is closely linked to the 〈P2〉 order parameter and both Chen et al. and Borshch et al. report a continuous variation in the birefringence at the NTB–N phase transition, decreasing in the NTB phase.8,9 The behaviour below the transition differs in the two reports; the mixture studied by Borshch et al. exhibits a slowly decreasing birefringence in the NTB phase, while in CB7CB Chen et al. describe a rapid decrease in the birefringence 2 to 4 K below the transition. The deuterium NMR data reported by Chen et al. also appear to show an effectively continuous transition with a small but significant reduction as the CB7CB sample is cooled into the NTB phase. However, the NMR data were in fact obtained by Cestari et al.6 for CB7CB and only one of the prochiral splittings was included. When both are allowed for, as should occur, the jump in splittings is clearly observed, consistent with a discontinuous NTB–N phase transition.
An important feature of the PRS analysis is that it allows us also to determine the 〈P4〉 order parameter and it is interesting to consider its reduction as the sample is cooled into the NTB phase. Such a reduction is consistent with the tilted helicoidal structure adopted by the director in the phase. Indeed, we suggest that the change in 〈P4〉 below the transition is a combination of two opposing influences; the director tilt causes 〈P4〉 to decrease whereas the orientational order causes an increase. The net reduction suggests that the effect of the tilt dominates.
We now consider the magnitude of the order parameters determined for the dimers. Fig. 7 shows the order parameters found for the even dimer, CB8CB together with two cyanobiphenyl monomers. One of the most striking results is that the order parameters for the even dimer are nearly double those of the odd dimers (Fig. 6) and are almost independent of temperature. The temperature dependence is consistent with the strongly first order N–I phase transition in CB8CB where ΔS/R is ∼2.6.51 The maximum order parameter values for CB8CB are 〈P2〉 = 0.75 and 〈P4〉 = 0.40, which compare with 〈P2〉 = 0.50 and 0.55 and 〈P4〉 = 0.20 and 0.25 in 5CB and 8CB, respectively. The nematic order parameters measured for CB8CB are amongst the highest seen in nematic liquid crystals. This high orientational order parameter 〈P2〉 is consistent with the predictions of a molecular field theory for flexible even dimers.52
The values for 〈P2〉 obtained by PRS for both odd and even dimers are in good qualitative agreement with the Szz order parameter obtained from nuclear magnetic resonance (NMR) experiments for probe molecules such as anthracene with the z-direction along the long axis of this molecule dissolved in the dimers.53 For example, for the odd dimer, CB7CB, 2H NMR spectroscopy gives values of Szz between ∼0.25 and 0.35 across the N phase whereas from PRS, the 〈P2〉 values are a bit lower, varying between ∼0.2 and 0.3 across the phase. In both cases, the values for even dimers are much higher. Barnes et al. report Szz values between ∼0.5 and 0.6 across the nematic phase of CB6CB, while Fig. 7 shows 〈P2〉 ∼0.75 for CB8CB, i.e. in both cases the order parameters are much higher for even than odd dimers.
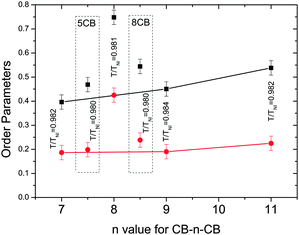
Fig. 8 compares the values of the order parameters at equivalent reduced temperatures deep in the nematic phase for all of the nematogens in this investigation. The order parameters for the even-spacer (on average straight) molecules are nearly double those as for the odd-spacer (on average bent) molecules. For the odd dimers both order parameters increase slightly with increasing spacer length in keeping with the molecular-field predictions.52 However, the order parameters associated with the odd dimers are smaller than 5CB or 8CB, suggesting that the dimer molecules are less likely to align parallel to each other as expected. More specifically, the monomers are rod-like and so the order parameters are expected to be high while the biaxiality of the odd dimers will tend to lower the order parameters and so are in keeping with molecular field theory predictions, as are the very high values for CB8CB.52
We now compare the experimentally determined order parameters with the theoretical predictions. In doing so, in addition to the observations that can be made from Fig. 6 and 7, it is instructive to compare 〈P2〉 and 〈P4〉 directly, removing the explicit temperature dependence. This is done in Fig. 9 which shows plots of 〈P4〉 versus 〈P2〉 for all of the materials considered across the full nematic phase regime; the values obtained in the NTB phase are indicated by solid data points in Fig. 9(b)–(d). The solid line in Fig. 9 is calculated from Maier–Saupe (MS) theory while the other two lines are the predictions from HJL theory included in Fig. 6 and 7. The first point to notice is that there is excellent agreement between the experimental data and the MS prediction for CB8CB (Fig. 9(a)) even though the theory does not allow for the structural of flexibility of the dimer. We can see that in general the difference between the MS and HJL theoretical predictions and the experimental data is comparable for the odd dimers and the monomers, 5CB and 8CB. However, the trend for the dimers is slightly different: the lower temperature points are in better agreement with theory than the high temperature data. Further, the longer the spacer in the odd dimer the better is the agreement with the theory at low temperatures such that for CB11CB (Fig. 9(d)) the low temperature data points coincide with the theory within the experimental error. This is somewhat surprising since the theory does not allow for the key features of the molecular structure. The increasingly poor agreement between theory and experiment at high temperatures for the shorter spacer odd dimers is somewhat unexpected, though it is noteworthy that the molecular-field predictions do seem to predict this trend. Such behaviour for the odd dimers is consistent with 〈P2〉 and 〈P4〉 taking consistently higher values at high temperatures than is observed for the monomer molecules. We now return to consider 〈P4〉. Fig. 6 shows that 〈P4〉 is not especially sensitive to the model used to analyse the PRS data in this work. However, the deviations of 〈P4〉 from the HJL theory apparent in Fig. 6 and 7 are clearly worse for the dimer molecules than for the smaller linear systems, perhaps reflecting the neglect of the flexibility and its associated influence on the conformational populations of the dimers that will become more marked at higher temperatures. It is also clear that the neglect of biaxiality in the model used to analyse PRS data tends to overestimate the value of 〈P4〉; calculations of 〈P4〉 that take into account biaxiality (LZNS theory) predict consistently lower values (Fig. 6 and 7).
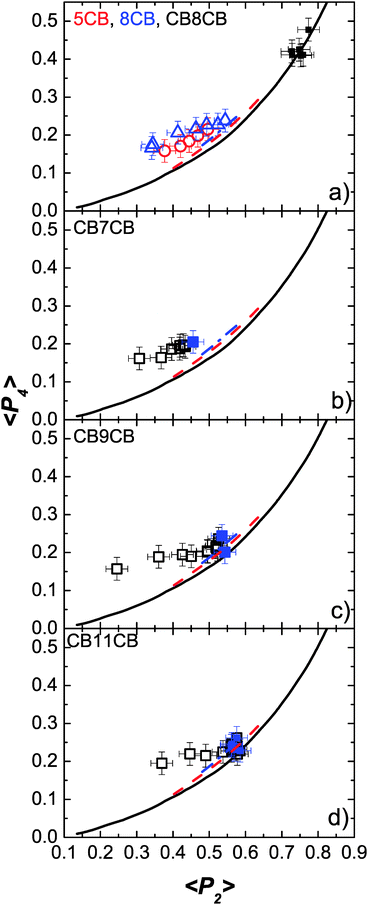 | ||
| Fig. 9 The variation of 〈P4〉 as a function of 〈P2〉 for all of the materials, compared with theoretical predictions. (a) CB8CB (squares), 5CB (circles) and 8CB (triangles), (b) CB7CB, (c) CB9CB and (d) CB11CB. The filled data points in (b–d) are in the NTB phase. The experimental data points are compared with Maier–Saupe (black line, data from ref. 47) and HJL theories (red dashed line: λ = 0.15, γ = 4; blue dash and dotted line: λ = 0.25, γ = 0). | ||
Finally, we note that the filled symbols in Fig. 9(b)–(d), corresponding to data in the NTB phase, indicate that the assumption of using the same fitting procedure to the PRS data in the N and NTB phases does not lead to any discernible anomalies between the data and theory, i.e. that the properties of the two phases do not change significantly at the transition.
6 Conclusions
The 〈P2〉 and 〈P4〉 order parameters have been measured in the nematic phases of four dimer materials using the PRS technique. The model that allows the molecular bend angle to be taken into account in the analysis of the experimental data is described in detail and it is shown that for this system, taking the molecular bend into account returns consistently slightly higher values of order parameter. The magnitude and the temperature dependence of the order parameters are in good agreement with those reported from the optical and NMR methods as well as molecular field predictions which allow for molecular flexibility. Moreover, the even dimer shows significantly higher order parameters than in either the monomers or the odd dimers. We find reasonable agreement for the order parameters determined via PRS for the long, highly anisotropic molecules of the even dimer with the theoretical predictions when the temperature-dependence is removed (Fig. 9). The odd dimers, however, show higher measured values of 〈P4〉 than are obtained from theoretical models, this is particularly obvious at high temperatures. There are two possible explanations for such an observation, attributable to either the neglect of the flexibility or the biaxiality of the molecules or both.Although the NTB phase features a spontaneous director deformation that restricts the Raman measurements at lower temperatures, it is possible to obtain the order parameters in a narrow temperature regime just below the N–NTB phase transition. The values of 〈P2〉 in the twist-bend nematic phase are found to be nearly the same as in the N phase (to within the experimental error), while 〈P4〉 exhibits a jump of approximately 5–10% followed by a change in the temperature gradient. We conclude that the NTB phase is very similar in form to the nematic phase at temperatures very close to the phase transition, in keeping with the weakness of the NTB–N transition.
Acknowledgements
This work was supported by the Engineering and Physical Sciences Research Council (EP/G023093/1, EP/D055261/1, EP/J007714/1 and EP/L012111/1). MN thanks the Royal Commission for the Exhibition of 1851 for a Fellowship. JCJ wishes to thank the EPSRC for an Advanced Manufacturing Fellowship (EP/L015188/1).References
- J. W. Goodby, P. J. Collings, T. Kato, C. Tschierske, H. F. Gleeson and P. Raynes, Handbook of Liquid Crystals, Wiley VCH, Weinheim, 2014 Search PubMed.
- R. B. Meyer, Molecular Fluids, Les Houches Lectures 1973, Gordon and Breach, 1976 Search PubMed.
- I. Dozov, Europhys. Lett., 2001, 56, 247–253 CrossRef CAS.
- J. W. Goodby, S. J. Cowling and V. Görtz, C. R. Chim., 2009, 70–84 CrossRef CAS.
- V. P. Panov, M. Nagaraj, J. K. Vij, Y. P. Panarin, A. Kohlmeier, M. G. Tamba, R. A. Lewis and G. H. Mehl, Phys. Rev. Lett., 2010, 105, 167801 CrossRef CAS PubMed.
- M. Cestari, S. Diez-Berart, D. A. Dunmur, A. Ferrarini, M. R. de la Fuente, D. J. B. Jackson, D. O. Lopez, G. R. Luckhurst, M. A. Perez-Jubindo, R. M. Richardson, J. Salud, B. A. Timimi and H. Zimmermann, Phys. Rev. E: Stat., Nonlinear, Soft Matter Phys., 2011, 84, 031704 CrossRef CAS PubMed.
- M. Sepelj, A. Lesac, U. Baumeister, S. Diele, H. L. Nguyen and D. W. Bruce, J. Mater. Chem., 2007, 17, 1154–1165 RSC.
- D. Chen, J. H. Porada, J. B. Hooper, A. Klittnick, Y. Shen, M. R. Tuchband, E. Korblova, D. Bedrov, D. M. Walba, M. A. Glaser, J. E. Maclennan and N. A. Clark, Proc. Natl. Acad. Sci. U. S. A., 2013, 110, 15931–15936 CrossRef CAS PubMed.
- V. Borshch, Y. K. Kim, J. Xiang, M. Gao, A. Jakli, V. P. Panov, J. K. Vij, C. T. Imrie, M. G. Tamba, G. H. Mehl and O. D. Lavrentovich, Nat. Commun., 2013, 4, 2635, DOI:10.1038/ncomms3635.
- A. Hoffmann, A. G. Vanakaras, A. Kohlmeier, G. H. Mehl and D. J. Photinos, Soft Matter, 2015, 11, 850–855 RSC.
- C. Meyer, G. R. Luckhurst and I. Dozov, J. Mater. Chem. C, 2015, 3, 318–328 RSC.
- C. Greco, G. R. Luckhurst and A. Ferrarini, Soft Matter, 2014, 10, 9318–9323 RSC.
- S. M. Jansze, A. Martinez-Felipe, J. M. D. Storey, A. T. M. Marcelis and C. T. Imrie, Angew. Chem., Int. Ed., 2015, 54, 643–646 CAS.
- D. Chen, M. Nakata, R. Shao, M. R. Tuchband, M. Shuai, U. Baumeister, W. Weissflog, D. M. Walba, M. A. Glaser, J. E. Maclennan and N. A. Clark, Phys. Rev. E: Stat., Nonlinear, Soft Matter Phys., 2014, 89, 022506 CrossRef PubMed.
- R. J. Mandle, E. J. Davis, C. T. Archbold, S. J. Cowling and J. W. Goodby, J. Mater. Chem. C, 2014, 2, 556–566 RSC.
- R. J. Mandle, E. J. Davis, C. T. Archbold, C. C. A. Voll, J. L. Andrews, S. J. Cowling and J. W. Goodby, Chem. – Eur. J., 2015, 21, 8158–8167 CrossRef CAS PubMed.
- R. J. Mandle, E. J. Davis, S. A. Lobato, C.-C. A. Vol, S. J. Cowling and J. W. Goodby, Phys. Chem. Chem. Phys., 2014, 16, 6907–6915 RSC.
- R. J. Mandle, E. J. Davis, C.-C. A. Vol, C. T. Archbold, J. W. Goodby and S. J. Cowling, Liq. Cryst., 2015, 42, 688–703 CAS.
- S. Kaur, H. Liu, J. Addis, C. Greco, A. Ferrarini, V. Görtz, J. W. Goodby and H. F. Gleeson, J. Mater. Chem. C, 2013, 1, 6667–6676 RSC.
- S. Kaur, J. Addis, C. Greco, A. Ferrarini, V. Görtz, J. W. Goodby and H. F. Gleeson, Phys. Rev. E: Stat., Nonlinear, Soft Matter Phys., 2012, 86, 041703 CrossRef CAS PubMed.
- M. Cestari, E. Frezza, A. Ferrarini and G. R. Luckhurst, J. Mater. Chem., 2011, 21, 12303–12308 RSC.
- V. Görtz, C. Southern, N. W. Roberts, H. F. Gleeson and J. W. Goodby, Soft Matter, 2009, 5, 463–471 RSC.
- V. P. Panov, J. K. Vij, R. Balachandran, V. Borshch, O. D. Lavrentovich, M. G. Tamba and G. H. Mehl, Proc. of SPIE Vol. 8828 88280X-1, 2013.
- C. Meyer, G. R. Luckhurst and I. Dozov, Phys. Rev. Lett., 2013, 111, 067801 CrossRef CAS PubMed.
- R. Balachandran, V. P. Panov, J. K. Vij, A. Kocot, M. G. Tamba, A. Kohlmeier and G. H. Mehl, Liq. Cryst., 2013, 40, 681–688 CrossRef CAS.
- N. Sebastian, D. O. Lopez, B. Robles-Hernandez, M. R. de la Fuente, J. Salud, M. A. Perez-Jubindo, D. A. Dunmur, G. R. Luckhurst and D. J. B. Jackson, Phys. Chem. Chem. Phys., 2014, 16, 21391–21406 RSC.
- C. D. Southern and H. F. Gleeson, Eur. Phys. J. E: Soft Matter Biol. Phys., 2007, 24, 119–127 CrossRef CAS PubMed.
- V. P. Panov, R. Balachandran, M. Nagaraj, J. K. Vij, M. G. Tamba, A. Kohlmeier and G. H. Mehl, Appl. Phys. Lett., 2011, 99, 261903 CrossRef.
- J. W. Emsley, P. Lesot, G. R. Luckhurst, A. Meddour and D. Merlet, Phys. Rev. E: Stat., Nonlinear, Soft Matter Phys., 2013, 87, 040501 CrossRef PubMed.
- P. K. Challa, V. Borshch, O. Parri, C. T. Imrie, S. N. Sprunt, J. T. Gleeson, O. D. Lavrentovich and A. Jakli, Phys. Rev. E: Stat., Nonlinear, Soft Matter Phys., 2014, 89, 060501 CrossRef CAS PubMed.
- E. Gorecka, M. Salmonczyk, A. Zep, D. Pociecha, C. Welch, Z. Ahmed and G. H. Mehl, Liq. Cryst., 2015, 42, 1–7 CrossRef CAS.
- H. F. Gleeson, C. D. Southern, P. D. Brimicombe, J. W. Goodby and V. Görtz, Liq. Cryst., 2010, 37, 949–959 CrossRef CAS.
- S. Jen, N. A. Clark, P. S. Pershan and E. b. Priestle, Phys. Rev. Lett., 1973, 31, 1552–1556 CrossRef CAS.
- S. Jen, N. A. Clark, P. S. Pershan and E. B. Priestley, J. Chem. Phys., 1977, 66, 4635–4661 CrossRef CAS.
- W. J. Jones, D. K. Thomas, D. W. Thomas and G. Williams, J. Mol. Struct., 2004, 708, 145–163 CrossRef.
- A. Sanchez-Castillo, M. A. Osipov, S. Jagiella, Z. H. Nguyen, M. Kaspar, V. Hamplova, J. Maclennan and F. Giesselmann, Phys. Rev. E: Stat., Nonlinear, Soft Matter Phys., 2012, 85, 061703 CrossRef CAS PubMed.
- R. L. Humphries, P. G. James and G. R. Luckhurst, J. Chem. Soc., Faraday Trans. 2, 1972, 68, 1031–1044 RSC.
- W. Maier and A. Saupe, Z. Naturforsch., 1958, 13a, 564–566 CAS.
- G. R. Luckhurst, C. Zannoni, P. L. Nordio and U. Segre, Mol. Phys., 1975, 30, 1345–1358 CrossRef CAS.
- K. Hori, M. Iimuro, A. Nakao and H. Toriumi, J. Mol. Struct., 2004, 699, 23–29 CrossRef CAS.
- Gaussian 09, Revision B.01, Gaussian, Inc, Wallingford, CT, 2010 Search PubMed.
- K. Kim and K. D. Jordan, J. Phys. Chem., 1994, 98, 10089–10094 CrossRef CAS.
- P. J. Stephens, F. J. Devlin, C. F. Chabalowski and M. J. Frisch, J. Phys. Chem., 1994, 98, 11623–11627 CrossRef CAS.
- A. R. K. Selvaraj, W. Weissflog and R. Friedemann, J. Mol. Model., 2007, 13, 907–917 CrossRef CAS PubMed.
- S. Ananda Rama Krishnan, W. Weissflog, G. Pelzl, S. Diele, H. Kresse, Z. Vakhovskaya and R. Friedemann, Phys. Chem. Chem. Phys., 2006, 8, 1170–1177 RSC.
- W. Weissflog, G. Naumann, B. Kosata, M. W. Schroder, A. Eremin, S. Diele, Z. Vakhovskaya, H. Kresse, R. Friedemann, S. A. R. Krishnan and G. Pelzl, J. Mater. Chem., 2005, 15, 4328–4337 RSC.
- W. Weissflog, U. Baumeister, M.-G. Tamba, G. Pelzl, H. Kresse, R. Friedemann, G. Hempel, R. Kurz, M. Roos, K. Merzweiler, A. Jakli, C. Zhang, N. Diorio, R. Stannarius, A. Eremin and U. Kornek, Soft Matter, 2012, 8, 2671–2685 RSC.
- C. D. Southern, P. D. Brimicombe, S. D. Siemianowski, S. Jaradat, N. Roberts, V. Gortz, J. W. Goodby and H. F. Gleeson, Europhys. Lett., 2008, 82, 56001 CrossRef.
- H. F. Gleeson and P. D. Brimicombe, Phys. Rev. Lett., 2011, 107, 109801 CrossRef CAS PubMed.
- M. Vangurp, Colloid Polym. Sci., 1995, 273, 607–625 Search PubMed.
- G. R. Luckhurst, Macromol. Symp., 1995, 96, 1–26 CrossRef CAS.
- A. Ferrarini, G. R. Luckhurst, P. L. Nordio and S. J. Roskilly, J. Chem. Phys., 1994, 100, 1460–1469 CrossRef CAS.
- P. J. Barnes, A. G. Douglass, S. K. Heeks and G. R. Luckhurst, Liq. Cryst., 1993, 13, 603–613 CrossRef CAS.
| This journal is © The Royal Society of Chemistry 2015 |

