 Open Access Article
Creative Commons Attribution 3.0 Unported Licence
Swelling of PDMS networks in solvent vapours; applications for passive RFID wireless sensors†
C. V.
Rumens
a,
M. A.
Ziai
b,
K. E.
Belsey
a,
J. C.
Batchelor
*b and
S. J.
Holder
*a
aFunctional Materials Group, School of Physical Sciences, University of Kent, Canterbury, Kent, UK CT2 7NH. E-mail: S.J.Holder@kent.ac.uk
bSchool of Engineering and the Digital Arts, University of Kent, Canterbury, Kent, UK CT2 7NT. E-mail: J.C.Batchelor@kent.ac.uk
First published on 18th August 2015
Abstract
The relative degree of swelling of a poly(dimethylsiloxane) (PDMS) network in organic vapours is demonstrated to be related to the chemical and physical properties of the organic compounds. The swelling ratio, based on volume change, QV, is directly correlated with the Hansen solubility parameters, δd, δp and δh and the vapour pressures of the organic vapours employed. A practical use for such PDMS networks in combination with an understanding of the relationship is demonstrated by the use of PDMS as a mechanical actuator in a prototype wireless RFID passive sensor. The swelling of the PDMS displaces a feed loop resulting in an increase in transmitted power, at a fixed distance.
Introduction
The largest class of commercial inorganic polymers are the silicones (most typically polydimethylsiloxane based) and the inorganic nature of the materials confers many advantages over carbon based systems such as high thermal and oxidative stability, very low surface free energy, and high equilibrium and dynamic flexibility.1–6 In particular the ability of polydimethylsiloxane materials to absorb both volatile and non-volatile organic compounds is well known. As a consequence of this property it is routinely used in analytical applications in particular as a matrix for sampling substances form the air, water and soil in particular in solid phase extraction (SPE) techniques.6–9 A downside of SPE is that the absorption of compounds can lead to significant swelling, which can be detrimental in such applications. PDMS (silicone) materials are also increasingly used as the key components for microfluidic systems due to their general inertness, but again swelling by organic solvents can be detrimental to their application.10,11 Whitesides et al. demonstrated that the extent of PDMS swelling in solvents is principally determined by the solubility of the solvent in PDMS and in particular the Hildebrand solubility parameters of the solvents and PDMS.12In this manuscript we will demonstrate the relationship between the Hansen solubility parameters and the vapour pressures of organic solvents and the resulting degree of swelling of a network PDMS material. Furthermore even though the swelling of PDMS is commonly seen as a negative characteristic for many applications, it offers excellent opportunities as an actuating mechanism in sensor devices. In particular we will demonstrate that the swelling of PDMS by an organic vapour can be utilised as the actuating component in a wireless sensor.
Passive radio frequency identification (RFID) sensors are highly desirable as they are low cost, energy-efficient, wireless and lightweight. Passive RFID sensors have been developed and successfully used to either detect and/or monitor a range of analytes such as, temperature,13 strain,14 moisture,15 and volatile organic compounds (VOC).16 There has been much interest in developing passive RFID VOC sensors for a number of applications including; monitoring food quality in packaging17 and homeland security.18 The majority of gas and vapour sensors, wireless and non-wireless rely on the variation of electrical properties (conductance, capacitance and permittivity) of a material in response to an analyte as a sensing method.
Fiddes and Yan demonstrated an RFID tag array, which utilised carbon black/polymer composites integrated into conventional RFID tags.19 As the carbon black/polymer composite swells in vapour, the distance between the carbon black changes resulting in a conductive change. The overall resistance of the tag changes, which causes a change in the signal frequency transmitted from the RFID tag to change. Each of the RFID tags has a different polymer as the sensing element, therefore producing a unique pattern of signals for each vapour. Nafion polymer electrolytes (co-polymer of tetrafluoroethylene and sulfonyl fluoride vinyl ether) have also been utilised in sensing vapours. Potyrailo and Morris coated conventional RFID tags with a thin layer of Nafion polymer electrolytes; the resistance and capacitance of this polymer layer changes in response to vapour absorption.20 Chemicapacitor systems have also been used as vapour sensors and have previously utilised the known swelling of PDMS in chemical vapour. Polymer-based capacitor sensors detect organic vapours through the absorption of vapour by the polymer, which results in variation of the polymer's permittivity leading to an overall change in capacitance of the sensor.21 However, the variance in the polymer's permittivity can be extremely subtle which has led to either the addition of highly conductive additives to PDMS22 or to measure the change in both permittivity (dielectric) and deformation of the polymer to increase sensitivity.23
We present a simple, low cost, wireless RFID sensor design that does not rely on capacitance variance, but takes advantage of the large physical deformation of PDMS elastomers when exposed to vapours using a displacement sensor design. RFID displacement sensors have previously been used in structural health monitoring24 in the place of using strain gauges. However, to our knowledge a displacement tag design has not been used in vapour sensing.
Experimental
Materials
Silanol-terminated polydimethylsiloxane (PDMS) (cSt 1000, Mw 26![[thin space (1/6-em)]](https://www.rsc.org/images/entities/char_2009.gif) 000) was obtained from Fluorochem Ltd. Tin(II) 2-ethylhexanaoate (95%) and tetraethyl orthosilicate (99%) were purchased from Sigma Aldrich. All the above chemicals were used as received. Acetone (lab grade), acetonitrile (HPLC grade), butan-1-ol (analytical grade), chlorobenzene (analytical grade), diethyl ether (analytical grade), ethanol (analytical grade), ethyl acetate (analytical grade), hexane (lab grade), methanol (analytical grade), methylene dichloride (HPLC grade), pentan-1-ol (analytical grade), propan-2-ol (analytical grade), tetrahydrofuran (HPLC grade), toluene (HPLC grade) and xylene (mixture of isomers with meta-xylene as the predominant isomer determined via1H NMR) (analytical grade) were purchased from Fisher Scientific and used as received.
000) was obtained from Fluorochem Ltd. Tin(II) 2-ethylhexanaoate (95%) and tetraethyl orthosilicate (99%) were purchased from Sigma Aldrich. All the above chemicals were used as received. Acetone (lab grade), acetonitrile (HPLC grade), butan-1-ol (analytical grade), chlorobenzene (analytical grade), diethyl ether (analytical grade), ethanol (analytical grade), ethyl acetate (analytical grade), hexane (lab grade), methanol (analytical grade), methylene dichloride (HPLC grade), pentan-1-ol (analytical grade), propan-2-ol (analytical grade), tetrahydrofuran (HPLC grade), toluene (HPLC grade) and xylene (mixture of isomers with meta-xylene as the predominant isomer determined via1H NMR) (analytical grade) were purchased from Fisher Scientific and used as received.
Synthesis of PDMS elastomers
Silanol-terminated PDMS (8.00 g, 3.08 × 10⁻⁴ mol), cross-linking agent tetraethyl orthosilicate (0.13 g, 6.24 × 10⁻⁴ mol) and catalyst tin(II) 2-ethylhexanoate (0.18 cm3, 1 M solution in toluene) were speed-mixed at 3500 rpm for 90 seconds in total. The mixture was poured into square moulds and allowed to cure at room temperature for 2 hours before being placed into an oven at 60 °C overnight. Homogenous mixing of the elastomer components was achieved using a DAC 150FV2-K speedmixer and elastomers were formed in PTFE square moulds (mould width = 2 cm, length = 2 cm and height = 0.2 cm).Swelling experiments
PDMS elastomers were placed in a saturated atmosphere of each solvent vapour for 72 hours. To achieve a saturated atmosphere, 25 cm3 of each solvent was poured into the bottom of a dessicator (internal seal diameter of 10.1 cm). The circular perforated shelf was placed back into the dessicator with a PDMS elastomer in a petri dish placed on top. The dessicator was sealed and at the end of 72 hours excess solvent was still present indicating a saturated atmosphere was achieved. The volume and weight of each PDMS elastomer was measured before and after solvent vapour exposure. To measure the extent of PDMS swelling, the volume swelling ratio (QV), defined as the ratio of the volume of swollen PDMS to its dry volume was calculated along with the weight swelling ratio (QW), defined as the ratio of the weight of swollen PDMS to its dry weight. The volume of the PDMS elastomers was measured using digital calipers (0–150 mm). PDMS swelling experiments for each solvent were performed three times in total.Absorption rate
Absorption rates of the PDMS elastomers were performed by placing the elastomers into a dessicator (internal seal diameter of 15.2 cm) with 50 cm3 of a chosen solvent for 24 hours. The PDMS elastomers were placed onto 1 mm square grid paper for scaling purposes and rather than the usual concave dessicator lid, a flat glass lid was used to seal the dessicator to ensure good visual of the elastomers. To measure the PDMS lateral swelling over 24 hours solvent vapour exposure, photographs of the PDMS elastomers were taken every 30 minutes from a height of 2.5 cm (distance between the dessicator lid and camera). ImageJ software was used to calculate the area of the elastomer from each photograph and the area swelling ratio (QA), defined as the ratio of the area of the swollen PDMS to its original area was calculated.RFID tag design
A folded dipole antenna with an inductive feed loop was designed to provide an input impedance which conjugately matched the tag transponder ASIC (Application Specific Integrated Circuit) RFID silicon chip (Higgs3 RFID chip provided by Alien Technology). CST Microwave Studio EM simulation software was used to tune the sensor response to European UHF RFID frequency (865.6–867.6 MHz) for maximum power transfer between the feed loop and the ASIC. The reader power required to activate the sensor tag at distanced in the un-swollen state is given by:25 | (1) |
 | (2) |
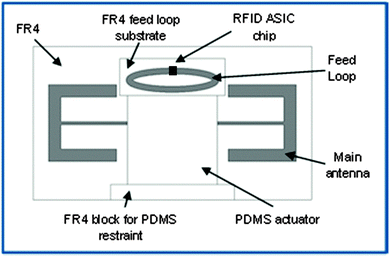
The RFID tag design is shown in Fig. 1 and the tag dimensions are shown in Fig. S1 and Table S1 (ESI†). The main body of the antenna and feed loop were etched from two square pieces of 0.8 mm thick copper cladded FR4 (fibreglass reinforced epoxy laminate) circuit board. The RFID ASIC silicon chip (Higgs3 RFID chip provided by Alien Technology) was soldered across the slot in the feed loop and the PDMS elastomer was supported by an FR4 block to restrict its movement in that direction.
RFID measurements
The RFID tag was placed into a dessicator (internal seal diameter of 15.2 cm) with 50 cm3 of a chosen solvent. The dessicator was sealed with a flat glass lid. The dessicator was placed at a fixed distance, 30 cm above the RFID reader antenna. The tag read range was measured with a Voyantic Tagformance life RFID characterization system (Voyantic Ltd, Finland) which measures the backscattered power for the tag as a function of calibrated transmit power. Measurements were taken over a period of 24 hours solvent vapour exposure at 21 °C. For each measurement, the transmit power from the reader was ramped from 0–26.5 dBm over the frequency range, 800–1000 MHz. This transmit power value is then used to calculate tag read range according to eqn (1) for a calibrated system using a calibration tag with known parameters to determine the losses in the system. This transmit power value is then compared to that obtained from a standard tag with known parameters to determine the losses in the system using eqn (1). The transmitted power required to activate the tag relates directly to the coupling efficiency between the main body of the antenna and the feed loop, which decreases as the expanded PDMS elastomer forces the feed loop away from the main body of the antenna.To describe RFID response we have calculated the transmitted power ratio, defined as the ratio of transmitted power (at 865 MHz) for the tag at a defined solvent vapour exposure time to the transmitted power (at 865 MHz) for 0 minute solvent vapour exposure.
Results and discussion
PDMS swelling
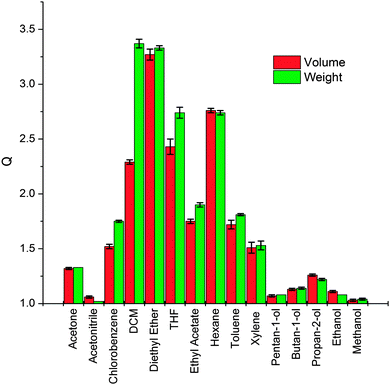
The PDMS elastomers were placed in a saturated atmosphere of each of the fifteen chosen solvent vapours for 72 hours, the long solvent exposure time was chosen to ensure the PDMS elastomers reached their maximum swelling. Fig. 2 shows the swelling ratio in terms of both weight and volume of the elastomers after vapour exposure. Each of the swelling experiments were performed a total of three times, the calculated standard errors (standard deviation of the mean) were small indicating our maximum swelling values of PDMS in each solvent vapour were reliable. Differences between QV and QW (Fig. 2) result from density differences between solvents (i.e. QV > QW for densities <1 g ml−1 and QV < QW for densities >1 g ml−1) and the absolute degree of swelling (i.e. differences between QV and QW are greater for those solvents with densities furthest from 1 and that absorb more solvent). Thus dichloromethane, which shows good swelling and possesses a high density shows the largest difference between QW and QV. Furthermore few if any, of these PDMS-solvent systems are expected to show ideal ‘solution’ behaviour which will mean that volume changes upon mixing will occur.27–29 A plot of the fractional difference between QV and QW with solvent densities is given in Fig. S9 (ESI†). The behaviour of all samples tested was reversible; after evaporation of the solvent from the PDMS the elastomers were observed to show identical swelling behaviour subsequently. However this was not tested extensively and currently forms the basis of ongoing research into tag design.We have focused on using the volume swelling ratio in further analysis as our RFID tag antenna relies on the lateral deformation of the substrate. However all results have been analysed on the basis of weight and moles absorbed (see Table S2, ESI†) and no significant deviation in behaviour from that described in the main text was observed. Generally PDMS elastomers showed a degree of vapour specificity with non-polar to weakly polar solvent vapours with ethers (diethyl ether and tetrahydrofuran), hexane and DCM causing the largest swelling, (QV > 2.0) and polar solvent vapours, alcohols (pentan-1-ol, butan-1-ol, propan-2-ol, ethanol and methanol) and acetonitrile causing the least swelling (QV = 1.0–1.3) as might reasonably be expected for PDMS.
Correlation between swelling and solubility parameters
Previous research investigated PDMS swelling by the direct absorption of solvents (liquid–solid interface) found the extent of swelling could be correlated with the Hildebrand solubility parameter (δ, cal1/2 cm−3/2). In the Hildebrand model, solubility can be related to the cohesive energy of the molecule.28,30| δ = (−E/V)1/2 | (3) |
As an extension of the Hildebrand method, Hansen suggested that the cohesive energy should be divided into three components: dispersion interactions (δd), dipolar interactions (δp) and hydrogen bonding interactions (δh).31,32 These three components are known as the Hansen solubility parameters (MPa1/2) and are additive:
| δt2 = δd2 + δp2 + δh2 | (4) |
 | (5) |
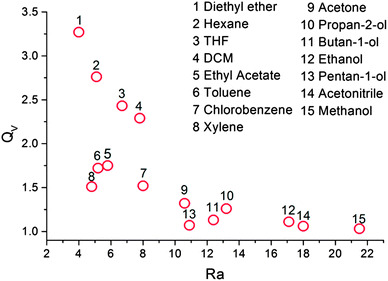 | ||
| Fig. 3 Swelling ratio versus Ra for each solvent. The numbers relate to the ranking of the solvents swelling ability. | ||
Henry's Law states the overall absorbed concentration of gas, C (maximum PDMS swelling in this case) is directly proportional to the partial pressure of the gas, P and solubility, S.
| C = SP | (6) |
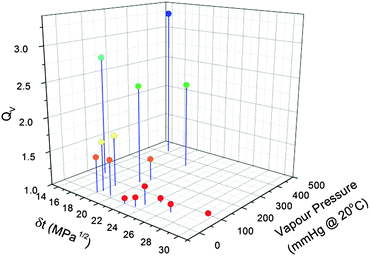 | ||
| Fig. 4 Swelling ratio versus the total Hansen solubility parameter and vapour pressure of each solvent. | ||
Two sets of variables were found to produce the best linear fits; Ra and vapour pressure (eqn (7)) and the Hansen solubility parameters and vapour pressure (eqn (8)).
| QV = a + bRa × Ra + bPvp × Pvp | (7) |
| QV = a + (bδd × δd) + (bδp × δp) + (bδh × δh) + (bPvp × Pvp) | (8) |
The predicted QV values calculated using eqn (6) were plotted against our measured values of QV as shown in Fig. 5. This predicted-measured plot was used to visually assess the prediction error for each of the predicted values and therefore how well the linear regression model fitted the data. A few outliers (deviations from the line) were noted, with the largest deviation from the line being THF and the other smaller two outliers being xylene and acetone. However, we found the linear regression model was a good fit as the majority of the predictions laid close to or directly on the linear fit line. This relationship enables us to gauge the extent of PDMS swelling by other solvent vapours.
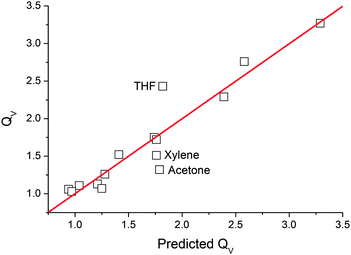 | ||
| Fig. 5 Measured volume swelling ratio versus predicted swelling ratio calculated using eqn (6). | ||
Vapour absorption rate/diffusion
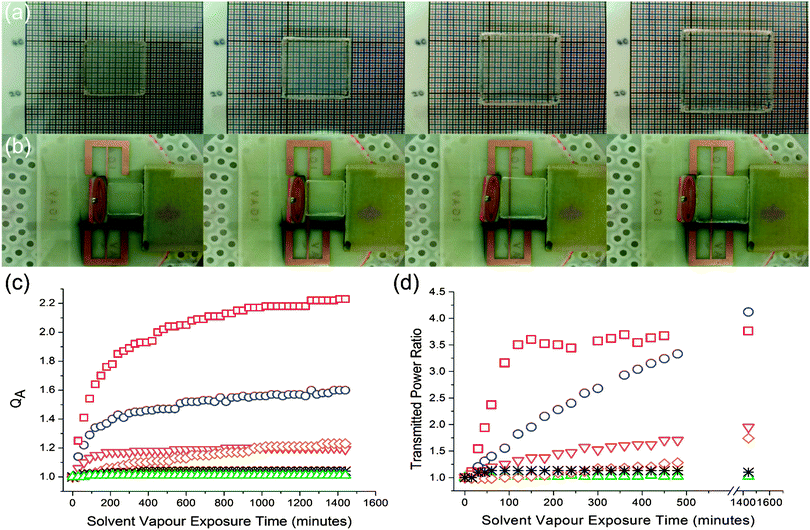
Absorption rate experiments were performed in 6 solvent vapours; 2 vapours that caused large PDMS swelling (diethyl ether and DCM), 2 vapours which caused mid-range PDMS swelling (acetone and xylene) and 2 vapours that caused small PDMS swelling (methanol and acetonitrile). To prevent continually removing the PDMS elastomers from the saturated vapour atmosphere for measurements, the area of the elastomer was measured rather than the volume. Fig. 6(c) shows the relationship between PDMS area swelling, QA and solvent vapour exposure time over a period of 24 hours. The curves best fit was achieved using a 2-phase exponential association model: | (9) |
Many diffusion processes through elastomeric polymers can be described by Fick's first law of diffusion:35
| J = −D(δc/δx) | (10) |
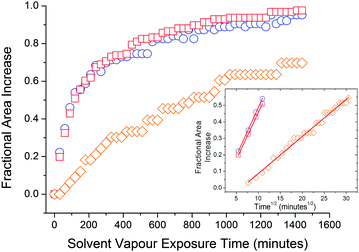 | ||
Fig. 7 Swelling kinetics for PDMS in  diethyl ether, diethyl ether,  DCM and DCM and  xylene. Inset figure shows the first 55% swelling data versus the square root of time. xylene. Inset figure shows the first 55% swelling data versus the square root of time. | ||
RFID measurements
RFID measurements were performed using six solvents in total: 2 high swelling solvents (diethyl ether and methylene dichloride), 2 middle swelling solvents (xylene and acetone) and 2 least swelling solvents (acetonitrile and methanol). The tag transmitted power was measured for 24 hours. Transmitted power (dBm) is the output energy from the RFID reader required to turn on the passive RFID tag. As the loop moves further away from the main antenna, the required power needed to power the RFID tag increases. Transmitted power ratio versus solvent vapour exposure time is shown in Fig. 6(d). Our RFID sensor is able to differentiate between solvent vapours as demonstrated by the varying magnitude of RFID response to each solvent vapour. As expected, the solvents that caused the largest PDMS swelling caused the largest increase in transmitted power and hence sensor response. The RFID sensor is limited by the distance displaced by the loop antenna; this is clearly seen by the plateau exhibited after 150 minutes of diethyl ether vapour exposure in Fig. 6(d). Once the tag requires around 3.5 times more power than the minimum it requires, the tag becomes less sensitive and can no longer monitor vapour exposure. RFID response is proportional to the degree of PDMS swelling at a particular time of solvent vapour exposure, and therefore the general identity of the organic vapour. Further tag design will enable reversibility to be built into the displacement arrangement.Conclusions
We have demonstrated that the swelling ratio of a PDMS network, based on volume change, QV, can be directly correlated with the Hansen solubility parameters, δd, δp and δh and the vapour pressures of the organic vapours employed. That the relative degree of swelling of a PDMS network in organic vapours is dependent upon the chemical and physical properties of the organic vapours in question is not surprising. Henry's law when applied to polymers has been known to relate concentration of gas absorbed to pressure and the solubility coefficient has been known for decades. However the use of Hansen solubility parameters as a guide to solubility in combination with vapour pressure (in this instance) allows for an easy guide to predict relative swelling of a polymer by a range of solvent vapours.We demonstrate a practical use for such PDMS networks in combination with an understanding of the relationship, is by using PDMS as a mechanical actuator in a prototype wireless RFID passive sensor. The swelling of the PDMS displaces a feed loop in the RFID sensor resulting in an increase in transmitted power, at a fixed distance.
Whilst the PDMS is not chemically specific in its absorption capability it shows a preference for non-polar and weakly polar solvents. In future work we will enable higher degrees of chemical specificity by introducing threshold limits into the sensor design (i.e. distance of actuator from the displacement component). Furthermore the polysiloxane component is highly amenable to chemical functionalization and a range of commercial polysiloxanes are available that retain high permeability but display different solubility parameters. The reversibility of the PDMS swelling will enable reversible wireless vapour sensing by future modification of the tag design. Future sensor design will use significantly smaller components through the use of printed antenna and smaller PDMS samples with differing solubility characteristics.
Acknowledgements
We wish to thank the EPSRC for funding this project (EP/L019868/1) and the University of Kent Faculty of Sciences for a PhD studentship for C. Rumens.Notes and references
- F. Abbasi, H. Mirzadeh and A. Katbab, Polym. Int., 2001, 50, 1279–1287 CrossRef CAS PubMed.
- S. J. Clarson, in Silicon-Containing Polymers, ed. R. G. Jones, W. Ando and J. Chojnowski, Springer, 2000, pp. 139–155 Search PubMed.
- P. R. Dvornic and R. W. Lenz, High Temperature Siloxane Elastomers, Wepf, 1990 Search PubMed.
- D. Graiver and G. Fearon, in Silicon-Containing Polymers, ed. R. G. Jones, W. Ando and J. Chojnowski, Springer, 2000, pp. 233–243 Search PubMed.
- J. E. Mark, Acc. Chem. Res., 2004, 37, 946–953 CrossRef CAS PubMed.
- S. Seethapathy and T. Górecki, Anal. Chim. Acta, 2012, 750, 48–62 CrossRef CAS PubMed.
- S. Balasubramanian and S. Panigrahi, Food Bioprocess Technol., 2011, 4, 1–26 CrossRef CAS.
- H. Kataoka, Anal. Sci., 2011, 27, 893 CrossRef CAS.
- A. Spietelun, M. Pilarczyk, A. Kloskowski and J. Namieśnik, Chem. Soc. Rev., 2010, 39, 4524–4537 RSC.
- Y. Huang, K. Choi and C. H. Hidrovo, Microelectron. Eng., 2014, 124, 66–75 CrossRef PubMed.
- B. Kim, L. Hong, Y. Chung, D. Kim and C. Lee, Adv. Funct. Mater., 2009, 19, 3796–3803 CrossRef CAS PubMed.
- J. N. Lee, C. Park and G. M. Whitesides, Anal. Chem., 2003, 75, 6544–6554 CrossRef CAS PubMed.
- J. Virtanen, F. Yang, L. Ukkonen, A. Elsherbeni, A. Babar and L. Sydänheimo, Sens. Rev., 2014, 34, 154–169 CrossRef.
- O. O. Rakibet, C. V. Rumens, J. C. Batchelor and S. J. Holder, IEEE Antenn. Wirel. Pr., 2014, 13, 814–817 CrossRef.
- A. Oprea, N. Barsan, U. Weimar, M. Bauersfeld, D. Ebling and J. Wöllenstein, Sens. Actuators, B, 2008, 132, 404–410 CrossRef CAS PubMed.
- R. A. Potyrailo, A. Burns, C. Surman, D. Lee and E. McGinniss, Analyst, 2012, 137, 2777–2781 RSC.
- R. A. Potyrailo, N. Nagraj, Z. Tang, F. J. Mondello, C. Surman and W. Morris, J. Agric. Food Chem., 2012, 60, 8535–8543 CrossRef CAS PubMed.
- R. A. Potyrailo, N. Nagraj, C. Surman, H. Boudries, H. Lai, J. M. Slocik, N. Kelley-Loughnane and R. R. Naik, TrAC, Trends Anal. Chem., 2012, 40, 133–145 CrossRef CAS PubMed.
- L. K. Fiddes and N. Yan, Sens. Actuators, B, 2013, 186, 817–823 CrossRef CAS PubMed.
- R. A. Potyrailo and W. G. Morris, Anal. Chem., 2007, 79, 45–51 CrossRef CAS PubMed.
- S. Patel, T. Mlsna, B. Fruhberger, E. Klaassen, S. Cemalovic and D. Baselt, Sens. Actuators, B, 2003, 96, 541–553 CrossRef CAS.
- S. Dissanayake, C. Vanlangenberg, S. V. Patel and T. Mlsna, Sens. Actuators, B, 2015, 206, 548–554 CrossRef CAS PubMed.
- U. Altenberend, A. Oprea, N. Barsan and U. Weimar, Anal. Bioanal. Chem., 2013, 405, 6445–6452 CrossRef CAS PubMed.
- M. J. Cazeca, J. Mead, J. Chen and R. Nagarajan, Sens. Actuators, A, 2013, 190, 197–202 CrossRef CAS PubMed.
- K. Finkenzeller, RFID Handbook, John Wiley & Sons, Ltd, 2010, pp. 61–154 Search PubMed.
- K. V. S. Rao, P. V. Nikitin and S. F. Lam, Automatic Identification Advanced Technologies, 2005. Fourth IEEE Workshop on, IEEE, 2005, pp. 39–42.
- A. F. Barton, Handbook of Polymer-Liquid Interaction Parameters and Solubility Parameters, CRC press, 1990 Search PubMed.
- A. F. Barton, Chem. Rev., 1975, 75, 731–753 CrossRef CAS.
- I. C. Sanchez and R. H. Lacombe, Macromolecules, 1978, 11, 1145–1156 CrossRef CAS.
- H. A. Benesi and J. Hildebrand, J. Am. Chem. Soc., 1949, 71, 2703–2707 CrossRef CAS.
- C. M. Hansen, Prog. Org. Coat., 2004, 51, 77–84 CrossRef CAS PubMed.
- C. M. Hansen, Hansen Solubility Parameters: A User's Handbook, CRC press, 2007 Search PubMed.
- T. Lindvig, M. L. Michelsen and G. M. Kontogeorgis, Fluid Phase Equilib., 2002, 203, 247–260 CrossRef CAS.
- M. Saleem, A. A. Asfour, D. De Kee and B. Harrison, J. Appl. Polym. Sci., 1989, 37, 617–625 CrossRef CAS PubMed.
- S. C. George and S. Thomas, Prog. Polym. Sci., 2001, 26, 985–1017 CrossRef CAS.
- P. K. Chatterjee and B. S. Gupta, Text. Sci. Technol., 2002, 13, 1–55 CAS.
- L. Masaro and X. Zhu, Prog. Polym. Sci., 1999, 24, 731–775 CrossRef CAS.
Footnotes |
| † Electronic supplementary information (ESI) available: RFID tag design and dimensions. Plot of moles of solvent vapour absorbed into elastomer after 72 hours exposure. Volume and weight swelling ratios, Hansen solubility parameters, Ra and Ranking for each solvent. Plots of Ra versus moles and QW. Plots of QV, QW and moles versus vapour pressure. 3D plots of δtvs. vapour pressure versus QW/moles. Details of linear regression analysis. See DOI: 10.1039/c5tc01927c |
| ‡ The plots obtained for acetonitrile, acetone and methanol could not be reliably used for this analysis due to either a limited number of data points in the initial swelling region and/or too high a degree of error associated with the measurement of area increase. |
| This journal is © The Royal Society of Chemistry 2015 |

