
 Open Access Article
 This Open Access Article is licensed under a
 Creative Commons Attribution 3.0 Unported Licence
Photoluminescence of CsMI3:Eu2+ (M = Mg, Ca, and Sr) – a spectroscopic probe on structural distortions
Markus
Suta
and
Claudia
Wickleder
*
Inorganic Chemistry, Faculty of Science and Engineering, University of Siegen, 57068 Siegen, Germany. E-mail: wickleder@chemie.uni-siegen.de; Fax: +49-271-740-2555; Tel: +49-271-740-4217
First published on 29th April 2015
Abstract
The photoluminescence of Eu2+ ions doped in iodidoperovskites, CsMI3 (M = Mg, Ca, Sr), was studied. Eu2+ occupies the alkaline earth site in each of these compounds. The emission spectra of the doped perovskites are characterized by 4f65d1 → 4f7 transitions of Eu2+ located in the yellow range for CsMgI3 and the blue range for CsCaI3 and CsSrI3, respectively. All excitation spectra provide a well-resolved fine structure arising from different 7FJ (J = 0,…,6) levels of the 4f6 core of the excited state configuration, indicating a weak exchange interaction with the 5d electron. The decay times and temperature dependence of the luminescence were also analyzed. Both CsMgI3:Eu2+ and CsSrI3:Eu2+ show a redshifted emission with respect to CsCaI3:Eu2+. This is explained by trigonal distortions of the [EuI6]4− octahedra in the former two compounds. The energetic order of the resulting crystal field states is justified in terms of the angular overlap model of ligand field theory. This series of Eu2+ doped earth alkaline iodidoperovskites may serve as a textbook example for the detailed understanding of the structure–luminescence relationships of Eu2+ ions, which is very important for tailoring functional materials for respective applications.
1. Introduction
The luminescence of Eu2+ has been a topic in many papers and reviews due to its broad-banded 4f–5d transitions that are parity allowed and thus interesting for many applications like, e.g. LEDs or detectors such as scintillators and X-ray storage phosphors. The nature of the 5d orbitals and their interaction with the local crystal field afford a systematic impact upon the emission color of the respective Eu2+-activated material. For example, in fluorides, such as CaF2 and SrF2, Eu2+ shows violet emission,1 whereas in KMgF3, the 5d states are located at higher energies such that 4f–4f line emission from the excited 6PJ and 6IJ states is also observed in the UV range.2,3 On the other hand, in nitridosilicates such as M3Si6O12N2:Eu2+ (M = Sr, Ba),4 M2Si5N8:Eu2+ (M = Ca, Sr, Ba)5 or MSi2O2N2:Eu2+ (M = Ca, Sr),6,7 Eu2+ shows yellow to orange luminescence. Further examples include Eu2+-activated CaS or SrS, showing a red emission.8 The examples mentioned above show how the luminescence of Eu2+ can be affected only by varying the composition of the host material. Interesting reviews that summarize and discuss the data of many of the Eu2+-activated compounds presented in the literature were published by Rubio9 and Dorenbos10 during the last two decades.Both for basic research and applications in high-energy radiation detection, halides are interesting host materials for Eu2+. As already described above, many of the studies presented in the literature have been attempted for fluorides, and chlorides have already been subject to many investigations. Unlike Eu2+-activated fluorides, however, the heavier halides only exhibit broad-banded 5d–4f emission in the violet to blue range due to the nephelauxetic effect shifting the position of the barycenter of the 4f65d1 states below the lowest excited 4f7 state. Moreover, crystal field splitting shifts the lowest 4f65d1 state yet to lower energies, as was indicated by Blasse.11 Typical examples from the literature are MZnCl4:Eu2+ (M = Sr, Ba), which emit at 402 nm and 396 nm, respectively.12 Similar to the results presented in this paper, Gahane et al. presented the optical properties of Eu2+ ions doped in the ternary chlorides CsMCl3 (M = Mg, Ca, Sr).13 Many other chlorides are presented in ref. 10 and references given therein.
The number of reported Eu2+-activated bromides, however, is already very small and mainly includes detailed investigations of the binary alkali and alkaline earth halides.10 More recently, however, several ternary bromides and iodides have attracted a lot of attention due to their potential application as scintillating materials. Typical examples for bromides as scintillators include CsCaBr3:Eu2+![[thin space (1/6-em)]](https://www.rsc.org/images/entities/char_2009.gif) 14 and CsSrBr3:Eu2+.15,16 A detailed analysis of the photoluminescence properties of Eu2+ in the series CsMBr3 (M = Mg, Ca, Sr) has been recently published by us.17 Their range of applicability of these materials is, however, limited due to their high sensitivity against moisture.
14 and CsSrBr3:Eu2+.15,16 A detailed analysis of the photoluminescence properties of Eu2+ in the series CsMBr3 (M = Mg, Ca, Sr) has been recently published by us.17 Their range of applicability of these materials is, however, limited due to their high sensitivity against moisture.
In contrast to the rest of the halides, the luminescence of Eu2+ doped in ternary iodides is currently only described in a superficial manner in the literature.10 Recently, the applicability of CsMI3 (M = Ca, Sr) as scintillators has been investigated and presented by the group of Melcher.18–21 Due to the higher covalence of Eu–I bonds compared to other halides, the 5d–4f emission is described to shift to lower energies and thus located in the blue or even bluish-green region.10 Since the iodides described in this paper mainly contain heavy ions, their applicability as scintillating materials seems absolutely plausible, as the previously mentioned publications also nicely illustrate. The higher doping concentrations of Eu2+ required for applications result in a loss of resolution of the spectra and thus do not allow a detailed analysis of the fine structure. These features are, however, important for a basic understanding of the structure–luminescence relationship. Another aim of this paper is to demonstrate the photoluminescence of Eu2+ doped in CsMgI3, which has not been presented so far in the literature.
To the best of our knowledge, no detailed analysis of the Eu2+-activated ternary iodides CsMI3 (M = Mg, Ca, Sr) with emphasis on the systematics of the photoluminescence properties in correlation with the structures and chemical compositions of these compounds has been attempted before. Moreover, it seems interesting to us to compare the properties of Eu2+ in iodides with those of the bromides of similar composition. Such an analysis is very important also from an application perspective as it allows the predictability and tunability of the photoluminescence properties of Eu2+ by distinct changes in the size of the site the Eu2+ ions occupy as well as in the structural features of a compound. This is not only interesting for scintillating materials but also very important for other applications such as in LED technology.
2. Experimental
2.1. Preparation
CsI (Merck, 99.5%) was dried at 200 °C in a dynamic vacuum in order to remove any traces of moisture. The anhydrous iodides MI2 (M = Ca, Sr) could be obtained by first dissolving the respective hydrates CaI2·4H2O (Acros Organics, 99%) and SrI2·xH2O (Heraeus, 99.5%) in concentrated HI (Acros Organics, 57 wt%) to remove traces of MCO3 (M = Ca, Sr) that may form upon standing of the hydrates in air. The thus obtained pure hydrates of the iodides were then dried in a dynamic vacuum at 200 °C to obtain pure anhydrous iodides. EuI2 was prepared from Eu2O3 (smart elements, 99.995%) using the ammonium iodide route in order to avoid any traces of moisture and oxygen.22 After slow decomposition at a heating rate of 4 °C h−1 of the thus prepared ternary compound (NH4)3EuI6·xH2O to 300 °C in a dynamic vacuum, EuI2 was directly obtained as a slightly yellowish powder. The phase purity of all starting materials was checked by X-ray powder diffraction (Siemens D5000, Cu Kα radiation).The doped ternary iodides CsMI3:Eu2+ (M = Ca, Sr) were prepared by fusing the respective starting materials CsI and MI2 (M = Ca, Sr) at their corresponding molar ratios together with 0.1 mol% EuI2 in sealed silica ampoules under vacuum using the Bridgman technique. For CsMgI3:Eu2+, CsI3 (Alfa Aesar, 98%), Mg metals (smart elements, 99.8%) and 0.1 mol% EuI2 were used as starting materials instead. All mixtures were heated at a rate of 20 °C h−1 to their respective melting points and kept in the melt for 36 h. The mixtures were then slowly recrystallized (2 °C h−1) to 100 °C below their melting points and finally cooled to room temperature at 10 °C h−1. The phase purity and crystallinity of the products were also verified by X-ray powder diffraction (see Fig. 1). Due to the hygroscopic nature and sensitivity to oxygen of all the previously described compounds, every step had to be performed under a dry Ar atmosphere using a glove box (Braun).
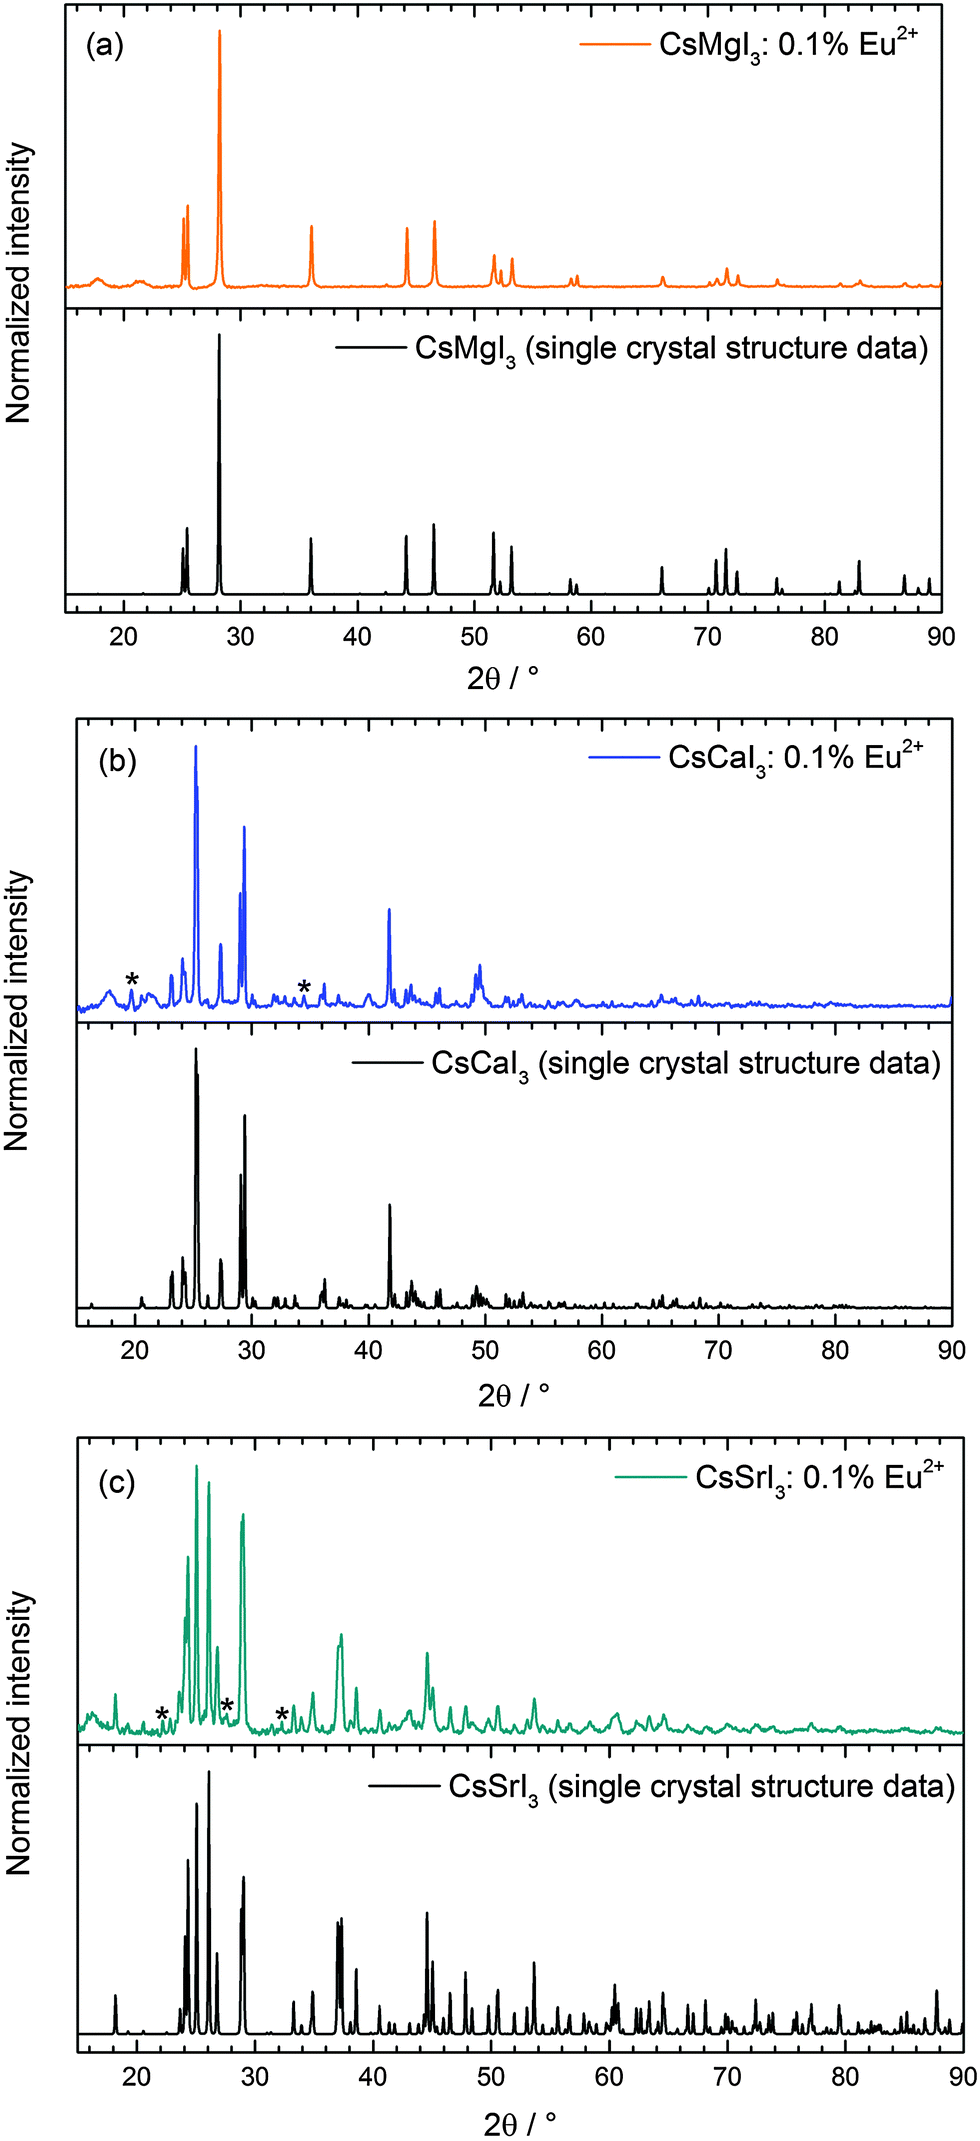 | ||
| Fig. 1 Measured X-ray powder diffraction patterns of (a) CsMgI3:0.1% Eu2+, (b) CsCaI3:0.1% Eu2+ and (c) CsSrI3:0.1% Eu2+ in comparison to the respective patterns according to the literature.23,24 The marked references denote the in situ formation of hydrates during the XRD measurements. | ||
2.2. Optical measurements
Photoluminescence emission and excitation spectra were obtained using a Fluorolog3 spectrofluorometer (Jobin Yvon) equipped with a 450 W xenon lamp and double Czerny–Turner monochromators allowing a resolution down to 0.05 nm and a photomultiplier detection system R928P (Hamamatsu) coupled with a photon counting system. A liquid helium closed-cycle cryostat was used to perform temperature-dependent measurements at 10 K. The emission spectra were corrected for photomultiplier sensitivity and the excitation spectra were corrected for lamp intensity. For decay time measurements, a frequency-tripled Nd:YAG laser (Spectra Physics Quanta Ray Indi 40) with a repetition rate of 10 Hz and a pulse width of 8 ns was used (λex = 355 nm). For the detection of the desired emission wavelength, a single monochromator (Jobin Yvon) was employed that allows a resolution down to 5 nm. The decay signal was recorded using a photomultiplier tube that was attached to an oscilloscope (Tektronix, 500 kHz).3. Results
3.1. Crystal structures and coordination spheres of CsMI3 host lattices (M = Mg, Ca, Sr)
The crystal structures of all iodides presented in this paper can be derived from the perovskite structure and have already been described in the literature.23,24 The measured powder diffraction patterns are depicted in Fig. 1 and indicate the phase purity of the synthesized compounds. Due to the fact that the XRD measurements could not be performed without the total exclusion of air, some other reflections reveal an increase in intensity after every subsequent measurement on the same samples. These reflections can be assigned to the in situ formation of hydrates of the respective iodides due to their hygroscopic nature in air. Moreover, all XRD patterns reveal the presence of broad reflections in the range between 2θ = 15° and 22°, which is an artifact due to the fixation of the powders with silicon grease. No effects of doping with EuI2 can be detected as it is expected due to the very low concentration of only 0.1 mol% that is below the sensitivity limit of the XRD device. Hence, no change in the crystal structures of the three iodides is induced by doping of EuI2.The symmetry data and average M–I distances (M = Mg, Ca, Sr) important for the discussion of the luminescence spectra are summarized in Table 1.
| Compound | Local site symmetry of M2+ site | Average M–I distance/Å |
|---|---|---|
| CsMgI3 | D 3d | 2.90 |
| CsCaI3 | C i | 3.10 |
| CsSrI3 | C 2h | 3.37 |
CsMgI3 crystallizes in the CsNiCl3 structure type, which is a hexagonally distorted variation of the perovskite type structure with the space group P63/mmc (no. 194).23 The average Mg–I distance is 2.90 Å and the structure is depicted in Fig. 2. The Cs+ ions are 12-fold coordinated by I− ions in the form of anti-cuboctahedra whereas the Mg2+ ions are six-fold coordinated in the form of octahedra. The local site symmetry of D3d (see Table 1), however, already indicates a severe trigonal distortion. This is induced by the face-sharing pattern of the [MgI6]4− octahedra that form linear chains along the c axis and lead to a high anisotropy of the crystal structure. The effect of anisotropy on the photoluminescence properties of Eu2+ has already been discussed in the isostructural compound CsCdBr3.25,26
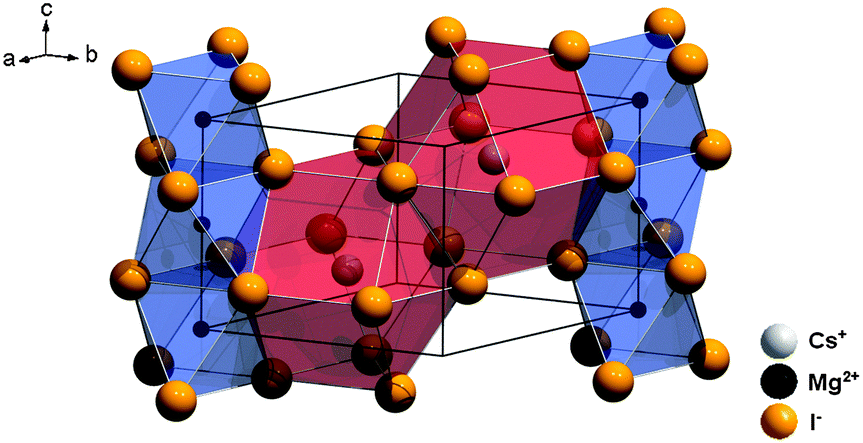 | ||
| Fig. 2 Representation of the crystal structure of CsMgI3 indicating the anisotropy due to the face-sharing [MgI6]4− octahedra along the hexagonal c axis.23 | ||
CsCaI3 crystallizes in the orthorhombic GdFeO3 structure type with the space group Pnma (no. 62) and is isostructural to CsSrBr324 (see Fig. 3). The average Ca–I distance is 3.10 Å. The Cs+ ions are (8+2)-fold coordinated by I− ions and the Ca2+ ions are six-fold coordinated by I− ions in the form of tilted octahedra along the c axis with local Ci symmetry (see Table 1). However, the deviation from octahedral symmetry can be assumed to be small, which is a reasonable basis for our interpretation of the luminescence spectra (see Section 4.2).
 | ||
| Fig. 3 Representation of the crystal structure of CsCaI3 with emphasis on the slightly tilted [CaI6]4− octahedra.24 | ||
CsSrI3 crystallizes in a filled PuBr3 structure type, which is characterized by an orthorhombic crystal structure with the space group Cmcm (no. 63)24 and is depicted in Fig. 4. In this structure, the Cs+ ions are only 8-fold coordinated by I− ions in the form of two-fold capped trigonal prisms. The Sr2+ ions are six-fold coordinated in the form of tilted octahedra along the c axis with local C2h symmetry (see Table 1). The average Sr–I distance is 3.37 Å in this compound.
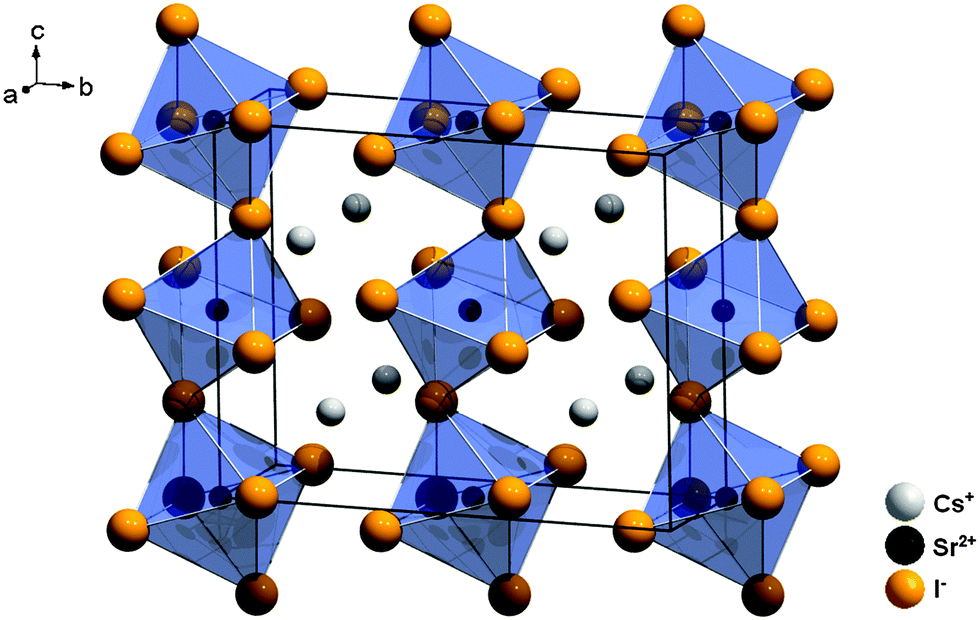 | ||
| Fig. 4 Representation of the crystal structure of CsSrI3 with indication of the large disposal of the [SrI6]4− octahedra.24 | ||
With regard to different structures, a remarkable development can be noted as the distortion of the [MI6]4− octahedra (M = Mg, Ca, Sr) increases in the series CsCaI3 < CsSrI3 < CsMgI3 and ends in a face-sharing pattern of the octahedra in CsMgI3. Along with this development, the deviation from a perfect octahedral environment for Eu2+ in these three compounds also increases and trigonal distortion has to be taken more into account. We will review this aspect in Section 4.
3.2. Photoluminescence of CsMI3:0.1%Eu2+ (M = Mg, Ca, and Sr)
The Eu2+-activated iodides presented in this paper show a bright luminescence upon UV excitation at room temperature, which is the blue region for CsCaI3:Eu2+ and CsSrI3:Eu2+ and greenish-yellow in the case of CsMgI3:Eu2+. For all three materials, the transitions can be interpreted with the fact that the Eu2+ ions occupy exclusively the respective alkaline earth sites. For the respective Eu2+-activated bromides CsMBr3 (M = Mg, Ca, and Sr),17 we have introduced several energetic values based on the notation and definitions of Dorenbos that afford a more detailed picture of the electronic states of Eu2+ in the respective compounds.10,27,28 We will also use this notation in this paper.3.3. CsMgI3
CsMgI3:0.1% Eu2+ shows a bright yellow luminescence upon UV excitation at room temperature. Low temperature luminescence spectra as well as a photograph of the luminescent sample at room temperature are shown in Fig. 5. To the best of our knowledge, no luminescence properties of Eu2+-activated CsMgI3 have been reported so far. The emission spectrum at 10 K is characterized by a broad asymmetric Gaussian band with a maximum localized at 17330 cm−1 (577 nm). The full width at half maximum of Γ10K = 2430 cm−1 is relatively large, indicating a strong electron–phonon coupling. The emission band can be assigned to 4f65d1(t2g) → 4f7(8S7/2) transitions of Eu2+ substituting for Mg2+ ions assuming Oh site symmetry for a first approximation. To a certain extent, the asymmetry of the band can be understood from the large difference in the ionic radii between Eu2+ and Mg2+(r(Eu2+) = 1.17 Å and r(Mg2+) = 0.72 Å).29 Although the occupation of the Cs+ site may also be plausible (r(Cs+) = 1.88 Å),29 it can be excluded due to the fact that the coordination number is much higher. This would lead to a highly blue-shifted emission and is well established in the scintillator CsI:Eu2+, where the coordination number of the Cs+ sites is 8 and the respective Eu2+ emission is already located at 22470 cm−1 (445 nm).30 Moreover, we performed EXAFS measurements on the Eu2+-doped isostructural compounds CsMgCl3 and CsMgBr3, which we will publish in another paper. The measurements definitely prove the sole occupation of the Mg2+ sites at concentrations below 3%.
 | ||
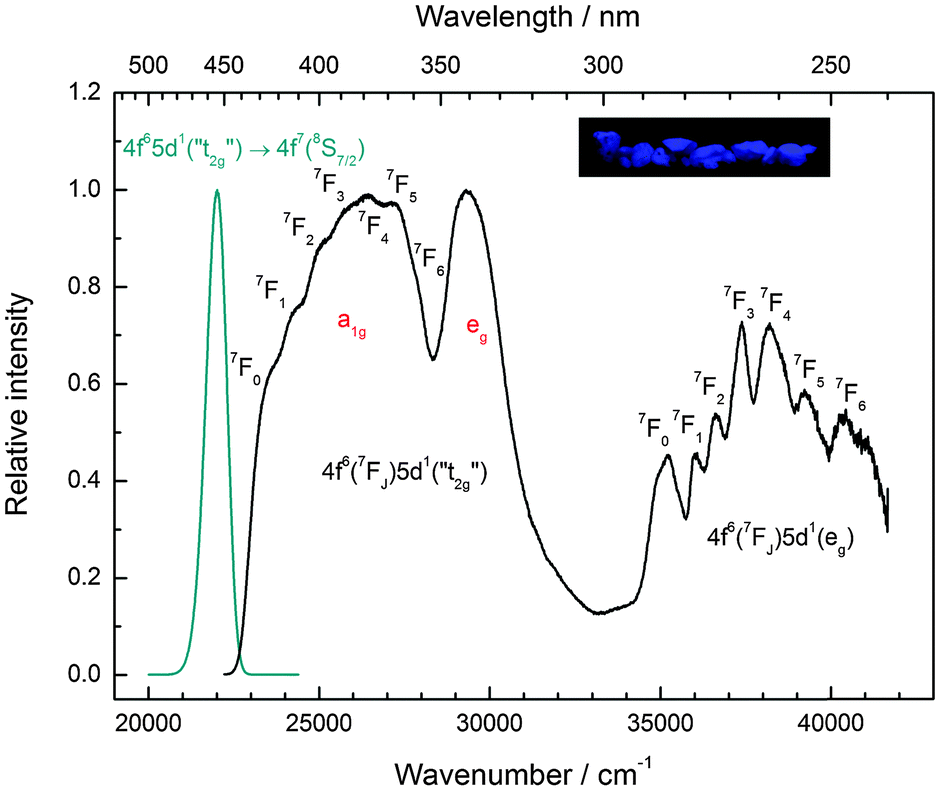
| Fig. 5 Emission (orange line, Eex = 24390 cm−1) and excitation spectrum (black line, Eem = 18020 cm−1) of CsMgI3:0.1% Eu2+ at 10 K. Note the splitting of the anticipated “t2g” state into the trigonal field states a1g and eg. Inset: CsMgI3:0.1% Eu2+ showing yellow luminescence upon UV irradiation at room temperature. | ||
The assumption of octahedral site symmetry for the Eu2+ ions serves well for a crude interpretation of the luminescence spectra. However, as we will show below, for a more detailed interpretation of the electronic properties of Eu2+ in this compound, this approximation is indeed too simplified.
The excitation spectrum of CsMgI3:0.1% Eu2+ at 10 K, as shown in Fig. 5, is characterized by two broad bands that contain a detailed fine structure. Their presence is easily understood from the splitting of the 5d orbitals in an octahedral crystal field that gives rise to a “t2g” and an eg state, the latter being located at higher energy. We marked the t2g state with quotation marks since the assumption of Oh symmetry for Eu2+ is too simplified in this case, as we will explain below. The fine structure arises due to the remaining 4f6 core in the excited state configuration of Eu2+ and can be identified with the different 7FJ states (J = 0,…,6). Interestingly, the fine structure is also observable in the eg excitation band. This observation has so far been only reported for the binary alkali halides31 and Eu2+-activated CsMBr3,17 but not in the case of other host lattices. It indicates a weak exchange interaction between the 4f electrons and the 5d electron in the excited state32 and becomes much less resolved at room temperature. The positions of the different 7FJ states are compiled in Table 2 and their position relative to the 7F0 state fits well with the values anticipated from Eu3+.33 The good resolution of the different 7FJ states allows a relatively precise determination of the Stokes shift ΔS(2+,CsMgI3) = 3870 cm−1.
| 4f6(7FJ)5d1(t2g) | 4f6(7FJ)5d1(eg) | ||||
|---|---|---|---|---|---|
| State 7FJ | Position/cm−1 | ΔEJ–0/cm−1 | State 7FJ | Position/cm−1 | ΔEJ–0/cm−1 |
| 7F0 | 21200 |
0 | 7F0 | 35240 |
0 |
| 7F1 | 21700 |
500 | 7F1 | 36050 |
810 |
| 7F2 | 22500 |
1300 | 7F2 | 36540 |
1300 |
| 7F3 | 23170 |
1970 | 7F3 | 37310 |
2070 |
| 7F4 | 24160 |
2960 | 7F4 | 38430 |
3190 |
| 7F5 | 25240 |
4040 | 7F5 | 39290 |
4050 |
| 7F6 | 26280 |
5080 | 7F6 | 40600 |
5360 |
A detailed observation on the excitation spectrum of the Eu2+-related emission depicted in Fig. 5 reveals the presence of another band located at 27770 cm−1 (360 nm). This remarkable feature has already been observed in Eu2+-activated isostructural compounds such as CsCdBr325,26 and CsMgBr3.17 As we have already indicated in Section 3.1, this can be understood if trigonal distortion of Oh to D3d symmetry (see Table 1) is taken into account leading to a splitting of the anticipated “t2g” state into an a1g and an eg state. Due to that reason, we will mark the anticipated octahedral field state “t2g” with quotation marks throughout this paper. More conclusions from this effect, e.g. the given energetic order of the a1g and the eg state, will be discussed in Section 4.2. The energetic difference between the a1g and the eg state is the trigonal crystal field splitting, εtrig(7,2+,CsMgI3) = 4310 cm−1.
3.4. CsCaI3
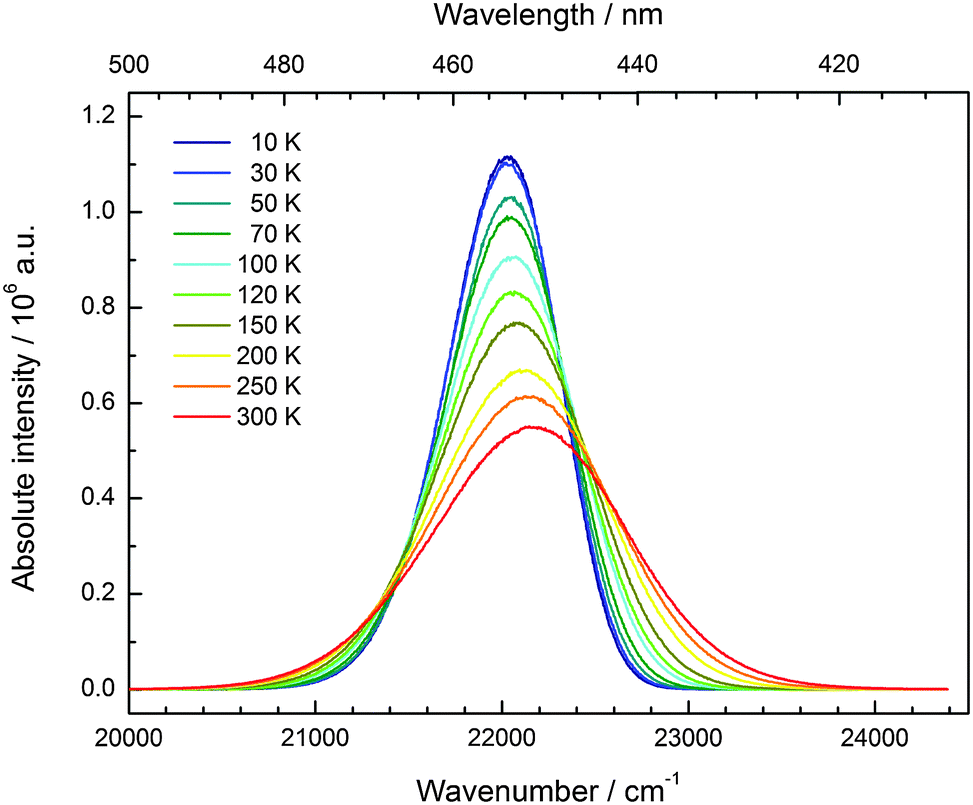
CsCaI3:0.1% Eu2+ is characterized by strong blue luminescence upon UV irradiation at room temperature. Fig. 6 depicts the low temperature luminescence spectra as well as a photograph of the luminescent sample at room temperature. It has been recently reported that Eu2+-activated CsCaI3 is a promising scintillator with a light output comparable to NaI:Tl+.18,19 The emission shows a slightly asymmetric Gaussian band peaking at 22370 cm−1 (447 nm), which is in very good agreement with the value reported in the literature (450 nm).18 The full width at half maximum amounts to Γ10K = 640 cm−1. The emission can be clearly identified by the 4f65d1(t2g) → 4f7(8S7/2) transition of Eu2+ substituting for Ca2+ ions under the assumption of an approximate octahedral site symmetry. The difference in ionic radii (r(Eu2+) = 1.17 Å and r(Ca2+) = 1.00 Å)29 explains the observed asymmetry of the Gaussian band.
 | ||
| Fig. 6 Emission (blue line, Eex = 25640 cm−1) and excitation spectrum (black line, Eem = 22470 cm−1) of CsCaI3:0.1% Eu2+ at 10 K. Inset: CsCaI3:0.1% Eu2+ showing blue luminescence upon UV irradiation at room temperature. | ||
A distinct fine structure is observed in the excitation spectra arising due to the different 7FJ states from the 4f6 core. As there are only two broad bands observed in the excitation spectrum, the assumption of an octahedral environment for Eu2+ seems legitimate, giving rise to a t2g and an eg state. Similar to CsMgI3:Eu2+ (see Fig. 5), the fine structure is also observable in the eg state. This indicates, again, a weak exchange interaction between the 4f6 electrons and the 5d electron.32 The positions of the different 7FJ levels are compiled in Table 3. Within the experimental error, they are in good agreement with the values expected from the respective energies known from Eu3+.33
| 4f6(7FJ)5d1(t2g) | 4f6(7FJ)5d1(eg) | ||||
|---|---|---|---|---|---|
| State 7FJ | Position/cm−1 | ΔEJ–0/cm−1 | State 7FJ | Position/cm−1 | ΔEJ–0/cm−1 |
| 7F0 | 23680 |
0 | 7F0 | 34970 |
0 |
| 7F1 | 24350 |
670 | 7F1 | 35600 |
630 |
| 7F2 | 24940 |
1260 | 7F2 | 36230 |
1260 |
| 7F3 | 26050 |
2370 | 7F3 | 36990 |
2020 |
| 7F4 | 27230 |
3550 | 7F4 | 37860 |
2890 |
| 7F5 | 27790 |
4110 | 7F5 | 38980 |
4010 |
| 7F6 | 29050 |
5370 | 7F6 | 39810 |
4840 |
Due to the well-resolved fine structure, it is also possible to determine the Stokes shift accurately, which is ΔS(2+,CsCaI3) = 1310 cm−1. The octahedral crystal field splitting, 10 Dq, can be also determined and is given by εcfs(7,2+,CsCaI3) = 11050 cm−1 using the nomenclature used by Dorenbos.10
3.5. CsSrI3
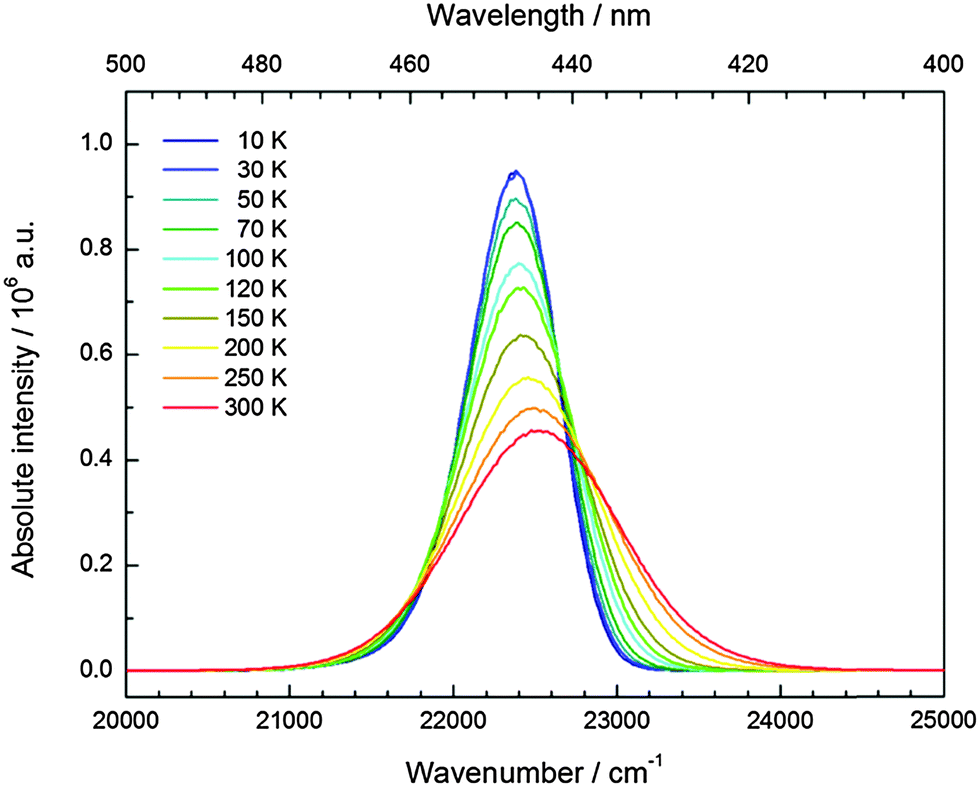
Similar to Eu2+-activated CsCaI3, CsSrI3:0.1% Eu2+ shows blue luminescence upon excitation with UV light at room temperature. The luminescence spectra at 10 K and a photograph of the luminescent sample are shown in Fig. 7. Similar to CsCaI3, Eu2+-activated CsSrI3 also shows efficient radioluminescence and is thus a promising candidate for scintillation materials.20,21 The emission band arising from the 4f65d1 → 4f7(8S7/2) transition is an almost perfect Gaussian band with a maximum at 22010 cm−1 (454 nm). The value is in very good agreement with the value found in the literature (452 nm).20 The full width at half maximum is slightly larger than that in the case of CsCaI3 and given by Γ10K = 710 cm−1. However, the slight asymmetry cannot be explained by a mismatch between the ionic radii of Eu2+ and Sr2+ in this case, as they are almost equal (r(Eu2+) = 1.17 Å, r(Sr2+) = 1.18 Å).29 Moreover, it turns out that the emission is slightly redshifted to the 5d–4f emission of Eu2+ in CsCaI3, which does not correspond to the expectation when considering the decrease of the ionic radii from Ca2+ to Sr2+ and in turn the weaker crystal field splitting.
 | ||
| Fig. 7 Emission spectrum (cyan line, Eex = 25000 cm−1) and excitation spectrum (black line, Eem = 21980 cm−1) of CsSrI3:0.1% Eu2+ at 10 K. Note the splitting of the anticipated “t2g” state into the trigonal field states a1g and eg. Inset: CsSrI3:0.1% Eu2+ showing blue luminescence upon UV irradiation at room temperature. | ||
As for the other iodides, the fine structure due to the different 7FJ levels is also observed in CsSrI3 in all excitation bands (see Table 4 for their positions). The agreement with the values reported for Eu3+ is also satisfactory.33 The Stokes shift determined thereof reads ΔS(2+,CsSrI3) = 1090 cm−1.
| 4f6(7FJ)5d1(“t2g”) | 4f6(7FJ)5d1(eg) | ||||
|---|---|---|---|---|---|
| State 7FJ | Position/cm−1 | ΔEJ–0/cm−1 | State 7FJ | Position/cm−1 | ΔEJ–0/cm−1 |
| 7F0 | 23100 |
0 | 7F0 | 35300 |
0 |
| 7F1 | 23610 |
510 | 7F1 | 35980 |
680 |
| 7F2 | 24350 |
1250 | 7F2 | 36610 |
1310 |
| 7F3 | 25070 |
1970 | 7F3 | 37410 |
2110 |
| 7F4 | 26190 |
3090 | 7F4 | 38180 |
2880 |
| 7F5 | 27300 |
4200 | 7F5 | 39260 |
3960 |
| 7 F 6 | 27930 |
4830 | 7 F 6 | 40440 |
5140 |
However, similar to the case of CsMgI3:0.1% Eu2+ (cf.Fig. 5), another isolated band can be observed at 29320 cm−1 (341 nm). This indicates a similarity of the site symmetry for the Eu2+ ions in CsSrI3 compared to CsMgI3. The larger disposal of the [SrI6]− octahedra with respect to CsCaI3 (see Fig. 3 and 4) thus seems to induce a trigonal distortion resulting in the sub site symmetry D3d to first order. The subsequent symmetry distortion to the real site symmetry C2h is assumed to be very weak and thus will be neglected for our considerations. With the assumption of D3d as the site symmetry for the Eu2+ ions in CsSrI3, the appearance of another isolated band in the excitation spectrum (see Fig. 7) seems plausible, leading to the splitting of the anticipated “t2g” state into an a1g and an eg state. The excited eg state retains its degeneracy. We will justify the order of the states a1g and eg shown in Fig. 7 in Section 4.2. From this interpretation, it is possible to deduce the trigonal crystal field splitting in CsSrI3 given by εtrig(7,2+,CsSrI3) = 3960 cm−1.
3.6. Temperature-dependent emission
The temperature dependence of the 5d–4f emission of Eu2+ in the series CsMI3 (M = Mg, Ca, Sr) was also investigated. The respective emission spectra are depicted in Fig. 8–10. In all three compounds, Eu2+ shows an intense luminescence even at room temperature and a slight blueshift with increasing temperature is observed. In the case of CsMgI3:0.1% Eu2+ (see Fig. 8), an asymmetric wing of the emission on the red side of the spectrum evolves with increasing temperature. All these observations agree with the behavior we have already reported for the respective bromides.17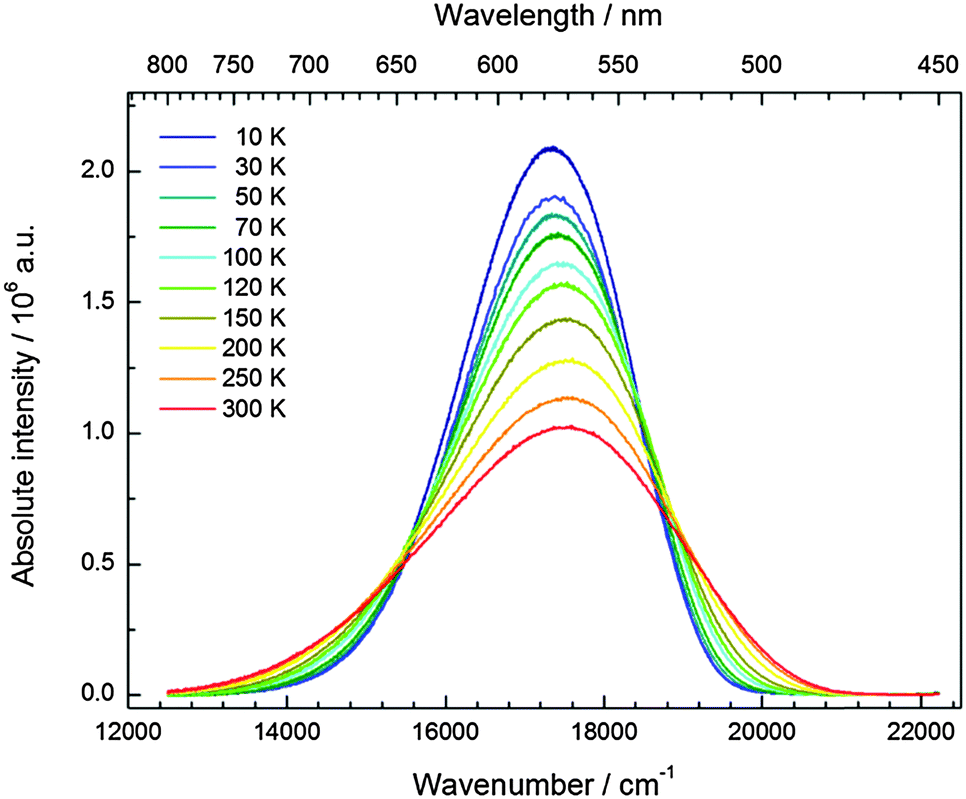 | ||
| Fig. 8 Temperature-dependent emission spectra (Eex = 24390 cm−1) of CsMgI3:0.1% Eu2+. | ||
 | ||
| Fig. 9 Temperature-dependent emission spectra (Eex = 25640 cm−1) of CsCaI3:0.1% Eu2+. | ||
 | ||
| Fig. 10 Temperature-dependent emission spectra (Eex = 25000 cm−1) of CsSrI3:0.1% Eu2+. | ||
In Fig. 11, the evolution of the integrated intensities with increasing temperature is depicted. For all three compounds the photoluminescence signal is slightly quenched with higher temperatures. In fact, the integrated intensities of the emission of Eu2+ in CsCaI3 and CsSrI3 decrease to only 88% and 85% of the initial value when heated to 300 K, whereas in the case of CsMgI3:0.1% Eu2+, it decreases to 71%. This indicates that the quenching temperature T1/2, at which the integrated intensity has reached 50% of the maximum signal, is well above 300 K in all three doped compounds. Unfortunately, we could not perform comparable measurements above 300 K so we are only able to state this about the quenching temperature. In fact, the low Stokes shifts for Eu2+ in these compounds and very low phonon energies in iodides (below 200 cm−1)34 make non-radiative transitions very inefficient and a weak electron–phonon coupling should be expected. This behavior is clearly observed in Fig. 11.
 | ||
| Fig. 11 Evolution of the integrated intensities of the 5d–4f emission of Eu2+ ions doped in the iodides CsMI3 (M = Mg, Ca, and Sr). | ||
3.7. Decay times
The decay curves of the luminescence signal of Eu2+ in CsMI3 (M = Mg, Ca, Sr) are depicted in Fig. 12. They were recorded upon excitation into the “t2g” states (λex = 355 nm) at room temperature. All decay curves show a mono-exponential behavior in the recorded time range. Since the luminescence is also not highly quenched at room temperature (see Section 3.3), it may also be assumed that the shortening of the decay time of Eu2+ by phonons is relatively small and, thus, a good estimate of the radiative lifetime is obtained by the room temperature measurements. Their values are compiled in Table 5.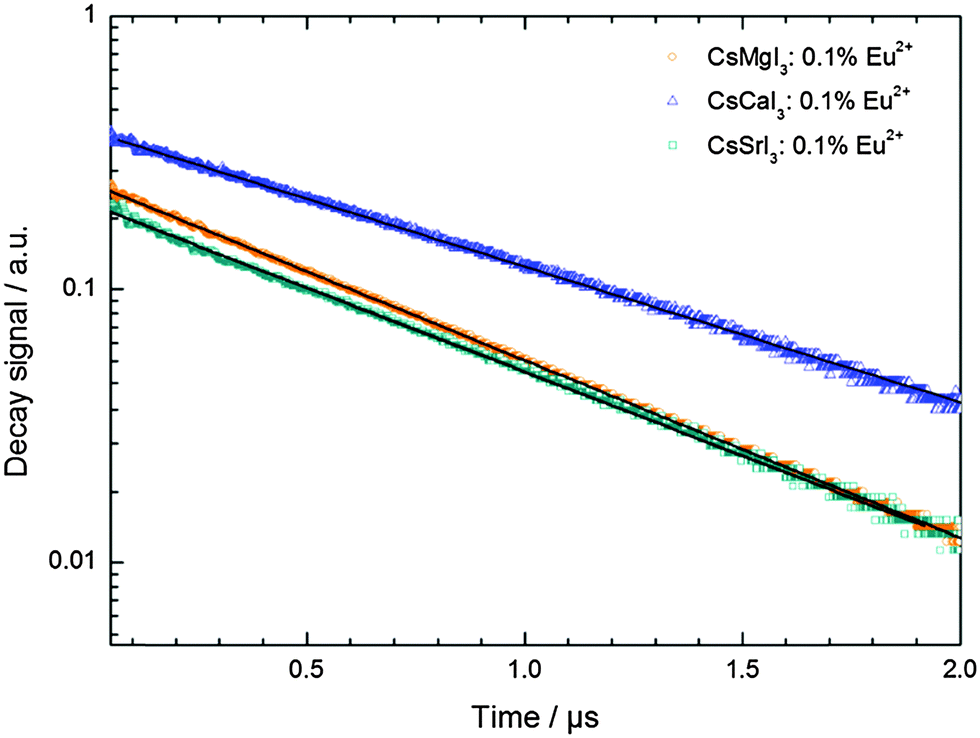 | ||
| Fig. 12 Semi-log plot of the decay curves of CsMI3:0.1% Eu2+ obtained upon excitation into the “t2g” state (λex = 355 nm) at room temperature. The solid black lines indicate exponential fits to the respective data. | ||
| Compound | Decay time/ns | Radial integral |〈5d|r|4f〉|/Å |
|---|---|---|
| CsMgI3:Eu2+ | 667 | 1.03 |
| CsCaI3:Eu2 | 875 | 0.50 |
| CsSrI3:Eu2 | 707 | 0.70 |
From the decay times, it is possible to obtain direct information about the electric dipole matrix element μ5d→4f, since
| μ5d→4f = −e·|〈5d|r|4f〉| | (1) |
 | (2) |
 | (3) |
4. Discussion
4.1. Photoluminescence of Eu2+ doped in CsMI3 (M = Mg, Ca, Sr)
Eu2+ shows very intense luminescence in the series CsMI3 (M = Mg, Ca, Sr), which goes from blue in CsCaI3 and CsSrI3 to yellow in CsMgI3. The important luminescence data obtained from the spectra presented in Section 3 are compiled in Table 6. As previously mentioned, all important equations to derive the respective values have already been described by us in another publication and can be found in the literature.17 However, similar to the case of the respective bromides,17 a fine structure due to the 7FJ states (J = 0,…,6) arising from the 4f6 core in the excited 4f65d1 state can be observed in the crystal field states “t2g” and eg. This clearly indicates that the exchange interaction between the 5d electron and the other six 4f electrons is very small.32 Other conditions of such observations are high site symmetries, good crystal quality, low dopant concentrations and low temperature measurements.27 Examples, in which Eu2+ is also known to exhibit well-resolved excitation spectra with such a fine structure, include Sr3(PO4)2,37 Ba2B5O9Br38 and binary alkali halides.31 As the fine structure seems to be very well resolved even in the eg state, which was so far only known for the alkali bromides and iodides,31 we also presume that covalence of the bond between Eu2+ and the respective (halide) anions has an important effect upon the strength of the exchange interaction. This makes sense since a higher covalence exhibits a larger nephelauxetic effect and thus leads to a larger energy gap between the excited 4f states and 5d states inhibiting an admixture. Therefore, the exchange interaction will be small as well as the radiative lifetimes will be lowered. Both effects are indeed observed for the system CsMI3 (M = Mg, Ca, Sr).| CsMI3 |
|
|
E em | D | ΔS | Γ 10K |
|---|---|---|---|---|---|---|
| CsMgI3 | 21200 |
35240 |
17330 |
12800 |
3870 | 2430 |
| CsCaI3 | 23680 |
34970 |
22370 |
10320 |
1310 | 640 |
| CsSrI3 | 23100 |
35300 |
22010 |
10900 |
1090 | 710 |
Since the covalence of the Eu–I bonds in these compounds should not vary very much, it may be assumed that the bond length and, thus, the size of the alkaline earth site are the most important factors in this case which influence the luminescence properties. As we will show below, this approximation is, however, too crude for CsMgI3 and CsSrI3.
We also attempted to analyze the emission energies Eem(7,2+,A) and the positions of the 7F0 levels within the “t2g” and eg states, denoted as  and
and  , respectively, with respect to the difference in the ionic radii between Eu2+ and the respective alkaline earth ion M2+ (M = Mg, Ca, Sr). The plots are illustrated in Fig. 13.
 | ||
Fig. 13 Variation of the emission energies Eem(7,2+,A) and the energies of the 7F0 level within the hypothetical “t2g” and eg states,  and and  , with the difference in Shannon radii ΔR between Eu2+ and the alkaline earth ion in CsMI3 (M = Mg, Ca, and Sr).29 , with the difference in Shannon radii ΔR between Eu2+ and the alkaline earth ion in CsMI3 (M = Mg, Ca, and Sr).29 | ||
The curves shown in Fig. 13 nicely illustrate the nature of the different states and indicate the impact of the crystal structure upon the photoluminescence properties of Eu2+ in iodidoperovskites. Since the behavior of the emission energies and the excitation energies of the “t2g” states is strikingly similar, it can be directly concluded that emission occurs from the lowest excited hypothetical “t2g” state. It turns out for Eu2+-activated CsMgI3 and CsSrI3 that both the energy of the “t2g” states and the emission energy are lower than those in the case of CsCaI3. The energies of the eg state, however, remain relatively constant with respect to changes in the size of the alkaline earth site. This observation does not agree with the naive expectation that it should increase with decreasing Eu–I bond length due to the anti-bonding nature of the eg state as it was observed in the respective bromidoperovskites.17 This behavior can, however, be understood taking into account the large bond length between Eu2+ and I−, which would be 3.37 Å according to the sum of the Shannon radii at 6-fold coordination.29 With the anti-bonding nature of the eg this value should yet be larger. Therefore, the repulsive interaction between the 5d electron of Eu2+ and the 5p electrons of I− ions is negligibly small giving rise to the relatively constant behavior.
A more detailed view in Fig. 13 already reveals the special role that CsCaI3 plays within this series. In fact, the emission energy and the energy of the 7F0 levels within the t2g state go through a maximum, whereas the respective energy of the 7F0 levels within the eg state goes through a minimum in that case. We emphasize again to keep in mind that in the case of CsCaI3, it is valid to speak of a t2g state. The special dependence of the energies upon the size of the alkaline earth site can be directly correlated with the structures of the iodides. As indicated in Section 3.1, the tendency of tilting of the [EuI6]4− octahedra increases from CsCaI3 over CsSrI3 to CsMgI3. In the last compound, the octahedra are face-sharing (see Fig. 2). This goes along with an increasing trigonal distortion of the [EuI6]4− octahedra to D3d symmetry and the fact that the Eu2+ ions experience stronger repulsive forces due to the alkaline earth ions in the second coordination sphere. This is not the case for CsCaI3. The subsequent symmetry reduction to the real site symmetry C2h in CsSrI3 is assumed to be very weak and will be neglected for the following considerations. The t2g state splits into an a1g and an eg state in D3d symmetry. Therefore, the lowest excited state and the emission energies of Eu2+ in CsMgI3 and CsSrI3 should be lower than those in the case of CsCaI3. These aspects are well reproduced by the spectra (see Fig. 13) and are, in fact, the reason for the strange behavior of CsSrI3:Eu2+ showing a slightly redshifted emission with respect to CsCaI3:Eu2+. In the latter Eu2+-activated compound, the effect of trigonal distortion is negligibly small, as we will also show in the following section.
The discussion above indicates that the size of the alkaline earth site is not the only important parameter of the luminescence properties of Eu2+ in iodidoperovskites. Especially in the case of CsMgI3:Eu2+, the emission is extraordinarily redshifted. We have reported a similar behavior for CsMgBr3:Eu2+.17 Both compounds exhibit a high anisotropy and a pseudo-one-dimensional characteristic along the hexagonal c axis. Together with the small size of the Mg2+ site inducing a large crystal field splitting, the anisotropy synergetically leads to a large redshift. It has been discussed in the literature that the structural feature of linear chains induces a preferential orientation of one of the 5d orbitals into the direction of the chain.37,39 Due to the similar behavior of CsSrI3:Eu2+ with respect to CsMgI3:Eu2+ and the observed splitting in the excitation spectra, we assign the extraordinary redshift for CsMgI3:Eu2+ to the effect of the trigonal distortion induced by the tilts of the [EuI6]4− octahedra rather than to a preferential orientation of the 5d orbitals. In general, this is an important issue for applications especially in the LED technology, where it is desired to have green- to red-emitting phosphors excitable in the blue range. Therefore, not only the size of the alkaline earth site can help here but also a larger anisotropy and with that, a larger distortion.
Based on this interpretation, it is possible to deduce the position of the undistorted “t2g” state and, thus, the octahedral crystal field splitting, εundist.cfs(7,2+,A) = 10 Dq, without distortion. Since the energy of the barycenter of the undistorted “t2g” state is conserved, the resulting a1g state is lowered by 2/3 εtrig(7,2+,A), whereas the resulting eg state is increased by 1/3 εtrig(7,2+,A). Assuming that the distortion of the initial eg state in Oh symmetry is negligible, the octahedral crystal field splitting for the undistorted case can be derived as follows:
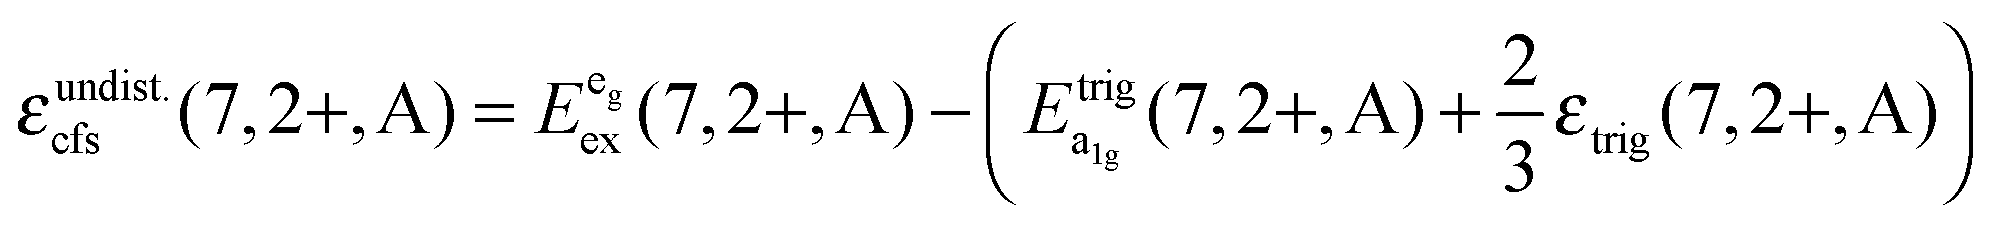 | (4) |
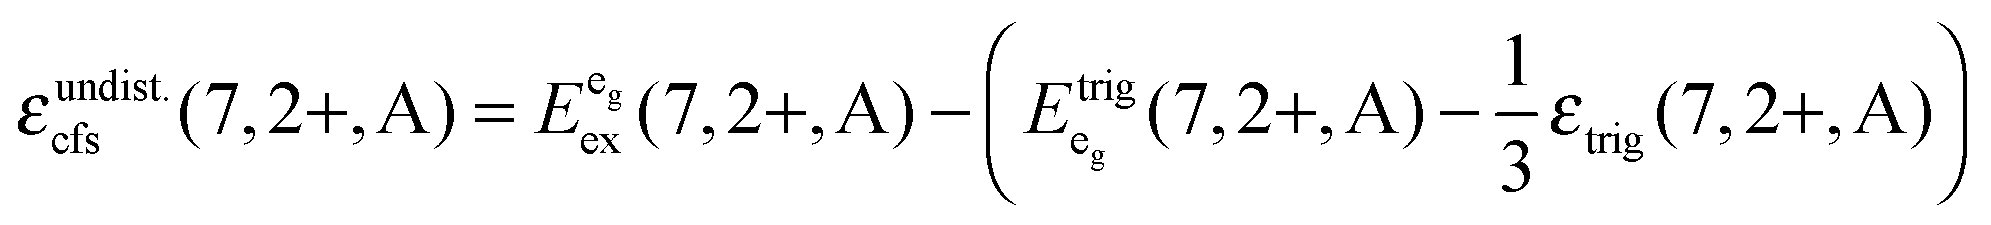 | (5) |
 is the average energy of the excitation band assigned to the eg state in Oh symmetry and
  and
and  are the average energies of the respective trigonal states as found in the excitation spectra of the compounds. The values for the octahedral crystal field splitting without distortion are compiled in Table 7.
As expected, the values in Table 7 increase with decreasing size of the alkaline earth site, thus inducing a smaller Eu–I bond length. Upon comparison with the 10 Dq values known from the respective bromidoperovskites,17 the derived values for the iodides are all smaller. This is in agreement with theoretical considerations since I− is a larger ion and more polarizable and, thus, a softer ligand. It should be noted, however, that for CsMgBr3:Eu2+, the crystal field splitting was directly derived without considering trigonal distortion.17 Therefore, the corrected value for 10 Dq in the case of CsMgBr3:Eu2+ will be smaller (13230 cm−1). It is, however still larger than the value of the respective iodide. The crystal field splitting derived using eqn (4) and (5) is in the range known from alkali halides31 making our interpretation plausible.
4.2. Energetic order of trigonal crystal field states in CsMgI3:Eu2+ and CsSrI3:Eu2+
Throughout this paper, we argued that the trigonal distortion leads to a splitting of the t2g state into an a1g and an eg state with the latter being higher in energy. In this section, we want to justify this statement using the angular overlap model (AOM) known from ligand field theory. A well-written review about this approach has been published by Schäffer40 and the reader can refer to it for the details of this approach. Since the 5d orbitals are much more diffuse and more involved in metal–ligand bonding than the 4f orbitals of Eu2+, the latter were neglected in the AOM approximation. In the case of CsMgI3:Eu2+ and CsSrI3:Eu2+, the trigonal distortion of the [EuI6]4− octahedra evolves along the C3 axis, thus leading to the disposal of the ligands with respect to the normal z axis by a small polar angle Θ (see Fig. 14). The strong tilting pattern of the respective octahedra in the structures of CsMgI3 and CsSrI3 (see Fig. 2 and 4) induces a stronger repulsion between the ligands, which makes the trigonal distortion also plausible from an electrostatic perspective.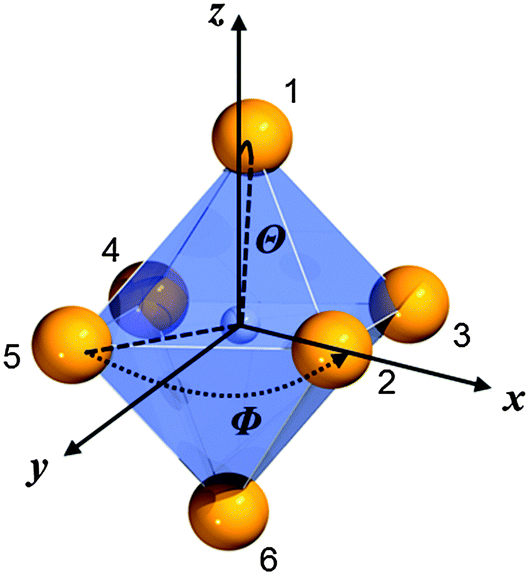 | ||
| Fig. 14 Numbering of the ligands and their respective angular positions within the equatorial plane (Φ) and relative to the normal z axis (Θ) of the [EuI6]4− octahedron in CsMgI3 and CsSrI3. | ||
For the AOM approximation, it is assumed that the Eu–I bond lengths do not change during the trigonal distortion, i.e. only the angular part of the overlap integral is important in this consideration. If the Eu2+ ion is placed into the origin of the coordinate system, the positions of the ligands can be parametrized by the disposal Θ of the Eu–I bond with respect to the z axis and their azimuthal angle Φ relative to the x axis. The numbering of the ligands as denoted in Fig. 14 leads to the parametrization shown in Table 8.
| L1 | L2 | L3 | L4 | L5 | L6 | |
|---|---|---|---|---|---|---|
| Φ | π/4 | 0 | π/2 | π | 3π/2 | 5π/4 |
| Θ | θ | π/2 − θ | π/2 + θ | π/2 + θ | π/2 − θ | π + θ |
The distortion angle Θ is not known quantitatively, thus, it will be denoted by a small angle θ. With the parametrization in Table 8 the factors by which the angular overlap integrals are diminished from the maximum value can be deduced in the coordination frame shown in Fig. 14. They arise due to the fact that for every spherically symmetric ligand, the coordination frame has to be rotated such that the 5d orbitals have maximum overlap with the ligand orbitals. This procedure leads to a 5 × 5 transformation matrix that has to be evaluated for every ligand separately. Its general form has been deduced by Schäffer.41
For the calculation in the case of CsMgI3 and CsSrI3, some other assumptions have still to be taken into account. Within the AOM approximation, only σ- and π-like interactions are considered and parametrized by the interaction terms eσ and eπ. Moreover, for small angles θ, the functions sinθ and cosθ can be approximated very well by their Taylor expansions up to second order. With these assumptions, the energies of the 5dxz, 5dxy and 5dyz orbitals transforming as t2g states in a perfect octahedral environment can be evaluated during the trigonal distortion:
| εxz = 4eπ + θ2(9eσ − 11eπ) | (6) |
| εyz = 4eπ + θ2(9eσ − 11eπ) | (7) |
| εxy = 4eπ − 2eπθ2 | (8) |
| εAOMtrig(7,2+) = 9θ2(eσ − eπ) | (9) |
| Compound | ε trig(7,2+,A)/cm−1 |
|---|---|
| CsMgI3:Eu2+ | 4310 |
| CsCaI3:Eu2+ | — |
| CsSrI3:Eu2+ | 3960 |
The behavior of the curves shown in Fig. 13 is also well understood in terms of the AOM. When regarding eqn (6)–(8), it turns out that the energies of the hypothetical “t2g” state,  , should decrease with increasing θ. This is exactly the observed behavior. CsCaI3:Eu2+ provides the limiting case θ → 0, thus leading to a maximum for
  in this series.
Fig. 15 finally represents a summarizing schematic overview of the evolution of the 5d states of Eu2+ in CsMI3 (M = Mg, Ca, and Sr). It shows the irregular behavior of the emission energies illustratively. The centroid shift, εc(7,2+,A), should only be regarded qualitatively and was intentionally not determined for iodidoperovskites. Since a strong degree of tilt for the [MI6]4− octahedra is not reasonable in terms of Pauling's rules42 due to the larger repulsion, this effect indicates a larger covalence of the M–I bond and thus, the Eu–I bond. Moreover, the effect of trigonal distortion has to be included into the formula such that a simple approach as attempted for the bromidoperovskites17 does not seem very reasonable. We will discuss the effect of higher covalence of the Eu–I bond in CsMgI3:Eu2+ and CsSrI3:Eu2+ in terms of the decay times in Section 4.4.
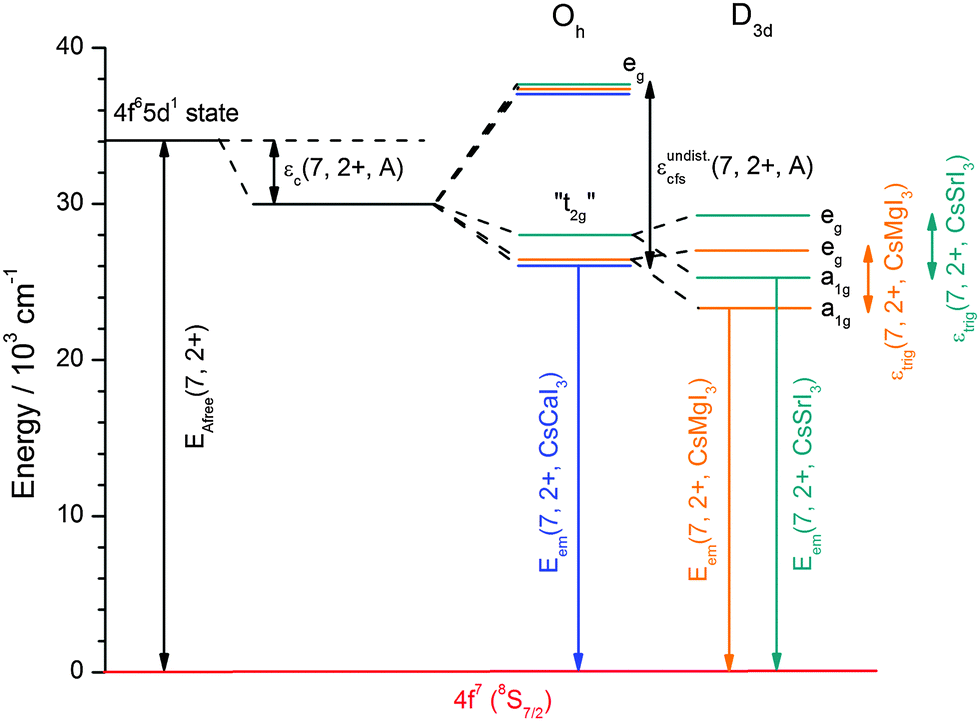 | ||
| Fig. 15 Schematic energy level scheme for the 5d states of Eu2+ and the resulting luminescence in CsMI3:Eu2+ (M = Mg, Ca, and Sr). The centroid shift as drawn was determined from the average position of the “t2g” state and should only be considered qualitatively. | ||
4.3. Temperature-dependent emission
All Eu2+-activated iodidoperovskites CsMI3 (M = Mg, Ca, and Sr) show efficient luminescence even at room temperature. As we have already indicated in Section 3.3, the quenching temperature T1/2, at which the integrated intensity has decreased to 50% of its initial value at 10 K, is well above 300 K. In fact, the intensities in CsCaI3:Eu2+ and CsSrI3:Eu2+ at room temperature only decrease to 88% and 85%, respectively, compared to their 10 K values. Together with the low Stokes shifts, this indicates a weak electron–phonon coupling. This is predominantly due to the fact that the highest phonon energy in iodides is relatively low (below 200 cm−1).34 The 5d–4f emission of Eu2+ in CsCaI3 and CsSrI3 exhibits a blueshift with higher temperatures, which arises due to the thermal population of the higher 7FJ levels within the lowest excited 5d state.Interestingly, the Stokes shift ΔS(2+,CsMgI3) and the FWHM Γ at 10 K are both very large in the case of CsMgI3:Eu2+ (see Table 6). Moreover, the emission is highly asymmetric. This behavior is already familiar from CsMgBr3:Eu2+.17 As a possible explanation anomalous luminescence could be assumed, which arises if the 5d states are closely located at the bottom or inside of the conduction band of the host lattice. Anomalous luminescence of Eu2+ is typically characterized by Stokes shifts in the range of 4000–10000 cm−1, large FWHMs (4000–6000 cm−1), shortened decay times and low quenching temperatures T1/2.43 However, the large covalence of the Eu–I bond in CsMgI3 will shift the 5d states to low energies. Due to that fact and the large crystal field splitting due to the small Mg2+ site and the trigonal distortion, it does not seem very probable that anomalous luminescence occurs in this compound. The experimental results also contradict the presence of anomalous luminescence since the luminescence is still very efficient even at room temperature and a fine structure due to the 7FJ levels can even be observed in the high-energy excitation band assigned to the eg crystal field state (see Fig. 5 and 11). Thus, we exclude anomalous luminescence of Eu2+ in CsMgI3. Nevertheless, the large Stokes shift and FWHM at 10 K indicate a large reorganization of the electron density in the excited state. Obviously, this is related to the huge difference between the ionic radii of Mg2+ and Eu2+ (ΔR = 0.45 Å29) and the relatively short Mg–I bond length (see Table 1). Upon excitation into the diffuse 5d orbitals of Eu2+, the Eu–I bond length is expected to change drastically inducing the large Stokes shift and, subsequently, the large FWHM. A quantitative correlation between the Stokes shift and the size of the alkaline earth site is, however, not very reasonable since it is not known whether the Eu–I distance increases or decreases in the excited state. In general, an increase of the bond length is assumed due to the more antibonding nature of the excited state. However, as it has been shown for the Ce3+-activated elpasolite CsNaLuCl6 by pressure-dependent luminescence measurements, the potential surface of the excited 5d state can also be located at lower metal–ligand distances than for the ground state.44
For CsSrI3:Eu2+, however, the Stokes shift ΔS(2+,CsSrI3) and the FWHM Γ at 10 K are very low (see Table 6), although the structure of the host compound is very similar to that of CsMgI3. Moreover, a lower Stokes shift of 1090 cm−1 and 1420 cm−1,17 respectively, is observed compared to CsSrBr3:Eu2+. In general, an increase of the Stokes shift is expected upon increase of the polarizability of the ligands. This trend is clearly observed when comparing CsCaBr3:Eu2+ (ΔS(2+,CsCaBr3) = 1080 cm−1 (ref. 17)) with CsCaI3:Eu2+ (ΔS(2+,CsCaI3) = 1310 cm−1, see Table 6). Our explanation for the reverse effect in the Sr-based compounds relies on the fact that the average Sr–I bond length is relatively large (3.37 Å, see Table 124). Since Eu2+ ions have approximately the same ionic radius as Sr2+ ions, they will be readily incorporated into the structure without severe distortion effects. If the Eu–I bond length is therefore relatively large in the ground state, an excitation into the 5d states will not change the bond length drastically and vibrational relaxation upon reorganization of the electron density is highly reduced giving rise to a small Stokes shift. Calculations of the electron density distribution in the ground and the first excited state and the resulting bond lengths could give some further insight here.
4.4. Decay times and radial integrals
The measured decay times and deduced values of the radial integrals (see Table 5) of Eu2+ in CsMI3 (M = Mg, Ca, Sr) are in good agreement with the values reported in the literature.35 Although they have been measured at room temperature, the low vibrational energy in iodides makes vibrational coupling rather inefficient such that the decay time is not significantly shortened with respect to temperatures as low as 10 K. Their dependence upon the size of the alkaline earth site is plotted in Fig. 16.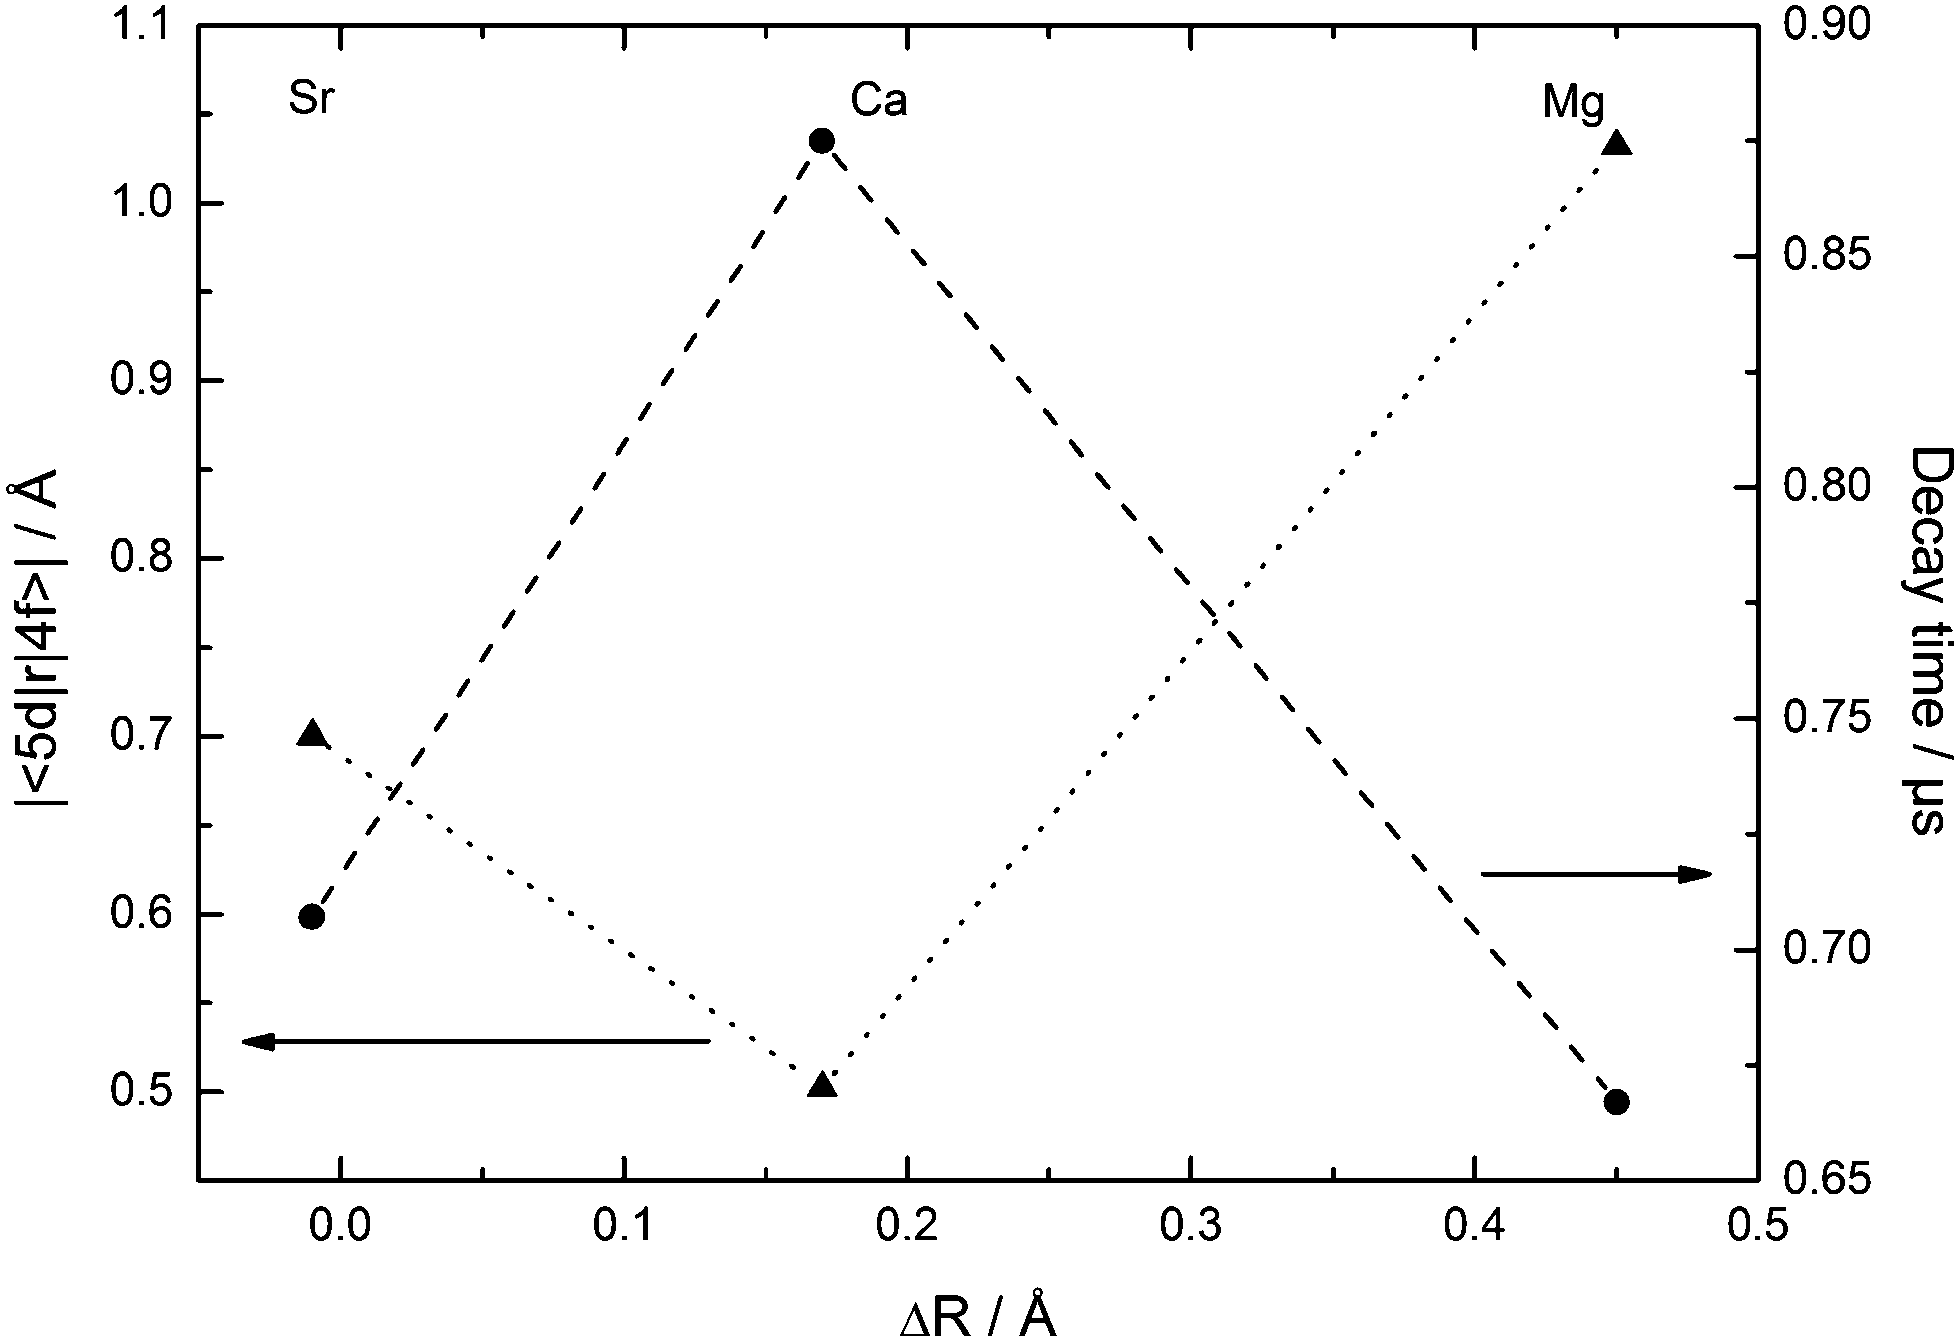 | ||
| Fig. 16 Dependence of the decay times τ (●, dashed curve) and radial integrals |〈5d|r|4f〉| (▲, dotted curve) of Eu2+ upon the size of the alkaline earth site in CsMI3 (M = Mg, Ca, and Sr). | ||
The behavior of the decay times of Eu2+ with varying differences in ionic radii of Eu2+ and the alkaline earth ion is very similar to the variation of the emission energies and thus, the energies  indicate that the “t2g” state is the emissive state. As has already been discussed above, Eu2+-activated CsSrI3 and CsMgI3 show an exceptional behavior also in the decay times and conclusively, also in the radial integrals. In fact, the decay times of Eu2+ in these two compounds are very short compared to the values known from oxides.35 Obviously, this is related to the larger disposal of the octahedra in both structures. Such disposal is related to a larger covalence of the Eu–I bond. Due to the nephelauxetic effect, this lowers the barycenter of the 5d states inhibiting an admixture with the excited 4f7 states of Eu2+. Thus, the decay times of CsMI3:Eu2+ (M = Mg, Sr) are lowered compared to the decay time of Eu2+ in CsCaI3.
The decay times detected for CsCaI3:Eu2+ and CsSrI3:Eu2+ are shorter compared to the respective bromides,17 in accordance with the expectations regarding the higher covalence and the stronger nephelauxetic effect in iodides. In the case of CsMgI3:Eu2+, the decay time is strikingly similar to the value found for CsMgBr3:Eu2+.17 Taking the fact into account that the “t2g” excitation band is at almost the same energy in both compounds, one may conclude that the synergic effect of covalence and trigonal distortion leads to roughly the same position of the lowest excited state of Eu2+ in CsMgBr3 and CsMgI3 and thus, to a similar decay time.
The radial integrals are also in a reasonable range. They are significantly larger for CsMgI3:Eu2+ and CsSrI3:Eu2+ than for CsCaI3:Eu2+. This indicates a larger overlap between the 4f and the 5d wavefunctions in the former two compounds, which is induced by the increasing anisotropy in both structures. In the case of CsMgI3:Eu2+, the small size of the Mg2+ site still increases the value of the radial integral and thus, lowers the decay time.
In the cases of CsCaI3:Eu2+ and CsSrI3:Eu2+, the low Stokes shifts allow the possibility of self-absorption that might lead to lengthening of the decay time. This effect can be excluded here, however, due to the low concentration of only 0.1 mol% that leads to a high probability of isolation of the Eu2+ ions.
5. Conclusions
The photoluminescence properties of Eu2+-activated CsMI3 (M = Mg, Ca, Sr) were presented and analyzed in detail. The crystal structures of the compounds can be derived from a perovskite structure type with six-fold coordinated alkaline earth sites substituted by Eu2+. All emission spectra are characterized by an asymmetric Gaussian-shaped band that can be assigned to 4f6(7FJ)5d1 → 4f7(8S7/2) transitions. All excitation spectra provide a distinct fine structure in both the “t2g” and the eg state during approximation of an octahedral symmetry for the Eu2+ ions. It can be assigned to the different 7FJ levels arising from 4f6 core in the excited state using a decoupled scheme and thus assuming a weak exchange interaction between the 4f electrons and the 5d electron. This behavior is in agreement with the behavior observed for the respective bromides17 and is otherwise only known for the alkali bromides and iodides.31 In the cases of Eu2+-activated CsMgI3 and CsSrI3, the excitation spectra reveal a non-negligible trigonal distortion of the [EuI6]4− octahedra leading to a splitting of the supposed “t2g” state into an a1g and an eg state. Their energetic order has been justified in terms of the angular overlap model of ligand field theory. The trigonal distortion leads to several irregular effects like a redshifted emission and excitation of Eu2+ in CsSrI3 with respect to Eu2+-activated CsCaI3 that would not be anticipated assuming a simple octahedral symmetry. The asymmetry of the emission of Eu2+ in CsMgI3 and CsSrI3 can be understood taking the splitting of the “t2g” state into account.An analysis of the behavior of the emission and excitation energies of Eu2+ ions dependent upon the size of the alkaline earth site substituted indicates that emission occurs from the lowest excited supposed “t2g” state. It turns out that the lowest excited states are slightly bonding whereas the high-energy eg state is almost non-bonding due to the large Eu–I bond length in the excited state.
All Eu2+-activated iodides presented in this paper show very efficient photoluminescence even at room temperature. The quenching temperatures T1/2 are all well above room temperature, which is easily understood taking the low phonon energies in iodides into account that makes vibrational coupling rather inefficient. The Stokes shifts are also rather small except in the case of CsMgI3:Eu2+. Here, the large Stokes shift is most probably induced by the large amount of reorganization of the electron density in the excited state due to the low Eu–I bond length in the ground state.
The values of the decay times are all shorter, or, in the case of CsMgI3:Eu2+, similar to the decay times detected for the respective bromides.17 This is in accordance with the expectations. The decay times of CsMgI3:Eu2+ and CsSrI3:Eu2+ are extraordinarily short, which can also be correlated with their special structure. In fact, the larger disposal of the octahedra in these compounds indicates a larger covalence of the M–I bond and thus, the Eu–I bond, which is directly reflected in the lower decay times relative to CsCaI3:Eu2+. In general, the materials investigated in this work allow an extremely detailed insight into the Eu2+ structure–luminescence relationship due to the high resolution of the spectra and may, thus, serve as a textbook example in this context.
Acknowledgements
We are grateful to Prof. Dr Richard Dronskowski and Prof. Dr Andrei Tchougréeff from RWTH Aachen for their enormous help with the angular overlap model considerations.Notes and references
- T. Kobayasi, S. Mroczkowski, J. F. Owen and L. H. Brixner, J. Lumin., 1980, 21, 247 CrossRef CAS
.
- A. Ellens, A. Meijerink and G. Blasse, J. Lumin., 1994, 59, 293 CrossRef CAS
- D. K. Sardar, W. A. Sibley and R. Alcala, J. Lumin., 1982, 27, 401 CrossRef
- C. Braun, M. Seibald, S. L. Börger, O. Oeckler, T. D. Boyko, A. Moewes, G. Miehe, A. Tücks and W. Schnick, Chem. – Eur. J., 2010, 16, 9646 CrossRef CAS PubMed
- Y. Q. Li, J. E. J. v. Steen, J. W. H. v. Krevel, G. Botty, A. C. Delsing, F. J. DiSalvo, G. D. With and H. T. Hintzen, J. Alloys Compd., 2006, 417, 273 CrossRef CAS PubMed
- V. Bachmann, C. Ronda, O. Oeckler, W. Schnick and A. Meijerink, Chem. Mater., 2009, 21, 316 CrossRef CAS
- V. Bachmann, T. Jüstel, A. Meijerink, C. Ronda and P. J. Schmidt, J. Lumin., 2006, 121, 441 CrossRef CAS PubMed
- N. Yamashita, O. Harada and K. Nakamura, Jpn. J. Appl. Phys., 1995, 34, 5539 CAS
- J. O. Rubio, J. Phys. Chem. Solids, 1991, 52, 101 CrossRef
- P. Dorenbos, J. Lumin., 2003, 104, 239 CrossRef CAS
- G. Blasse, Phys. Status Solidi B, 1973, 55, K131 CrossRef CAS PubMed
- C. Wickleder, J. Alloys Compd., 2000, 300, 193 CrossRef
- D. H. Gahane, N. S. Kokode, B. M. Bahirwar and S. V. Moharil, Phys. Procedia, 2012, 29, 42 CrossRef CAS PubMed
- A. Y. Grippa, N. V. Rebrova, T. E. Gorbacheva, V. Y. Pedash, N. N. Kosinov, V. L. Cherginets, V. A. Tarasov, O. A. Tarasenko and A. V. Lopin, J. Cryst. Growth, 2013, 371, 112 CrossRef CAS PubMed
- V. L. Cherginets, A. Y. Grippa, T. P. Rebrova, Y. N. Datsko, T. V. Ponomarenko, N. V. Rebrova, N. N. Kosinov and O. V. Zelenskaya, Funct. Mater., 2012, 19, 429 CAS
- V. L. Cherginets, N. V. Rebrova, A. Y. Grippa, Y. N. Datsko, T. V. Ponomarenko, V. Y. Pedash, N. N. Kosinov, V. A. Tarasov, O. V. Zelenskaya, I. M. Zenya and A. V. Lopin, Mater. Chem. Phys., 2014, 143, 1296 CrossRef CAS PubMed
- M. Suta, P. Larsen, F. Lavoie-Cardinal and C. Wickleder, J. Lumin., 2014, 149, 35 CrossRef CAS PubMed
- M. Zhuravleva, B. Blalock, K. Yang, M. Koschan and C. L. Melcher, J. Cryst. Growth, 2012, 352, 115 CrossRef CAS PubMed
- M. Tyagi, M. Zhuravleva and C. L. Melcher, J. Appl. Phys., 2013, 113, 203504 CrossRef PubMed
- K. Yang, M. Zhuravleva and C. L. Melcher, Phys. Status Solidi RRL, 2011, 5, 43 CrossRef CAS PubMed
- H. Wei, M. Zhuravleva, K. Yang and C. L. Melcher, J. Cryst. Growth, 2013, 384, 27 CrossRef CAS PubMed
- M. D. Taylor and C. P. Carter, J. Inorg. Nucl. Chem., 1962, 24, 387 CrossRef CAS
- G. L. McPherson, A. M. McPherson and J. L. Atwood, J. Phys. Chem. Solids, 1980, 41, 495 CrossRef CAS
- G. Schilling and G. Meyer, Z. Anorg. Allg. Chem., 1996, 622, 759 CrossRef CAS PubMed
- S. García-Revilla and R. Valiente, J. Phys.: Condens. Matter, 2006, 18, 11139 CrossRef
- S. García-Revilla, F. Rodríguez and R. Valiente, J. Lumin., 2008, 128, 937 CrossRef PubMed
- P. Dorenbos, J. Phys.: Condens. Matter, 2003, 15, 575 CrossRef CAS
- P. Dorenbos, J. Phys.: Condens. Matter, 2003, 15, 4797 CrossRef CAS
- R. D. Shannon, Acta Crystallogr., Sect. A: Cryst. Phys., Diffr., Theor. Gen. Crystallogr., 1976, 32, 751 CrossRef
- H. J. Seo, W. S. Zhang, T. Tsuboi, S. H. Doh, W. G. Lee, H. D. Kang and K. W. Jang, J. Alloys Compd., 2002, 344, 268 CrossRef CAS
- J. Hernandez, W. K. Cory and J. Rubio, J. Chem. Phys., 1980, 72, 198 CrossRef PubMed
- F. M. Ryan, W. Lehmann, D. W. Feldman and J. Murphy, J. Electrochem. Soc., 1974, 121, 1475 CrossRef CAS PubMed
- W. T. Carnall, G. L. Goodman, K. Rajnak and R. S. Rana, J. Chem. Phys., 1989, 90, 3443 CrossRef CAS PubMed
- K. Wakamura, Phys. Rev. B: Condens. Matter Mater. Phys., 1997, 56, 11593 CrossRef CAS
- S. H. M. Poort, A. Meijerink and G. Blasse, J. Phys. Chem. Solids, 1997, 58, 1451 CrossRef CAS
- G. Shwetha and V. Kanchana, Phys. Rev. B: Condens. Matter Mater. Phys., 2012, 86, 115209 CrossRef
- S. H. M. Poort, J. W. H. v. Krevel, R. Stomphorst, A. P. Vink and G. Blasse, J. Solid State Chem., 1996, 122, 432 CrossRef CAS
- A. Meijerink and G. Blasse, J. Lumin., 1989, 43, 283 CrossRef CAS
- S. H. M. Poort, W. P. Blokpoel and G. Blasse, Chem. Mater., 1995, 7, 1547 CrossRef CAS
- C. E. Schäffer, Pure Appl. Chem., 1970, 24, 361 CrossRef
- C. E. Schäffer, Struct. Bonding, 1968, 5, 68 CrossRef
- L. Pauling, J. Am. Chem. Soc., 1929, 51, 1010 CrossRef CAS
- P. Dorenbos, J. Phys.: Condens. Matter, 2003, 15, 2645 CrossRef CAS
- R. Valiente, F. Rodríguez, J. González, H. U. Güdel, R. Martín-Rodríguez, L. Nataf, M. N. Sanz-Ortiz and K. Krämer, Chem. Phys. Lett., 2008, 481, 149 CrossRef PubMed
| This journal is © The Royal Society of Chemistry 2015 |