 Open Access Article
Water effect on the spin-transition behavior of Fe(II) 1,2,4-triazole 1D chains embedded in pores of MCM-41†
Tian
Zhao
a,
Laure
Cuignet
ab,
Marinela Maria
Dîrtu
b,
Mariusz
Wolff
b,
Vojislav
Spasojevic
c,
Ishtvan
Boldog
a,
Aurelian
Rotaru
d,
Yann
Garcia
*b and
Christoph
Janiak
*a
aInstitut für Anorganische Chemie und Strukturchemie, Universität Düsseldorf, Universitätsstr. 1, 40225 Düsseldorf, Germany. E-mail: janiak@uni-duesseldorf.de
bInstitute of Condensed Matter and Nanosciences, Molecules, Solids and Reactivity (IMCN/MOST), Université Catholique de Louvain, Place L. Pasteur 1, 1348 Louvain-la-Neuve, Belgium. E-mail: yann.garcia@uclouvain.be
cInstitute for Nuclear Sciences, P. O. Box 522, 11001 Beograd, Serbia
dDepartment of Electrical Engineering and Computer Science & AMNOL, Stefan cel Mare University, 720229 Suceava, Romania
First published on 9th March 2015
Abstract
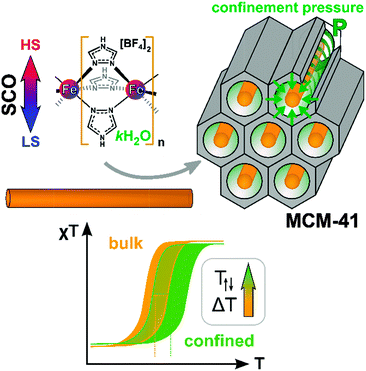
The spin-crossover (SCO) compounds [Fe(Htrz)3](BF4)2·H2O (SCO-1) and [Fe(Htrz)2trz]BF4 (SCO-2) (Htrz = 1,2,4-triazole) were embedded in the pores of mesostructured silica MCM-41 to yield SCO@MCM composites as evidenced by electron microscopy, gas sorption studies, powder X-ray diffractometry, atomic absorption and infrared spectrometry. Studies of the temperature-induced spin crossover behavior of the composites by temperature-variable 57Fe Mössbauer spectroscopy, magnetic and differential scanning calorimetry measurements and optical reflectivity indicate that the spin transition of the composites was significantly shifted for SCO-1@MCM to higher temperature in comparison to bulk SCO-1 compounds while the shift for SCO-2 was negligible. These shifts in the transition temperature for SCO-1@MCM [versus bulk SCO-1] amounted to T↑c = 371/376 K [282/291 K] and T↓c = 340/345 K [276/286 K] (magnetic/optical reflectivity data) with a broadening of the hysteresis by 25–26 K relative to bulk SCO-1 (varying slightly with the used method). The significant difference in the SCO behavior of the similar materials SCO-1 and SCO-2 when embedded in the MCM-41 matrix is assigned to the hydration of the SCO-1@MCM material. Water is apparently crucial in transmitting the confinement pressure or matrix effect on the spin transition when the SCO compound is embedded between the pore walls.
Introduction
The spin crossover (SCO) phenomenon is the switching of a transition metal complex between two different stable ground states: the low-spin (LS) and the high-spin (HS) states.1,2 The switching between these two states may be invoked by different external stimuli such as light, temperature or pressure.3–5 Iron(II) SCO complexes typically based on N-donor azole/azolate or azine ligands not only lead to a change in magnetic moment but usually give rise to optical transitions from purple in the LS state (lower temperature) to off-white in the HS state when increasing the temperature (cf.Fig. 1).6,7 One interesting aspect in this area concerns the case of SCO hybrid materials where a given complex can feel the constraint of a given matrix which is equivalent to the application of additional pressure.8–10 Several SCO nanoparticles based on Fe(II) complexes were prepared and embedded in matrices, such as SiO2,11 Ni,12 and CsFe[Cr(CN)6], to name a few.13 Another manifestation of indirect pressure effects could also be found in SCO nanoparticles for which theoretical descriptions were recently proposed.14,15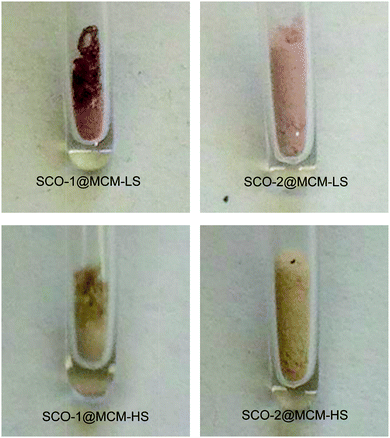 | ||
| Fig. 1 Photographs showing the color change from LS (room temperature) to HS (∼100 °C) for each sample. | ||
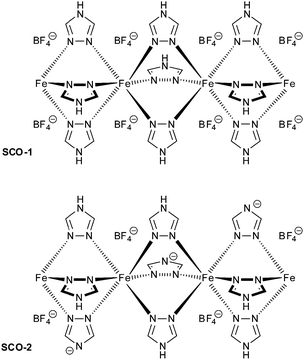
In this work, two iron(II) SCO compounds were embedded in mesostructured silica MCM-41. The selected materials are the 1D coordination polymers [Fe(Htrz)3](BF4)2·H2O (SCO-1) and [Fe(Htrz)2trz]BF4 (SCO-2) with Htrz = 4H-1,2,4-triazole and trz = 1,2,4-triazolato (Scheme 1).16–18 Both are known to exhibit a hysteretic SCO behavior with sharp spin transition (ST) above room temperature. SCO-2 which displays a reproducible hysteresis loop of T↑c = 385 K and T↓c = 345 K17 has been selected for numerous studies, because it does not contain any water molecules which can give rise to unstable hysteresis loops due to solvent release. In particular, hybrid materials including SCO-2 were recently prepared with a mesoporous silica monolith,19 graphene,20 and with silica–gold nanocomposites.21 Yet, the matrix effect with MCM-41 has not been investigated although this material is well known for its potential to accommodate various sorts of guests.22 The MCM-41 matrix effect, that is, the change in SCO behavior under the constraints of surrounding silicate walls has been studied herein by temperature-variable 57Fe Mössbauer spectroscopy, differential scanning calorimetry, magnetic measurements and optical reflectivity.
Results and discussion
Synthesis
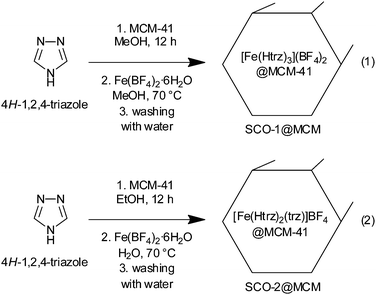
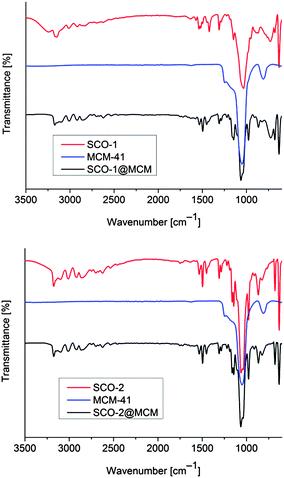
Fe(II) 1,2,4-triazole compounds were embedded in MCM-41 host matrices by first impregnating the MCM-41 material with an alcoholic solution of the 1,2,4-triazole ligand over a time of at least 12 h. Then an alcoholic or an aqueous solution of the appropriate amount of the iron(II) salt Fe(BF4)2·6H2O, was added to form the composite SCO@MCM materials (eqn (1) and (2), respectively). For the subsequent investigations it was crucial to have the SCO material only inside the cylindrical pores of MCM-41. So, careful washing with water was done to remove any SCO precipitate outside of the pores. Both compounds SCO-1 and -2 readily dissolve in water with plausible fragmentation of the 1D chains (according to ref. 17 SCO-2 dissolves with decomposition) (Scheme 2).The IR spectra of the composite materials SCO@MCM compared to the IR spectra of bulk SCO and MCM-41 show the presence of both components in the composite (Fig. 2).
The SCO amount in the composite was calculated from the iron analysis by atomic absorption spectroscopy to be 56.4 wt% for SCO-1@MCM and 43.8 wt% for SCO-2@MCM (see Table 3 for details).
Matching powder X-ray diffractograms (PXRD, Fig. 3) of bulk SCO and the SCO@MCM materials confirm the identity of the SCO materials formed in bulk and as a SCO@MCM composite for SCO-1 and SCO-2.
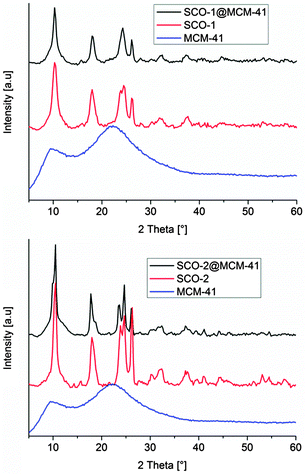 | ||
| Fig. 3 Powder X-ray diffractograms of bulk SCO complexes, and SCO@MCM composite materials (background corrected). The MCM host matrix is amorphous. | ||
Porosity measurements
IR spectroscopy, elemental analysis and PXRD cannot distinguish between bulk and embedded SCO material and, hence, do not prove the presence of SCO inside the pores of MCM. However, with the pores of MCM filled by the SCO compound the porosity should decrease. The remaining porosity of the SCO@MCM composite materials was analyzed by N2 sorption studies at 77 K (Fig. 4). The sample was degassed in vacuum before measurement at a temperature of 393 K for 2 h. In the composite materials the Brunauer–Emmett–Teller (BET) and Langmuir surface areas for SCO-1 have decreased considerably to less than 25% of the value found in MCM-41 (Table 1).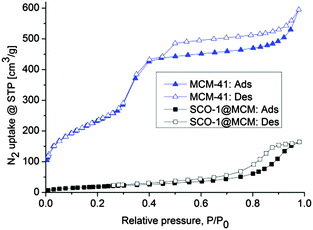 | ||
| Fig. 4 N2 sorption isotherms of MCM-41 and SCO@MCM samples; closed and open symbols refer to adsorption and desorption, respectively. | ||
| Composite | S BET (m2 g−1) | S Lang (m2 g−1) | V 0.1 (cm3 g−1) | V tot (cm3 g−1) | V 0.1/Vtot | V micro (CO2)e (cm3 g−1) |
|---|---|---|---|---|---|---|
| a BET surface area calculated at 0.05 < p/p0 < 0.2 from N2 sorption isotherm at 77 K with a standard deviation of ±50 m2 g−1. b Langmuir surface area over the pressure range 0–110 Torr. c Micropore volume calculated from N2 adsorption isotherm at p/p0 = 0.1 for pores with d ≤ 2 nm (20 Å). d Calculated from N2 sorption isotherm at 77 K (p/p0 = 0.95) for pores ≤20 nm. e Pore volume for pores with d ≤ 1 nm (10 Å, cf. Fig. S3, ESI) from the CO2 NL-DFT model at 273 K. | ||||||
| MCM-41 | 857 | 1238 | 0.297 | 0.82 | 0.36 | 0.0175 |
| SCO-1@MCM | 70 | 104 | 0.0222 | 0.235 | 0.09 | 0.002 |
| SCO-2@MCM | 0 | 0 | n.a. | n.a. | n.a. | 0.002 |
| Material | 57Fe Mössbauer | Magnetic | Optical reflect. | DS calorimetry | Ref. | ||||
|---|---|---|---|---|---|---|---|---|---|
| T ↑c | T ↓c | T ↑c | T ↓c | T ↑c | T ↓c | T ↑c | T ↓c | ||
| a n.a. = not available. b Hydrated material, [Fe(Htrz)3](BF4)2·H2O. c Dehydrated material. d First heating and cooling cycle on hydrated material. e Second to fourth cycle on dehydrated material. f Optical reflectance measurements were recorded in this work on SCO-2 prepared as nanoparticles in the liquid state according to ref. 40. g At 7 K min−1. h At 10 K min−1. | |||||||||
| Bulk SCO-1 | n.a.a | n.a.a | 345b | 323b | 336b | 323b | 17 | ||
| 282c | 276c | 291c | 286c | ||||||
| SCO-1@MCM | 330 | 310 | 389d | 340d | 394d | 345d | This work | ||
| 371e | 340e | 376e | 345e | ||||||
| Bulk SCO-2 | 380 | 344 | 385 | 345 | 383g | 343g | 17 | ||
| 373f | 343f | 387h | 343h | This work | |||||
| SCO-2@MCM | 342 | 328 | 381 | 346 | 385 | 351 | 390h | 355h | This work |
| Sample | Fe content (wt%) | SCO content (wt%) |
|---|---|---|
| a See Tables S2–S4 in ESI for details. | ||
| SCO-1@MCM | 7.21 | 56.4 |
| SCO-2@MCM | 7.01 | 43.8 |
The adsorption isotherm of SCO-1@MCM is of type-IV, which is typical for many mesoporous adsorbents,23–25 with an H2 hysteresis loop which may be associated with pores with narrow necks and wide bodies (“bottle-neck” pores).26 Such pore structures can result from the formation of SCO-1 microcrystals inside the MCM mesopores. The N2 sorption isotherm for MCM-41 with its S-shape matches the literature reports.27–30 In summary, the decrease of surface area and porosity is a good indication that the MCM-41 matrix was filled by SCO materials as intended.
No observable surface area was found by N2 sorption for SCO-2@MCM. However, at the cryogenic temperature of 77 K diffusion of N2 molecules into micropores is very slow. Diffusion limitations at this temperature influences adsorption in ultramicropores (pores smaller than 7 Å).31 For porous materials which usually contain a wide range of pore sizes including ultramicropores, this would require time-consuming N2 adsorption measurements and may still lead to under-equilibration of the adsorption isotherms, hence, will give erroneous results of the pore volume and pore size distribution analysis. Problems of this type can be eliminated by using CO2 adsorption analysis at 273 K.32 The saturation pressure of CO2 at 0 °C is very high (∼26![[thin space (1/6-em)]](https://www.rsc.org/images/entities/char_2009.gif) 141 Torr), therefore low relative pressure measurements necessary for micropore analysis are achieved in the range of moderate absolute pressures (1–760 Torr).33 At 273 K and under higher absolute pressures CO2 molecules can more easily access ultramicropores than N2 at ∼77 K and the kinetic diameter of CO2 (3.3 Å) is also slightly smaller than for N2 (3.64 Å). CO2 micropore analysis at 273 K versus N2 analysis at 77 K is advantageous because of (i) faster analysis and (ii) greater confidence that measured adsorption points are equilibrated (both due to higher diffusion rates) and (iii) extension of the range of analysis to pores of smaller sizes that are accessible to CO2 molecules but not to N2.34
141 Torr), therefore low relative pressure measurements necessary for micropore analysis are achieved in the range of moderate absolute pressures (1–760 Torr).33 At 273 K and under higher absolute pressures CO2 molecules can more easily access ultramicropores than N2 at ∼77 K and the kinetic diameter of CO2 (3.3 Å) is also slightly smaller than for N2 (3.64 Å). CO2 micropore analysis at 273 K versus N2 analysis at 77 K is advantageous because of (i) faster analysis and (ii) greater confidence that measured adsorption points are equilibrated (both due to higher diffusion rates) and (iii) extension of the range of analysis to pores of smaller sizes that are accessible to CO2 molecules but not to N2.34
CO2 sorption at 273 K shows that SCO-2@MCM has comparable porosity to SCO-1@MCM (Fig. S2 in ESI†). This indicates that pores or pore mouths of SCO-2@MCM are narrower than that of SCO-1@MCM. Thus, from CO2 adsorption isotherms at 273 K (Fig. S2, ESI†), the pore size distribution (PSD) for SCO@MCM was derived between 4–10 Å by using nonlocal density functional theory (NLDFT) with a “slit-pore model” (Fig. S3, ESI†). CO2 adsorption with the NLDFT model yields a better resolved PSD towards the ultramicropore end than from N2 adsorption isotherms for SCO-1@MCM (Fig. S3 to S5 in ESI†). Here the two SCO@MCM materials give very similar pore size distributions for pores below 10 Å (1 nm).
Electron microscopy
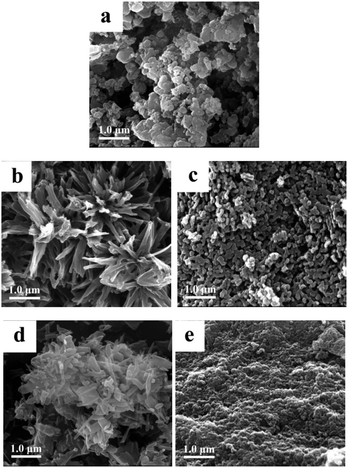
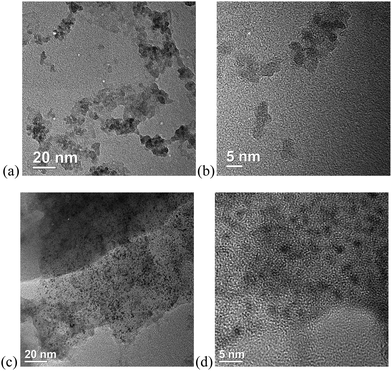
Scanning electron microscopy (SEM) images (Fig. 5) show a morphology of the SCO@MCM composite materials which is similar to native MCM. No characteristic SCO crystallites can be seen. This supports the formation of SCO inside the MCM mesopores and verifies the removal of any SCO formed outside through the washing procedures.Transmission electron microscopy (TEM) images reveal the formation of nanocrystals of SCO-1 and -2 inside the MCM matrix (Fig. 6). The dark spots which are ∼2 nm in diameter contain iron and at high resolution (5 nm gauge bar, Fig. 6b and d) it is visible that these dark spots consist of lattices planes which are indicative of crystalline material. The crystallinity of the SCO materials inside MCM is in agreement with the observation of PXRD patterns for the SCO@MCM composites (see Fig. 3).
Spin transition behavior
In this work, the ST behavior of the composites was investigated and compared to those of the guest materials using the same set of physical techniques. Such a careful comparison is important because of the diversity of techniques presented which can provide a different set of transition temperatures. The established SCO research practices foresee the use of several methods of investigation in order to cover the spread of ST parameters as found by different techniques. Bulk techniques: Mössbauer measurements (run in static mode with long acquisition times) and DC magnetic measurements (in settle mode) and a surface technique: optical reflectivity (in scanning mode). Mössbauer spectroscopy is the only method which provides a careful evaluation of the spin population given that by reflectivity, only the surface of the sample is probed.57Fe Mössbauer studies
SCO-1@MCM was investigated over the temperature range 78–358 K, first at 78 K and then on warming up to 358 K followed by a cooling cycle to 298 K. The associated Mössbauer parameters are gathered in Table 4. At 78 K, the spectrum of SCO-1@MCM consists of one quadrupole doublet, with an isomer shift of δLS = 0.43(1) mm s−1 and a quadrupole splitting of ΔELSQ = 0.26(2) mm s−1 characteristic for the LS state of iron(II) ions (Table 4). The composite remains in the LS state on warming up to 328 K (Fig. 7), showing no influence of the matrix on the spin state. SCO-1 was only partly investigated by Lavrenova et al. by Mössbauer spectroscopy.16 Nevertheless, the isomer shift δLS of SCO-1@MCM at room temperature nicely corresponds to the one reported for SCO-1 (δ = 0.43 mm s−1),16 indicating that the coordination polymer structure is not affected by the matrix environment, i.e., the 1D chain is not located nearby the walls of the MCM-41. No decomposition of the sample is noticed within the composite as seen by the absence of oxidation products, which was however clearly observed when studying a less stable derivative, [Fe(NH2trz)3](NO3)2 (NH2trz = 4-amino-1,2,4-triazole) within the same matrix. The latter material was synthesized and processed similarly to SCO-1,2@MCM. On warming to 333 K, a major signal is detected for the SCO-1@MCM composite with larger parameters (δHS = 0.97(1) mm s−1 and ΔEHSQ = 2.30(1) mm s−1) which are characteristic for the HS state of iron(II) ions (Fig. 7). The major signal is present in 80% population compared to the LS state. On warming further to 358 K, this population grows up to 87% indicating an incomplete spin transition. An asymmetric quadrupole doublet is noticed for the HS state at this temperature which is attributed to a texture effect. On cooling, a slight decrease of the HS population is observed down to 318 K after which a sharp transition to the LS state is observed. Interestingly, the ST is also incomplete at room temperature with 5% of ions remaining in the HS state. The temperature dependence of the HS molar fraction assuming equal Debye–Waller factors for HS and LS states, which is justified taking into account the sharpness of the ST,35 is shown in Fig. 8. A hysteresis loop of 20 K width is delineated with transition temperatures T↑c = 330 K and T↓c = 310 K. The ST is not complete in both HS and LS states.| T [K] | δ [mm s−1] | ΔEQ [mm s−1] | Γ/2 [mm s−1] | Relative area [%] | Sites |
|---|---|---|---|---|---|
| a ↑ indicates warming and ↓ indicates cooling; δ = isomer shift relative to α-iron, ΔEQ = quadrupole splitting, Γ/2 = half width at half maximum. b Fixed parameter. | |||||
| 78 | 0.43(1) | 0.26(2) | 0.13(1) | 100 | LS |
| 298↑ | 0.42(1) | 0.26(1) | 0.15(1) | 100 | LS |
| 303↑ | 0.41(1) | 0.26(1) | 0.16(1) | 100 | LS |
| 308↑ | 0.40(1) | 0.26(1) | 0.16(1) | 100 | LS |
| 313↑ | 0.40(1) | 0.26(1) | 0.16(1) | 100 | LS |
| 318↑ | 0.39(1) | 0.25(1) | 0.17(1) | 100 | LS |
| 323↑ | 0.38(1) | 0.26(1) | 0.17(1) | 100 | LS |
| 328↑ | 0.38(1) | 0.26(1) | 0.18(1) | 100 | LS |
| 333↑ | 0.97(1) | 2.30(1) | 0.13(1) | 80.0 | HS |
| 0.46(1) | 0.28(1) | 0.29(1) | 20.0 | LS | |
| 338↑ | 0.96(1) | 2.25(1) | 0.13(1) | 83.0 | HS |
| 0.45(1) | 0.28(1) | 0.26(1) | 17.0 | LS | |
| 343↑ | 0.95(1) | 2.21(1) | 0.13(1) | 83.0 | HS |
| 0.45(1) | 0.34(1) | 0.31b | 17.0 | LS | |
| 348↑ | 0.94(1) | 2.18(1) | 0.14(1) | 85.0 | HS |
| 0.44(1) | 0.34b | 0.31b | 15.0 | LS | |
| 353↑ | 0.93(1) | 2.15(1) | 0.13(1) | 87.0 | HS |
| 0.43b | 0.36(2) | 0.28(1) | 13.0 | LS | |
| 358 | 0.93(1) | 2.10(1) | 0.13(1) | 87.0 | HS |
| 0.43(1) | 0.38b | 0.26b | 13.0 | LS | |
| 353↓ | 0.94(1) | 2.14(1) | 0.14(1) | 87.0 | HS |
| 0.43(1) | 0.35b | 0.32(1) | 13.0 | LS | |
| 348↓ | 0.94(1) | 2.13(1) | 0.14(1) | 87.0 | HS |
| 0.44(1) | 0.38(1) | 0.33(1) | 13.0 | LS | |
| 343↓ | 0.95(1) | 2.21(1) | 0.13(1) | 83.0 | HS |
| 0.45b | 0.34b | 0.34(1) | 17.0 | LS | |
| 338↓ | 0.96(1) | 2.25(1) | 0.14(1) | 83.0 | HS |
| 0.45(1) | 0.32b | 0.46(1) | 17.0 | LS | |
| 333↓ | 0.97(1) | 2.29(1) | 0.16(1) | 82.0 | HS |
| 0.46(1) | 0.35b | 0.44(1) | 18.0 | LS | |
| 328↓ | 0.98(1) | 2.32(1) | 0.14(1) | 82.0 | HS |
| 0.47(1) | 0.30b | 0.45(1) | 18.0 | LS | |
| 318↓ | 0.99(1) | 2.39(1) | 0.14(1) | 81.0 | HS |
| 0.49(1) | 0.35b | 0.31(1) | 19.0 | LS | |
| 313↓ | 0.99(1) | 2.42(1) | 0.14(1) | 75.0 | HS |
| 0.54(1) | 0.47(1) | 0.26(1) | 25.0 | LS | |
| 308↓ | 0.99(1) | 2.42(1) | 0.15(1) | 5.0 | HS |
| 0.50(1) | 0.31(1) | 0.16(1) | 95.0 | LS | |
| 303↓ | 0.99(1) | 2.40(1) | 0.14(1) | 5.0 | HS |
| 0.50(1) | 0.30(1) | 0.16(1) | 95.0 | LS | |
| 298↓ | 1.07(1) | 2.63(1) | 0.16(1) | 5.0 | HS |
| 0.49(1) | 0.30(1) | 0.16(1) | 95.0 | LS | |
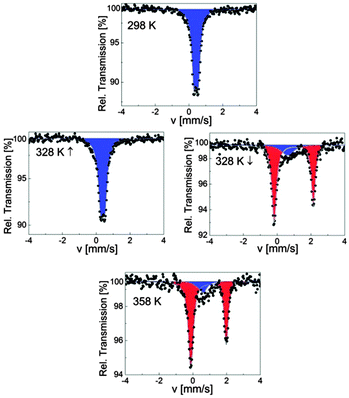 | ||
| Fig. 7 Selected 57Fe Mössbauer spectra of SCO-1@MCM; blue and red colors correspond to LS and HS doublets, respectively. | ||
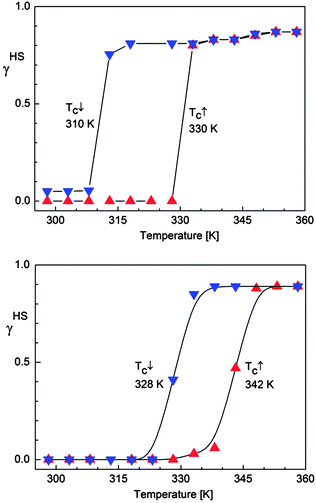 | ||
| Fig. 8 Temperature dependence of the HS molar fraction (γHS) deduced from 57Fe Mössbauer spectroscopy over the temperature range 298–360 K for SCO-1@MCM (top) and for SCO-2@MCM (bottom). | ||
SCO-2@MCM was investigated over the range 78–358 K by Mössbauer spectroscopy, first at 78 K and then on warming up to 358 K followed by a cooling cycle to 298 K. The spectrum at 78 K shows one quadrupole doublet attributed to LS FeII ions (δLS = 0.42(1) mm s−1 and ΔELSQ = 0.23(1) mm s−1) (Fig. 9). At room temperature, the hyperfine parameters of the LS state (Table 5) are in exact agreement with the ones of the pure material with (δLS = 0.43(1) mm s−1 and ΔELSQ = 0.29(1) mm s−1),17 thus indicating that the inclusion of [Fe(Htrz)2trz]BF4 in the MCM matrix neither changed its microstructure nor resulted in an oxidation. However, the spin state population is modified because 11% of HS ions detected at room temperature for SCO-2 are now switched to the LS state in the composite. Usually, this fraction of HS ions in the LS state is attributed to chain ends, i.e., the formation of short chains which end with a few percent of remaining water molecules.36 Thus the coordination polymerization would tend to proceed completely within the matrix. Another explanation could be that the remaining paramagnetic Fe spins having a FeN6 environment within the matrix would switch to the LS state due to a local pressure effect caused by the matrix. In both cases, a matrix influence is therefore identified. On warming up to 338 K, the composite remains in the LS state where a second doublet attributed to HS FeII ions grows slightly in intensity (7%), δHS = 0.98(1) mm s−1 and ΔEHSQ = 2.53(1) mm s−1 (Fig. 9). This behavior indicates the onset of a SCO behavior, a spin situation which differs from the pure material which only switches below 380 K,17 confirming a matrix influence on the spin state. On warming further, the HS signal (δHS = 0.95(1) mm s−1 and ΔEHSQ = 2.21(1) mm s−1) increases, revealing an asymmetric character, to reach 85% at 358 K. Worthwhile to note that the fraction of LS ions in the HS state is dramatically increased in the composite (Table 5) compared to the 3% detected in the pure material.17 On cooling, a hysteresis behavior is detected for the composite as seen in Fig. 9. The temperature dependence of the HS molar fraction shown in Fig. 8 allows to determine the width of the hysteresis loop ΔT = 14 K as well as the transition temperatures (T↑c = 342 K and T↓c = 328 K) which differ from the ones of the pure material (T↑c = 380 K and T↓c = 344 K) recorded by Mössbauer spectroscopy.17 Thus the hysteresis width is considerably reduced compared to the genuine material. In addition, the sharpness of the ST is also affected indicating a loss of cooperativity, and the hysteresis loop is shifted downwards.
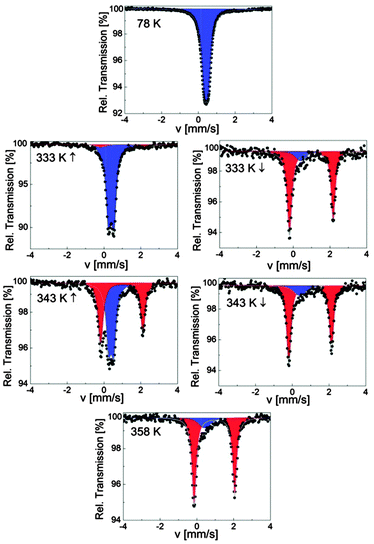 | ||
| Fig. 9 Selected 57Fe Mössbauer spectra of SCO-2@MCM; red and blue colors correspond to HS and LS doublets, respectively. | ||
| T [K] | δ [mm s−1] | ΔEQ [mm s−1] | Γ/2 [mm s−1] | Relative area [%] | Sites |
|---|---|---|---|---|---|
| a ↑ indicates warming and ↓ indicates cooling; δ = isomer shift relative to α-iron, ΔEQ = quadrupole splitting, Γ/2 = half width at half maximum. b Fixed parameter. | |||||
| 78 | 0.42(1) | 0.23(1) | 0.18(1) | 100 | LS |
| 298↑ | 0.43(1) | 0.28(1) | 0.14(1) | 100 | LS |
| 303↑ | 0.42(1) | 0.29(1) | 0.14(1) | 100 | LS |
| 308↑ | 0.42(1) | 0.29(1) | 0.14(1) | 100 | LS |
| 318↑ | 0.42(1) | 0.29(1) | 0.14(1) | 100 | LS |
| 323↑ | 0.42(1) | 0.29(1) | 0.14(1) | 100 | LS |
| 328↑ | 0.41(1) | 0.29(1) | 0.14(1) | 100 | LS |
| 333↑ | 0.40(1) | 0.29(1) | 0.15(1) | 100 | LS |
| 338↑ | 0.98(1) | 2.53(1) | 0.19b | 7.0 | HS |
| 0.39(1) | 0.29(1) | 0.15(1) | 93.0 | LS | |
| 343↑ | 0.97(1) | 2.29(1) | 0.15(1) | 47.0 | HS |
| 0.39(1) | 0.27(1) | 0.16(1) | 53.0 | LS | |
| 348↑ | 0.96(1) | 2.27(1) | 0.14(1) | 86.0 | HS |
| 0.41(1) | 0.29b | 0.37(1) | 14.0 | LS | |
| 353↑ | 0.96(1) | 2.25(1) | 0.15(1) | 86.0 | HS |
| 0.41(1) | 0.28b | 0.41(1) | 14.0 | LS | |
| 358↑ | 0.95(1) | 2.21(1) | 0.14(1) | 85.0 | HS |
| 0.41(1) | 0.28(3) | 0.32(2) | 14.0 | LS | |
| 343↓ | 0.97(1) | 2.32(1) | 0.14(1) | 85.0 | HS |
| 0.41(1) | 0.28b | 0.32(1) | 14.0 | LS | |
| 338↓ | 0.97(1) | 2.35(1) | 0.15(1) | 85.0 | HS |
| 0.41(1) | 0.28b | 0.32b | 14.0 | LS | |
| 333↓ | 0.98(1) | 2.37(1) | 0.14(1) | 85.0 | HS |
| 0.42(1) | 0.30b | 0.32b | 15.0 | LS | |
| 328↓ | 0.99(1) | 2.41(1) | 0.14(1) | 41.0 | HS |
| 0.40(1) | 0.30(1) | 0.16(1) | 59.0 | LS | |
| 323↓ | 0.44(1) | 0.27(1) | 0.11(1) | 100 | LS |
| 318↓ | 0.42(1) | 0.30(1) | 0.14(1) | 100 | LS |
| 313↓ | 0.43(1) | 0.29(1) | 0.12(1) | 100 | LS |
| 308↓ | 0.43(1) | 0.29(1) | 0.13(1) | 100 | LS |
| 303↓ | 0.41(1) | 0.31(1) | 0.16(1) | 100 | LS |
| 298↓ | 0.41(1) | 0.31(1) | 0.16(1) | 100 | LS |
DC magnetic measurements
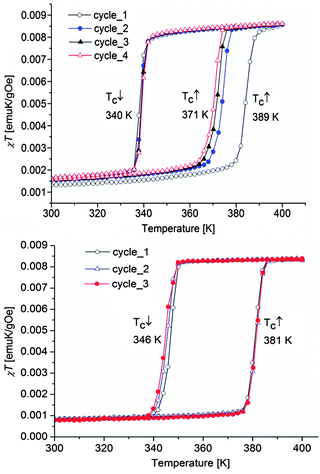
The magnetic properties of both composite materials are presented for comparison in Fig. 10. For SCO-1@MCM, the first cycle, from 200 K to 400 K, followed by a cooling to 200 K, reveals an abrupt hysteresis loop as large as 49 K, with T↑c = 389 K and T↓c = 340 K. This hysteresis is not stable, due to the expected water release on warming. Therefore, for the second cycle, the hysteresis falls down to 31 K and is fully reversible, with T↑c = 371 K and T↓c = 340 K. Compared to the magnetic data recorded on the pure material in the crystalline state, a clear shift of the ST upwards is observed. Indeed, [Fe(Htrz)3](BF4)2·H2O (SCO-1) displays a sharp ST at T↑c = 345 K and T↓c = 323 K while a lower hysteresis width is obtained for the dehydrated material with T↑c = 282 K and T↓c = 276 K.17The transition temperatures recorded for the Mössbauer studies of SCO-1@MCM show a hysteresis loop shifted downwards compared to SCO-1@MCM recorded by DC magnetic measurements which is expected due the time necessary to record each Mössbauer spectrum (one or two days in air atmosphere) which is enough to slowly partially dehydrate the material. As a result the hysteresis loop width by Mössbauer studies decreases to 20 K, with transition temperatures T↑c = 330 K and T↓c = 310 K (Fig. 8).
The SCO-2@MCM nanocomposite shows a fully reversible hysteresis loop of width 35 K, with T↑c = 381 K and T↓c = 346 K. Compared to the magnetic properties of the pure material, a slight shift downwards of the ST curve along with an hysteresis width decrease is noticed (bulk SCO-2: T↑c = 385 K and T↓c = 345 K).17
This result is consistent with theoretical predictions about a hysteresis reduction with particle size lowering.37 The shift was more pronounced for the ST of nanoparticles of SCO-2 coated with gold recorded by DC magnetic measurements with T↑c = 373 K and T↓c = 344 K.38,39 These two results however contradict earlier literature reports which indicate that the ST properties of this material are not modified when prepared as nanoparticles.40
Optical reflectivity measurements
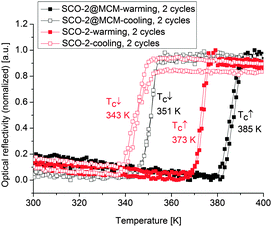
The SCO of iron(II) complexes with azole-based ligands is usually accompanied by a color change from purple in the LS state (lower temperature) to white in the HS state (higher temperature) (cf.Fig. 1).7 Hence, the change in spin state can also be followed by optical reflectance measurements in the solid state.41,42 The spin transitions of the SCO@MCM composites were studied optically under a nitrogen atmosphere to exclude any potential oxidation of the samples in air. The reflectance measurements were carried out using an optical disk cryostat mounted on the stage of a fluorescence microscope linked to a CCD camera. Before each set of measurements, the cryostat was purged for 2 h at 10 °C.The first cycle recorded on SCO-1@MCM reveals an abrupt transition upon heating and cooling with a hysteresis as large as 49 K (black curve in Fig. 11). However, the hysteresis loop is reduced to 31 K in the next cycles (blue and red curves in Fig. 11), most presumably due to dehydration. These results are consistent with literature data reporting a large hysteresis loop for the hydrated SCO-1 phase (T↑c = 336 K and T↓c = 323 K) and a narrow one for the dehydrated phase, (T↑c = 291 K and T↓c = 286 K).17 For the SCO-1@MCM material, a hydration/dehydration phenomenon was observed in this work (see also below). However, the phase transitions between the alpha and beta forms, known for the bulk SCO-1 were not observed.17 In the previous literature on SCO-117 the hydration/dehydration might have been ascribed to an alpha/beta phase transition. Compared to the literature data on optical reflectivity for the free SCO-1 compound, the transition temperatures for SCO-1@MCM are shifted upwards with T↑c = 376 K and T↓c = 345 K,17 which suggests a significant matrix effect.
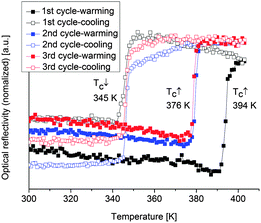 | ||
| Fig. 11 Thermal dependence of the normalized optical reflectivity of SCO-1@MCM at a scan rate of 2 K min−1. The transition temperatures recorded in warming and cooling modes are indicated. | ||
Optical reflectance measurements were recorded here for the first time on SCO-2 prepared as nanoparticles in the liquid state thanks to the reverse micelle method.40 A hysteresis loop with T↑c = 373 K and T↓c = 343 K was observed (Fig. 12), which differs for the transition temperature in the heating mode compared to previous reflectivity measurements in the bulk sample (not in a nano-form) in the crystalline state T↑c = 381 K and T↓c = 347 K.17
The SCO-2 compound embedded in the MCM matrix shows a ST at T↑c = 385 K and T↓c = 351 K with a hysteresis of about 35 K (Fig. 12), hence of the same width as the bulk sample but slightly shifted upwards. This behavior is different to what was observed in the case of SCO-1@MCM.
Differential scanning calorimetry measurements
DSC measurements of SCO-2 reveal a sharp endothermic peak on warming and an exothermic peak on cooling at T↑max = 387 K and T↓c = 343 K, respectively. SCO-2@MCM reveals a similar pattern with a shift in temperature upwards at T↑max = 390 K and T↓c = 355 K, both at 10 K min−1 (Fig. 13).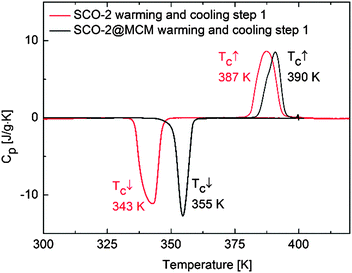 | ||
| Fig. 13 Heat capacity versus temperature for SCO-2 and SCO-2@MCM recorded by differential scanning calorimetry at 10 K min−1. | ||
Comparison
We attribute the strong matrix effect in SCO-1@MCM to the compound being embedded between the pore walls with a pressure mediator (see below). The HS state has elongated Fe–ligand bond lengths (Fe–N ≈ 2.1–2.2 Å) compared to the LS state (Fe–N ≈ 1.9–2.0 Å) thereby requiring more space. Thus, the ST has to operate against the higher pressure exerted by the pore walls of the MCM matrix. In other words, higher external pressure favors the LS state so that the LS → HS transition occurs at higher molecular energy level, i.e., temperature.Table 2 provides a summarizing overview of the spin transition temperatures for the SCO and SCO@MCM materials from the different methods (for the hysteresis value included see Table S1 in ESI†).
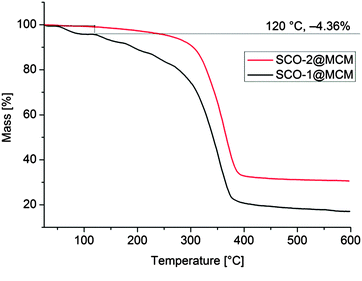
It is worth to notice that, from Mössbauer, DC magnetic and optical reflectivity measurements, a strong matrix effect is found only for SCO-1@MCM, whereas the matrix effect for SCO-2@MCM is much weaker. We trace this to the hydration of SCO-1, which contains crystal water (Fig. 14) and suggest that water is important as a “pressure mediator” for delivering the “hydrostatic pressure” to induce a significant matrix effect. However, the specific reasons of the action of crystal water still need further investigation. The crystal water in SCO-1@MCM is partly lost upon heating to 127 °C (400 K) (cf.Fig. 14) which explains the shifts from the first to the second cycle in the warming temperatures (T↑c) in Fig. 10 and 11.
Conclusions
Composite materials made of MCM-41 and of two 1D SCO compounds, namely [Fe(Htrz)3](BF4)2·H2O (SCO-1) and [Fe(Htrz)2trz]BF4 (SCO-2) were successfully prepared in a form of embedded nanoobjects with 2 nm cross-section. Although, as concluded from the 57Fe Mössbauer spectroscopy, the 1D chain is separated from the walls of the host matrix, a pressure effect was identified for SCO-1@MCM by temperature-variable magnetic and optical reflectance measurements, causing the spin transition to be shifted to higher temperatures, compared to the bulk material. For SCO-1@MCM the LS → HS transition (T↑c) was increased by 44–58 K and the HS → LS transition (T↓c) by 17–22 K in comparison to bulk SCO-1 during the first warming-cooling cycle. During the first warming to about 400 K partial dehydration occurs. For the partially dehydrated SCO-1@MCM material this shift was even more pronounced with T↑c increased by 85–89 K and T↓c increased by 59–64 K relative to bulk SCO-1. The range given reflects the values from two different methods (temperature-variable magnetic and optical reflectance measurements). Also, the hysteresis between T↑c and T↓c increases by 26–33 K when placing SCO-1 into the MCM-41 matrix (Table S1 in ESI†). In the case of SCO-2@MCM this pressure or matrix effect only becomes evident upon comparison to a nanoSCO-2 reference material which was done by the optical reflectance measurements. The significant difference in matrix effect on the SCO behavior of the similar materials SCO-1 and SCO-2 is traced to the hydration of the SCO-1 and SCO-1@MCM material. This hydration is only partially lost during the first heating cycle which is additional evidence to the change of transition parameters and the role of water. Water is apparently crucial in exerting a confinement pressure or matrix effect on the spin transition (Fig. 15).Experimental section
Materials
Iron(II) tetrafluoroborate hexahydrate (Fe(BF4)2·6H2O, Aldrich), 1,2,4-4H-triazole (99%, Alfa Aesar), and mesostructured silica (MCM-41 type, Aldrich; unit cell size: 4.5–4.8 nm; 0.98 cm3 g−1 pore volume; 2.1–2.7 nm pore size; BET surface area ∼ 1000 m2 g−1) were used as received without further purification.Instrumentation
Synthesis of SCO@MCM and SCO materials
Bulk SCO-1 and SCO-2 was synthesized according to ref. 17; see in ESI† for the analytical data. Nanoparticles of SCO-2 for optical reflectivity measurements were prepared as a purple solution following a procedure described in ref. 40, see in ESI† for the analytical data.Washing procedure. Any SCO precipitate, which formed on the outer MCM surface, was removed by washing procedures. SCO-1@MCM was washed three times with water because SCO-1 is very easy dissolved in water.
For SCO-2@MCM, the solid product was first placed in a beaker, stirred for 2 h with water and separated by centrifugation. This step was repeated 3 times. Then the solvent was changed to ethanol, stirred for 2 h again and centrifuged. The ethanol washing was repeated until no pink color appeared in the supernatant.
Mössbauer studies
57Fe Mössbauer spectra were recorded in transmission geometry using a Wissel spectrometer, equipped with a 57Co(Rh) source from Cyclotron Ltd and fitted to an Oxford Instruments bath cryostat for low temperature measurements. Samples were inserted into aluminium foils for the low temperature measurements. Measurements above room temperature were carried out with a Wissel Furnace MBF-1100. The sample was fixed between two round plates of B4C, made of heat- and corrosion-resistant steel with high nickel content. The sample holder and heat screens were positioned in quartz tubes in air atmosphere. Spectra were fitted to a sum of Lorentzian line shapes by least-squares refinement using Recoil 1.05 Mössbauer Analysis Software.43Magnetic measurements
DC magnetic measurements were performed by using a Quantum Design MPMS XL-5 SQUID magnetometer. For both samples, magnetization measurements were carried out in a magnetic field of 1000 Oe, starting from 200 K up to 400 K (heating), and then cooling back to 200 K. No attempt was made to evaluate the molar magnetic susceptibility.Optical reflectance measurements
Thermal dependence of the optical reflectance has been carried out at 2 K min−1, with a Linkam optical cryostat mounted on the stage of an Olympus BX51 fluorescence microscope linked to a CCD camera. Data were treated using ImageJ software (Wayne Rasband, National Institute of Mental Health, Bethesda, Maryland, USA).Differential scanning calorimetry measurements
DSC were carried out in a He(g) atmosphere using a Perkin-Elmer DSC Pyris 1 instrument equipped with a cryostat and operating down to 98 K. Aluminum capsules were loaded with 20–50 mg of sample and sealed. The heating and cooling rates were fixed at 10 K min−1. Temperatures and enthalpies were calibrated over the temperature range of interest (298–400 K) using the solid–liquid transitions of pure indium (99.99%)44 over the range 78–298 K.Acknowledgements
We acknowledge financial support from the Fonds National de la Recherche Scientifique (FNRS) (FRFC 2.4537.12), Walloon region (MELMINK), Romanian National Authority for Scientific Research, CNCS – UEFISCDI, (project number PN-II-RU-TE-2011-3-0307), Romanian Academy – WBI and DG06 (MEMLINK). T. Z. thanks the China Scholarship Council (CSC) for a doctoral fellowship and I. B. thanks the Alexander von Humboldt foundation for a postdoctoral fellowship. We also acknowledge the COST actions MP1202 and CM1305, and thank the Fonds pour la Formation à la Recherche dans l’ Industrie et dans l’ Agriculture for scholarship allocated to L. C. M., and the Fonds National de la Recherche Scientifique for a chargé de recherches position allocated to M. M. D.Notes and references
- P. Gütlich, A. B. Gaspar and Y. Garcia, Beilstein J. Org. Chem., 2013, 9, 342–391 CrossRef PubMed.
- J. Linares, E. Codjovi and Y. Garcia, Sensors, 2012, 12, 4479–4492 CrossRef CAS PubMed.
- M. B. Duriska, S. M. Neville, B. Moubaraki, J. D. Cashion, G. J. Halder, K. W. Chapman, C. Balde, J.-F. Létard, K. S. Murray, C. J. Kepert and S. R. Batten, Angew. Chem., 2009, 121, 2587–2590 CrossRef PubMed.
- N. Moliner, L. Salmon, L. Capes, M. C. Muñoz, J.-F. Létard, A. Bousseksou, J.-P. Tuchagues, J. J. McGarvey, A. C. Dennis, M. Castro, R. Burriel and J. A. Real, J. Phys. Chem. B, 2002, 106, 4276–4283 CrossRef CAS.
- A. Galet, A. B. Gaspar, G. Agusti, M. C. Muñoz, G. Levchenko and J. A. Real, Eur. J. Inorg. Chem., 2006, 3571–3573 CrossRef CAS PubMed.
- P. Gütlich, A. Hauser and H. Spiering, Angew. Chem., Int. Ed. Engl., 1994, 33, 2024–2054 CrossRef PubMed.
- C. Janiak, T. G. Scharmann, J. C. Green, R. P. G. Parkin, M. J. Kolm, E. Riedel, W. Mickler, J. Elguero, R. M. Claramunt and D. Sanz, Chem. – Eur. J., 1996, 2, 992–1000 CrossRef CAS PubMed; C. Janiak, T. G. Scharmann, T. Bräuniger, J. Holubová and M. Nádvornik, Z. Anorg. Allg. Chem., 1998, 624, 769–774 CrossRef; C. Janiak, Chem. Ber., 1994, 127, 1379–1385 CrossRef PubMed.
- M. Rubio, R. Hernández, A. Nogales, A. Roigand and D. López, Eur. Polym. J., 2011, 47, 52–60 CrossRef CAS PubMed.
- J. Panda, S. Chattopadhyay and T. K. Nath, Thin Solid Films, 2013, 546, 211–218 CrossRef CAS PubMed.
- A. Tissot, J.-F. Bardeau, E. Rivière, F. Brisseta and M.-L. Boillot, Dalton Trans., 2010, 39, 7806–7812 RSC.
- Y. Raza, F. Volatron, S. Moldovan, O. Ersen, V. Huc, C. Martini, F. Brisset, A. Gloter, O. Stephan, A. Bousseksou, L. Catala and T. Mallah, Chem. Commun., 2011, 47, 11501–11503 RSC.
- E. Codjovi, N. Menéndez, J. Jeftic and F. Varret, C. R. Acad. Sci. Paris, 2001, 4, 181–188 CAS.
- B. L. Guennic, S. Borshch and V. Robert, Inorg. Chem., 2007, 46, 11106–11111 CrossRef PubMed.
- D. Chiruta, J. Linares, M. Dimian, Y. Alayli and Y. Garcia, Eur. J. Inorg. Chem., 2013, 5086–5093 CrossRef CAS PubMed.
- L. Stoleriu, P. Chakraborty, A. Hauser, A. Stancu and C. Enachescu, Phys. Rev. B: Condens. Matter Mater. Phys., 2011, 84, 134102 CrossRef.
- L. G. Lavrenova, V. N. Ikorskii, V. A. Varnek, I. M. Oglezneva and S. V. Larionov, Koord. Khim., 1990, 16, 654–661 CAS.
- J. Kröber, J.-P. Audière, R. Claude, E. Codjovi, O. Kahn, J. G. Haasnoot, D. Grolière, C. Jay and A. Gonthier-Vassal, Chem. Mater., 1994, 6, 1404–1412 CrossRef.
- K. H Sugiyarto and H. A. Goodwin, Aust. J. Chem., 1994, 47, 263–277 CrossRef.
- (a) C. Faulmann, J. Chahine, I. Malfant, D. de Caro, B. Cormary and L. Valade, Dalton Trans., 2011, 40, 2480–2485 RSC; (b) P. Durand, S. Pillet, E.-E. Bendeif, C. Carteret, M. Bouazaoui, H. El Hamzaoui, B. Capoen, L. Salmon, S. Hebert, J. Ghanbaja, L. Aranda and D. Schaniel, J. Mater. Chem. C, 2013, 1, 1933–1942 RSC.
- D. Qiu, D.-H. Ren, L. Gu, X.-L. Sun, T.-T. Qu, Z.-G. Gu and Z. Li, RSC Adv., 2014, 4, 31323–31327 RSC.
- I. Suleimanov, J. Sanchez Costa, G. Molnar, L. Salmon and A. Bousseksou, Chem. Commun., 2014, 50, 13015–13018 RSC.
- A. Stein, B. H. Melde and R. C. Schroden, Adv. Mater., 2000, 12, 1403–1419 CrossRef CAS.
- M. Gomes Speziali, A. G. Marques da Silva, D. M. Vaz de Miranda, A. Lisboa Monteiro and P. A. Robles-Dutenhefner, Appl. Catal., A, 2013, 462–463, 39–45 CrossRef PubMed.
- R. Huang, B. Lan, Z. Chen, H. Yan, Q. Zhang, J. Bing and L. Li, Chem. Eng. J., 2012, 180, 19–24 CrossRef CAS PubMed.
- Z. Obalı, N. A. Sezgi and T. Dŏgu, Chem. Eng. J., 2011, 176–177, 202–210 CrossRef PubMed.
- K. S. W. Sing, D. H. Everett, R. A. W. Haul, L. Moscou, R. A. Pierotti, J. Rouquerol and T. Siemieniewska, Pure Appl. Chem., 1985, 57, 603–619 CrossRef CAS.
- A. J. Palace Carvalho, T. Ferreirab, A. J. Estévaõ Candeiasa and J. P. Prates Ramalho, THEOCHEM, 2005, 729, 65–69 CrossRef PubMed.
- H. Wu, X. Li, Y. Li, S. Wang, R. Guo, Z. Jiang, C. Wu, Q. Xin and X. Lu, J. Membr. Sci., 2014, 465, 78–90 CrossRef CAS PubMed.
- P. Carraro, V. Elías, A. G. Blanco, K. Sapag, S. Moreno, M. Oliva and G. Eimer, Microporous Mesoporous Mater., 2014, 191, 103–111 CrossRef CAS PubMed.
- Y. Wang, L. Sun, T. Jiang, J. Zhang, C. Zhang, C. Sun, Y. Deng, J. Sun and S. Wang, Drug Dev. Ind. Pharm., 2014, 40, 819–828 CrossRef CAS PubMed.
- F. Rodriguez-Reinoso and A. Linares-Solano, in Chemistry and Physics of Carbon, ed. P. A. Thrower, Marcel Dekker, New York, vol. 21, 1988 Search PubMed.
- J. Garrido, A. Linares-Solano, J. M. Martin-Martinez, M. Molina-Sabio, F. Rodriguez-Reinoso and R. Torregosa, Langmuir, 1987, 3, 76–81 CrossRef CAS; D. Cazorla-Amoros, J. Alcaniz-Monje and A. Linares-Solano, Langmuir, 1996, 12, 2820–2824 CrossRef; J. Garcia-Martinez and D. Cazorla-Amoros and A. Linares-Solano, in Characterization of Porous Solids V, ed. K. K. Unger, G. Kreysa and J. P. Baselt, Elsevier, Amsterdam, 2000, pp. 485–494 Search PubMed.
- Quantachrome Instruments (1900 Corporate Drive, Boynton Beach, FL 33426 USA, http://www.quantachrome.com) Powder Tech Note 35.
- A. Bhunia, I. Boldog, A. Möller and C. Janiak, J. Mater. Chem. A, 2013, 1, 14990–14999 CAS.
- Y. Garcia, V. Ksenofontov and P. Gütlich, C. R. Acad. Sci., 2001, IIc, 227–233 Search PubMed.
- Y. Garcia, P. J. van Koningsbruggen, R. Lapouyade, L. Fournès, L. Rabardel, O. Kahn, V. Ksenofontov, G. Levchenko and P. Gütlich, Chem. Mater., 1998, 10, 2426–2433 CrossRef CAS.
- T. Kawamoto and S. Abe, Chem. Commun., 2005, 3933–3935 RSC.
- Y. A. Tobon, C. Etrillard, O. Nguyen, J.-F. Létard, V. Faramarzi, J.-F. Dayen, B. Doudin, D. M. Bassani and F. Guillaume, Eur. J. Inorg. Chem., 2012, 5837–5842 CrossRef CAS PubMed.
- In ref. 38, the experimental section mentions that magnetic properties were recorded on nanoparticles of [Fe(Htrz)2trz]BF4 whereas the caption to Fig. 3 in there refers to the monohydrate material.
- (a) E. Coronado, J. R. Galán-Mascarós, M. Monrabal-Capilla, J. García-Martínez and P. Pardo-Ibáñez, Adv. Mater., 2007, 19, 1359–1361 CrossRef CAS PubMed; (b) J. R. Galán-Mascarós, E. Coronado, A. Forment-Aliaga, M. Monrabal-Capilla, E. Pinilla-Cienfuegos and M. Ceolin, Inorg. Chem., 2010, 49, 5706–5714 CrossRef PubMed.
- V. Martínez, A. B. Gaspar, M. C. Muñoz, G. V. Bukin, G. G. Levchenko and J. A. Real, Chem. – Eur. J., 2009, 15, 10960–10971 CrossRef PubMed.
- G. Levchenko, G. V. Bukin, S. A. Terekhov, A. B. Gaspar, V. Martinez, M. C. Muñoz and J. A. Real, J. Phys. Chem. B, 2011, 115, 8176–8182 CrossRef CAS PubMed.
- K. Lagarec and D. G. Rancourt, Mössbauer Spectral Analysis Software for Windows 1.0, Department of Physics, University of Ottawa, Canada, 1998 Search PubMed.
- K. H. Breuer and W. Eysel, Thermochim. Acta, 1982, 57, 317–329 CrossRef CAS.
Footnote |
| † Electronic supplementary information (ESI) available. See DOI: 10.1039/c5tc00311c |
| This journal is © The Royal Society of Chemistry 2015 |

