
 Open Access Article
 This Open Access Article is licensed under a
 Creative Commons Attribution 3.0 Unported Licence
Red to near infrared ultralong lasting luminescence from Mn2+-doped sodium gallium aluminum germanate glasses and (Al,Ga)-albite glass-ceramics
Pengfei
Li
a,
Mingying
Peng
*a,
Lothar
Wondraczek
b,
Yanqi
Zhao
a and
Bruno
Viana
c
aThe China-Germany Research Center for Photonic Materials and Devices, The State Key Laboratory of Luminescent Materials and Devices, School of Materials Science and Engineering, South China University of Technology, Guangzhou 510641, China. E-mail: pengmingying@scut.edu.cn
bOtto Schott Institute of Materials Research, University of Jena, 07743 Jena, Germany
cIRCP Chimie ParisTech, 11 rue Pierre et Marie Curie, 75231 Paris Cedex 05, France
First published on 17th February 2015
Abstract
For specific techniques of bioimaging or photodynamic tumor therapy, it is highly desirable to find a luminescent material with emission wavelengths within the region of transparency of biological tissue, i.e., 650 – 1300 nm, and with multiple-hour luminescence afterglow. Here, we demonstrate red to near-infrared persistent luminescence from Mn2+ doped sodium gallium aluminum germanate glasses, covering the spectral region of 600 to 800 nm. Persistent luminescence from octahedral Mn2+ is associated with the presence of electronic defects with depths of 0.71 eV, 0.80 eV and 1.06 eV, which de-trap thermally at ambient temperature. The process of de-trapping occurs over a time of more than 40 h. When nanocrystalline high-albite Na(Al,Ga)Ge3O8 is precipitated from the supercooled melt through controlled thermal annealing, the red afterglow can be preserved, and the afterglow duration can be further extended to more than 100 h. This originates from the incorporation of Mn2+ on octahedral lattice sites with a more ionic bonding character in the compound, and a significant increase of defect density with, at the same time, decreasing depth, i.e., 0.70 eV, 0.75 eV and 0.85 eV. The observed properties suggest that the Mn2+ doped Na(Al,Ga)Ge3O8 nanocrystal may provide a new solution to in vivo bioimaging or photodynamic tumor therapy.
1. Introduction
Afterglow luminescence, i.e., luminescence which persists when the external illumination source has been removed, has been known for several centuries. This phenomenon has found a wide range of applications, e.g., for emergency escape routes and exit signs, indoor and outdoor decoration or toys, optical data storage, lighting, temperature sensors or sensors for detecting structural failure.1–5 The versatility of materials with useful phosphorescence properties, however, and, in particular, the availability of various emission colors have been surprisingly limited until the last two decades, when, besides the above mentioned applications, new fields of interest emerged in biomedical sensing and imaging. Chen et al.6 demonstrated X-ray induced persistent luminescent nanoparticles for photodynamic treatment of cancer. They grafted the nanoparticles with photosensitizers which could be excited in situ by the afterglow light released from nanoparticles.6 The excited photosensitizer can subsequently transform triplet oxygen into the singlet state, which has been considered as a way to kill tumor cells. The overall idea was to enable a more localized tumor treatment and, hence, reduce the need for invasive treatment. Le Masne De Chermont et al.7 reported on the use of persistent luminescence as a fluorescent probe for in vivo tumor imaging. This was enabled by an afterglow duration of more than one hour after removing the excitation source. Then, the luminescent probe does not need to be excited with external light sources during imaging which avoids signal interference with the autofluorescence of the analyzed tissue. It was demonstrated that notable improvements in image quality and the signal-to-noise-ratio can be obtained in that way. These two promising applications have soon turned persistent luminescence materials into very hot research topics in the following years.8–13The two essential applications necessitate the persistent luminescence materials with suitable emission wavelengths and afterglow time. The emission should better occur in the transparency window of biological tissue, i.e., in the spectral range of ∼650–1300 nm. The afterglow time should better be longer than a few hours. It is the aim of our work to find such candidate materials.
This actually has stimulated the search for promising materials, and it has led to the series of findings. These include rare earth (RE) or transition metal (TM) doped persistent phosphors.12–23 For RE-based phosphors, latest advances are on Eu2+-doped nitrides and Eu3+-doped tungstates, e.g., M2Si5N8:Eu2+ or MWO4:Eu3+.22,23 Their emission, however, peaks at wavelengths below 650 nm, and the afterglow time is typically less than one hour.23 So far as we know, the most promising phosphors are trivalent chromium doped gallates.4,11,12,21 Pan et al.4 reported an afterglow duration longer than 360 h as Zn and Ge were substituted for Ga sites. In those materials, luminescence covers the spectral range of 680 to 750 nm, due to the Cr3+ transition 2E → 4A2 in the octahedral surroundings.
For TM-based persistent phosphors, there are also reports on Mn2+ doped persistent phosphors but mainly centering on silicate, germanate or phosphates.9,21,24–27 The luminescence mostly occurs over the spectral range of 600 to 750 nm, and it comes from the octahedral sites of Mn2+ (VIMn2+) once doped into the crystalline phase.28 Mn2+ doped glasses were also reported with red emissions with lifetime in the millisecond regime such as zinc borosilicates and germanates.29–34 As the glass samples were devitrified, it has been found that Mn2+ emission will turn into green emission32–35 This is because usually tetrahedral cation sites are predominant in the crystals precipitated inside glass, and Mn2+ ions will be driven into the tetrahedral lattice sites in the weak crystal field during the crystallization process. So far, the afterglow of VIMn2+-related red photoemission is seldom longer than one hour either in crystals, glasses or glass ceramics. There are also very few report on glass ceramics which can stabilize VIMn2+ emission centers in crystalline rather than the glass phase. Is it possible inside a glass to precipitate a crystalline phase which comprises octahedral host cationic sites in which Mn2+ ions prefer to reside? If so, will the Mn2+ luminescent afterglow be longer than one hour?
In this work, we select germanate glass as a target host because Mn2+ red afterglow has been found in the glass system and the glow duration has not been mentioned yet.33–37 We are looking for a glass and a glass ceramic system in which, upon devitrification, Mn2+ will remain in octahedral coordination, but will at least partially be incorporated into the crystal phase (rather than being accumulated in the residual glass phase). We select Mn2+ as the activator ions rather than Cr3+. This is partially because Mn2+ can show similar red to near infrared emission to Cr3+, and partially because Cr3+ containing materials once exposed to oxygen rich environments will tend to be oxidized perhaps into higher valence states such as Cr6+. This species is highly toxic and easily leads to cancer once entering into the human body. Since Cr3+ exhibits the outstanding persistent luminescence in gallate, we introduced gallium on purpose into the germanate glass and wish it could help improving Mn2+ afterglow properties.4,13,21,38 Besides, we added percentage of glass modifier ions Na+, which can breakdown the germanate glass network and therefore lower the melting temperature.
We show in the following that Mn2+-doped sodium gallium germanate glass indeed exhibit red persistence luminescence in the spectral range of 600 nm to 800 nm and afterglow can persist longer than 48 hours at a dopant content of 0.1% Mn2+. Out of our expectation is that the nanocrystalline Na(Ga,Al)Ge3O8 phase can be precipitated from the supercooled melt and it comprises of the sodium octahedral sites and the aluminum/germanium/gallium sites. Mn2+ doped glass ceramics can preserve the red emission of Mn2+ ions which substitute for sodium sites in Na(Ga,Al)Ge3O8 (see Fig. 1), and in the meanwhile, the emission intensity can be enhanced while the persistence of luminescence can be improved longer than 100 h. We have employed different techniques such as static and dynamic excitation and photoluminescence spectra, electron paramagnetic resonance spectrum, thermoluminescence, the time resolved emission spectrum, high resolution transmission electron microscopy, etc. to unravel how the red persistent luminescence of Mn2+ comes into being and why it can be significantly improved in glass ceramic samples, and evaluate whether it can find application in tumor bioimaging or photodynamic therapy.
 | ||
| Fig. 1 Unit cell of NaAlGe3O8 drawn on the basis of crystallographic data on ICSD #61170. | ||
2. Experimental
2.1. Syntheses
All glass samples were produced through conventional melting at high temperature and subsequent quenching. For this, analytical grade reagents Na2CO3 and MnCO3, and high pure GeO2 (5N) and Ga2O3 (4N) were used as the starting materials. Batches of 20 g were weighed accurately according to the molar composition 8Na2O–12Ga2O3–80GeO2. MnCO3 was added for Mn2+-doping in nominal quantities of 0–3.0 mol%. The batches were thoroughly mixed and filled into alumina crucibles. Each batch was then melted in a resistively heated furnace at 1550 °C for 30 min under ambient atmosphere. The melts were poured onto a preheated stainless steel plate and splash-cooled by pressing with another stainless steel stamp. The solidified samples were subsequently annealed at 350 °C for 10 h. Thus obtained visually transparent and colorless glass samples were cut into a size of 10 mm × 10 mm × 1 mm and polished for the following optical analyses and heat treatment procedures. For referencing, labels G-Mn-x are used, where x stands for the nominal amount of added Mn2+ in mol%. Differential scanning calorimetry was used to determine the peak temperature of crystallization, Tc = 695 °C for G-Mn-0.1. Crystallization treatments of this latter sample were performed at this temperature for holding times of 0.5 h, 1 h, 2 h and 5 h. In the following, these samples are labelled GC-0.5h, GC-1h, GC-2h and GC-5h, respectively.2.2. Characterization
Static excitation and photoluminescence (PL) spectra, emission lifetime data and dynamic emission decay spectra were recorded on a high resolution spectrofluorometer (Edingburgh Instruments FLS 920), equipped with a red-sensitive single photon counting photomultiplier (Hamamatsu R928P) in a Peltier air-cooled housing over the spectral range of 200 to 900 nm. A pulsed xenon flash lamp (pulse duration – ms, μF900) with an average power of 60 W, and a 450 W xenon lamp were used as excitation sources, respectively, for the emission decay curves and the steady-state measurements. Absorption spectra were recorded using a UV/VIS/NIR spectrophotometer (Lambda-900, PerkinElmer, USA). Differential scanning calorimetry (DSC) was performed with a STA449C Jupiter (Netzsch, Germany) in ambient atmosphere at a heating rate of 10 K min−1 in the range from 20 to 1200 °C. X-ray diffraction (XRD) patterns of the glass-ceramics were recorded with a Rigaku D/max-IIIA X-ray diffractometer (40 kV, 1.2° min−1, 40 mA, Cu-Kα1, λ = 1.5405 Å). The crystal morphology and size distribution were analyzed using a high-resolution transmission electron microscope (HRTEM, 2100F, JEOL, Japan), equipped with an energy-dispersive spectrometer (EDS) system to map the chemical element distribution. Electron paramagnetic resonance (EPR) spectra were recorded at 85 K using an X-band spectrometer (Bruker A300).The afterglow decay curves and thermoluminescence (TL) curves were measured with a FJ427A1 thermoluminescent dosimeter (CNNC Beijing Nuclear Instrument Factory). Before each measurement, the samples were first heated to 250 °C to completely de-trap all electrons and to heal-out eventual pre-existing (shallow) defects. An amount of 0.005 g of powder was weighed for each sample and exposed to 254 nm illumination from a mercury lamp at an output power of 60 W for 5 min. Subsequently, with a total delay time of 30 s after removal of the excitation source, photoluminescence decay curves were recorded. After a total delay of 10 min, TL curves where recorded. The range of the TL curves measurement was from room temperature (RT) to 250 °C with a scanning rate of 1 °C s−1. If not otherwise stated, all other measurements were performed at room temperature.
3. Results and discussion
3.1. Photoluminescence from VIMn2+ doped germanate glass
All the Mn2+-doped or undoped germanate glasses are visually colorless and transparent. When exposed to 254 nm irradiation, red photoemission is readily visible in all Mn2+-doped samples, whereas the undoped samples do not exhibit red PL. The red PL is therefore clearly assigned to the presence of manganese. Exemplary EPR spectra of glassy and glass ceramic samples are shown in Fig. 2. The typical sextet structure with a resonance at g = 1.9941 is associated with magnetic dipolar transitions of Mn2+ in a highly symmetric state.39 The hyperfine splitting which is observed in G-Mn-0.1 is indicative of isolated Mn2+ ions, similar to observations in other glasses.28,40 In the glass ceramic samples GC-1h and GC-5h, the sextet is less clearly visible. While it is not fully quenched-out, this points to weak Mn2+–Mn2+ magnetic interactions. We see a sharpening of the main resonance, now at g = 1.9933, with progressing time of crystallization treatment, but the width and constriction of the signal remain practically unchanged during crystallization. The latter indicates that there is no increase in the magnetic interactions between Mn2+ ions during crystallization, which would have resulted in exchange narrowing of the signal.28 This is an important observation as it indicates that during crystallization, there is no notable agglomeration of Mn2+ species in the residual glass phase and, hence, that Mn2+ is incorporated into the crystalline phase. The EPR linewidth of the main signal is about 40 mT for all samples, which is rather low and indicates the presence of edge-sharing VIMn2+ polyhedra. As will be discussed later, this is in good agreement with the crystallographic analyses which evidence the presence of triclinic high-albite, Na(Al,Ga)Ge3O8, in which Mn2+ may be incorporated into the octahedral sites edge-shared with the tetrahedral sites. The slight but significant down-shift in the g-value reflects a change in the bond character to more ionic bonding. | ||
| Fig. 2 Electron paramagnetic resonance (EPR) spectra of glass sample G-Mn-0.1 and glass-ceramic samples GC-1h and GC-5h measured at 85 K. | ||
Photoluminescence spectra of all samples are shown in Fig. 3a. Upon excitation at 250 nm, all doped glasses show a pronounced, broad emission band spanning the spectral range of 550 nm to 800 nm, originating from the spin-forbidden 4T1(4G) → 6A1(6S) transition in VIMn2+.30–32,41–44 With the increasing manganese content, the emission peak red-shifts gradually (Fig. 3a). At the same time, the emission intensity increases up to x = 2.0, and decreases for higher x, apparently due to concentration quenching. The PL decay curve follows-well a single exponential function for as long as x ≤ 0.5. At higher x, a multi-exponential function is required to fit the experimental decay data, indicating that at least two different emission species are active in these cases (Fig. 3c).
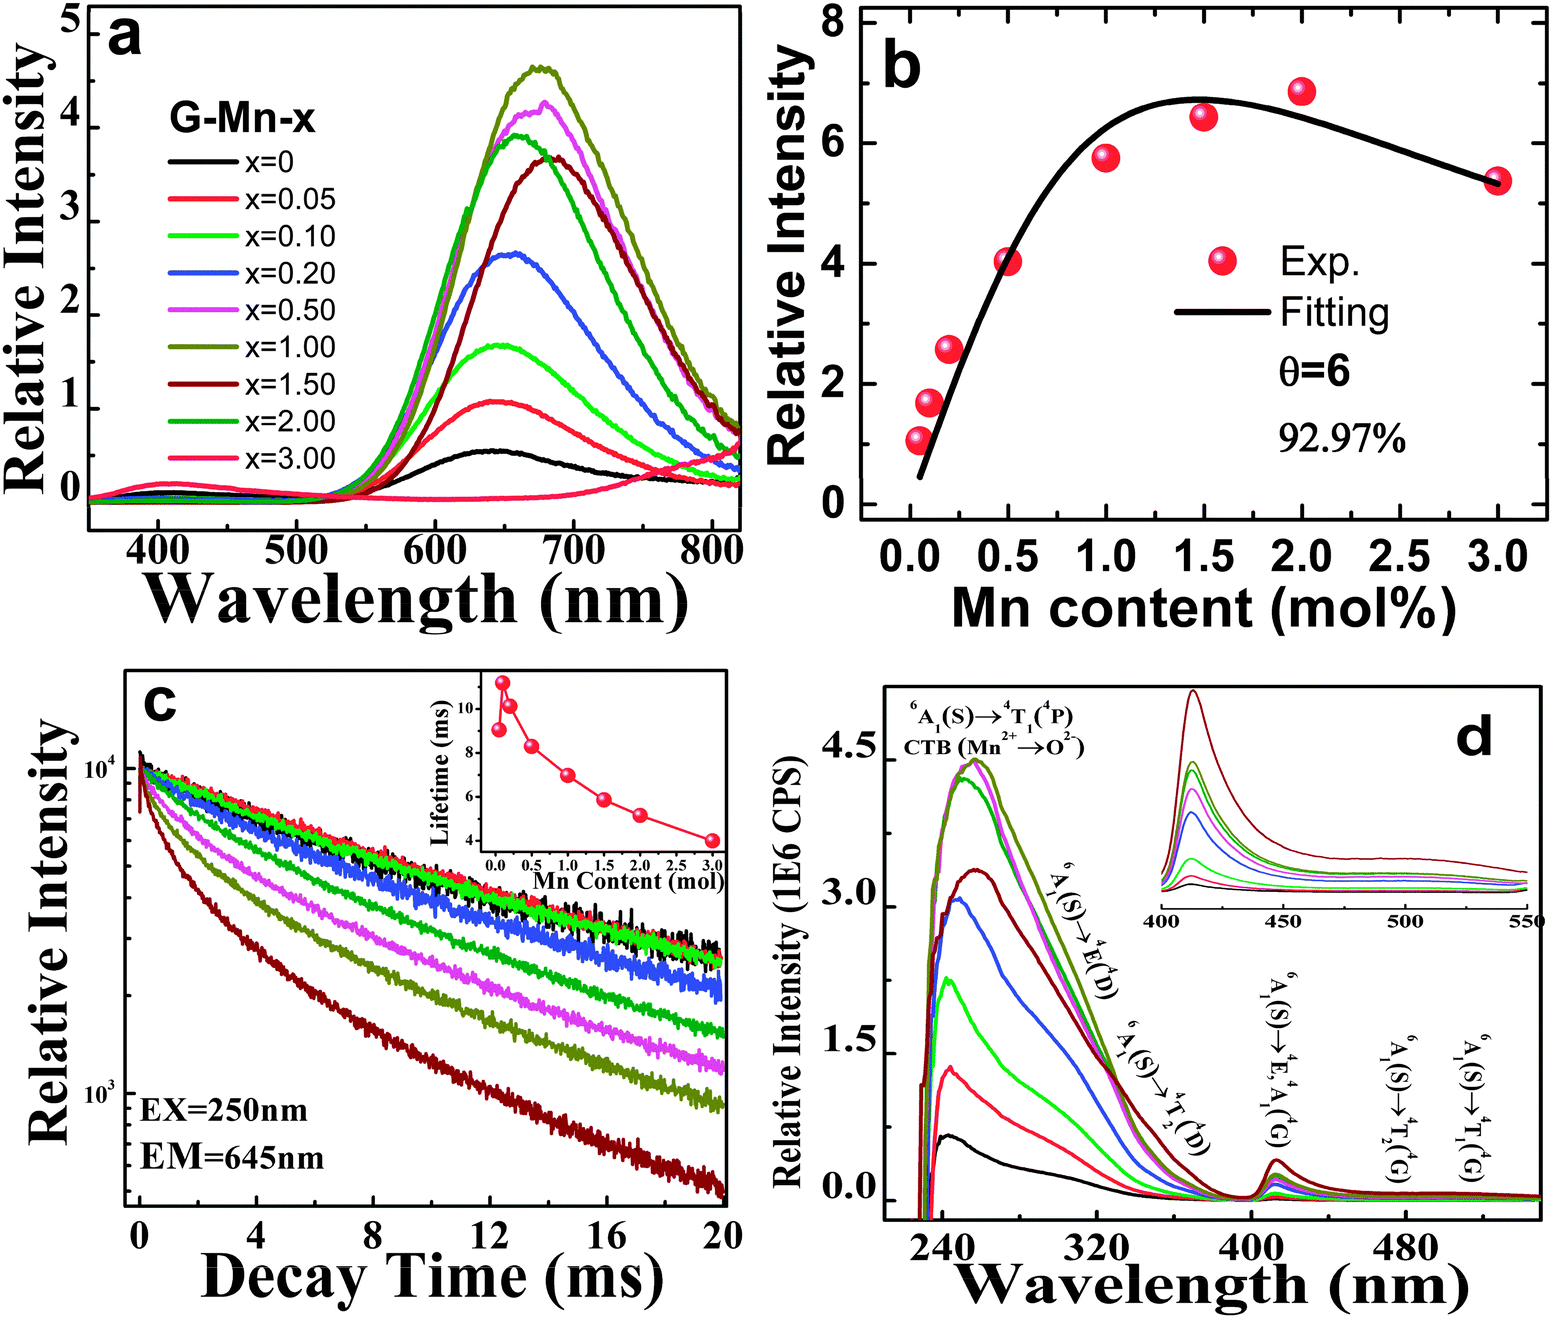 | ||
| Fig. 3 (a) Emission spectra (λex = 250 nm) of as-prepared glass samples G-Mn-x, the values of Mn content x are indicated; (b) integrated emission intensities versus the Mn content x. Fitting to eqn (1) is performed with k = 9.1 ± 1.0, β = 1.8 ± 0.37, and θ = 6, depicted as the solid black line; (c) emission decay curve for glass samples G-Mn-x (λex = 250 nm, λem = 645 nm), the inset shows the dependence of lifetime on the Mn content x. (d) Excitation spectra (λem = 645 nm) of glass samples G-Mn-x, the inset shows the enlarged spectra in 400 to 550 nm. | ||
For a persistent luminescent material, the luminescence persistence is contributed by the activator lifetime, and the detrapping time which corresponds to the time when electrons are thermally discharged from the defect centers and then transferred to the activator, here Mn2+. To qualitatively understand how the PL lifetime changes with Mn2+ content, we define the PL lifetime as the time when the PL intensity decreases to the e−1 fold of the initial intensity. This was produced by fitting each curve to a single exponential equation and depicted as the inset of Fig. 3c. It is in the order of milliseconds for all samples and it implies the effect of concentration quenching. To reveal the mechanism which dominates the quenching effect, we fitted the concentration dependence of emission intensity to the classic equation:45
| I = x × [k/(1 + β × (x/xc′)θ/3)], | (1) |
PL excitation spectra are shown in Fig. 3d. For all Mn2+-doped samples, they comprise a dominant band at ∼250 nm with a broad shoulder from 275 nm to 375 nm, and a well-separated sharp peak at ∼413 nm with another shoulder at approximately 500 nm. The corresponding band assignments are given in Fig. 3d.29–31 Also the excitation peaks exhibit a red-shift with increasing Mn2+ content. Obviously, the shoulder band peaking at about 500 nm extends to >550 nm. It therefore overlaps with the emission spectrum, meaning that re-absorption may occur especially at higher content of Mn2+ (see Fig. 3a and d). This is taken as one of the reasons for the observed red-shift in the emission and excitation spectra. Noteworthy, there is another weak band occurring at around 410 nm. We assign this to the presence of oxygen-defects on Ge4+ entities, Ge-associated oxygen defects (GODCs).34,46 Similar defects have been observed in germanate glasses previously.31,46 Their intensity decreases with increasing Mn2+ content due to energy transfer from GODCs to Mn2+.
3.2. Persistent luminescence from Mn2+ doped germanate glass
Upon removal of the UV-C excitation source, all Mn2+ doped samples exhibit visible red afterglow. Fig. 4 shows exemplary photographs of this. Obviously, afterglow duration and intensity, respectively, strongly depends on dopant concentration and (as will be discussed in the following paragraphs) on the degree of crystallization. Afterglow decay spectra of sample G-Mn-0.1 are depicted in Fig. 5. Within the first 15 s of decay, the peak position of Mn2+-related photoemission shifts from 643 nm to 670 nm. Some further but less pronounced red-shift, i.e., to 677 nm, is observed in the following 4 min. Subsequently, the peak position remains constant. This transition indicates a convolution of rapid and slow decay processes, assumedly originating from different emission centers which are present in the glass sample. The slow decay process can persist longer than 48 hours (see Fig. 5). In Fig. 6, we depict thermoluminescence (TL) spectra as a tool to assess the depth of the electronic traps which are the assumed origin for the persistence of PL. For sample G-Mn-0.1, the TL curve is dominated by a single broad band which covers the temperature range of 300 to 525 K. This generally reflects a wide energetic distribution of traps. An accurate fit of the experimental spectrum is obtained with an overlay of three Gaussian functions centered at 354, 401 and 529 K. We employ Urbach's method in order to quantify the depth of individual traps through fitting those peaks to the experimental data,47,48i.e., E = Tm/500, where E is the thermal activation energy or the depth of the trap level in eV, and Tm (K) is the peak temperature of the underlying Gaussian. Derived values are summarized in Table 1. For the glass G-Mn-0.1, we obtain at least three types of traps with a depth of 0.71, 0.80 and 1.06 eV, respectively.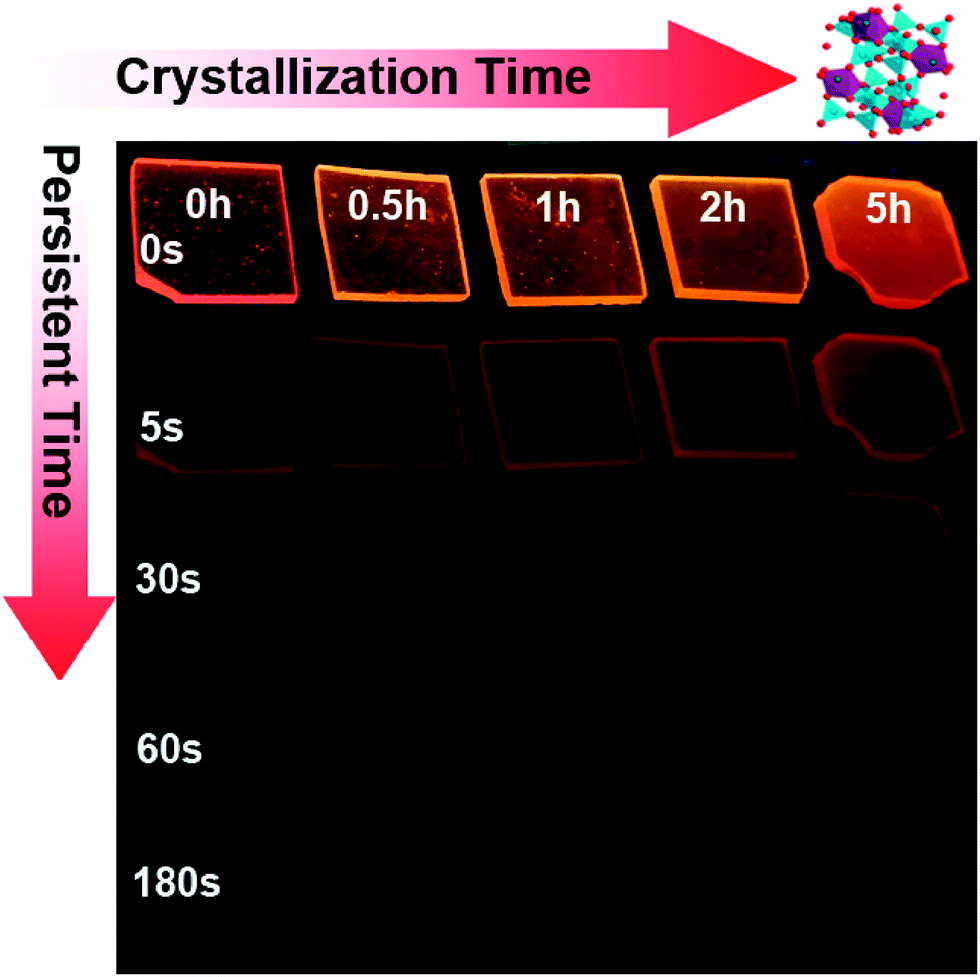 | ||
| Fig. 4 Photographs of glass samples G-Mn-0.1 upon different crystallization times (0–5 h) and persistent times (0–180 s) after removal of excitation light of 254 nm. Photos cannot be taken for the longer persistent time because a normal digital camera cannot recognize the weak signals. | ||
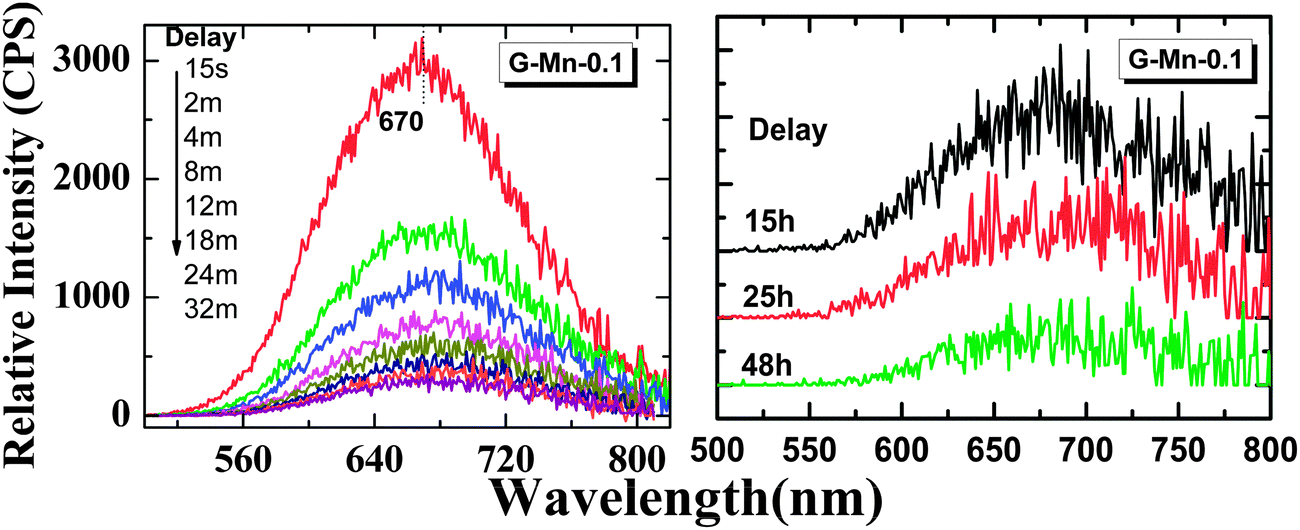 | ||
| Fig. 5 Afterglow spectra of the glass sample G-Mn-0.1. The samples were pre-irradiated with an UV-254 nm lamp for 5 min and measured at different delay times (15 seconds to 48 hours) after removing the lamp. | ||
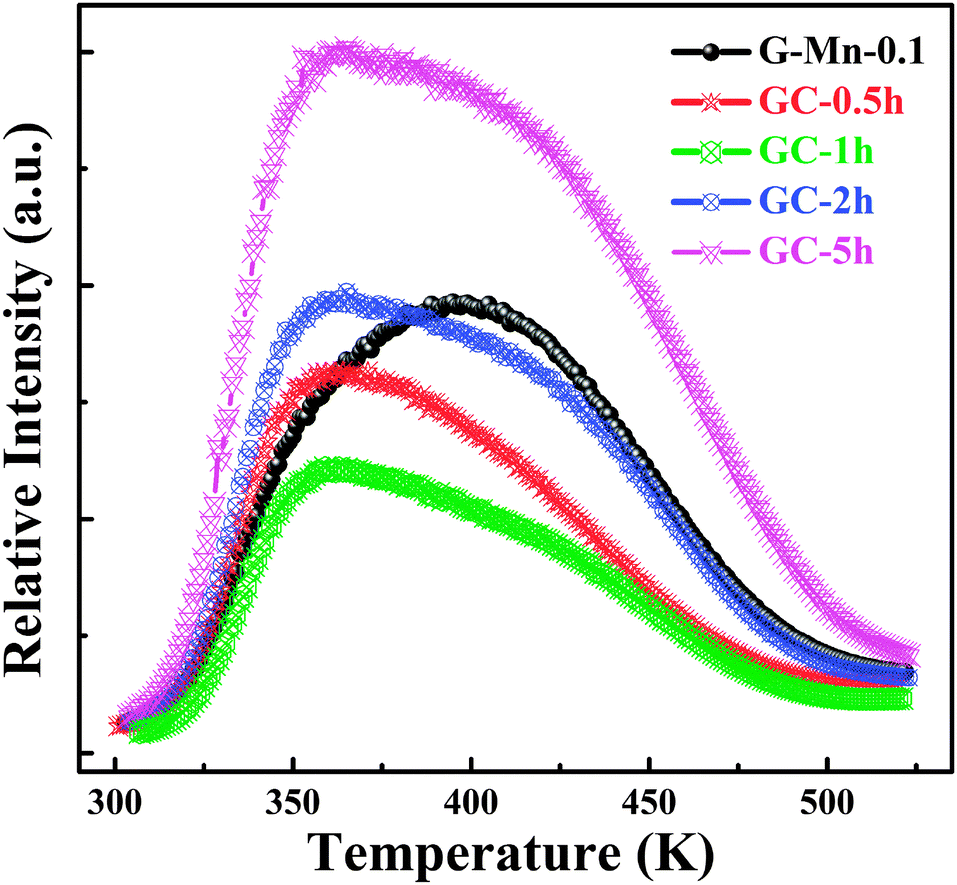 | ||
| Fig. 6 TL curves of glass sample G-Mn-0.1 and glass-ceramic samples GC-0.5h, GC-1h, GC-2h and GC-5h as a function of temperature. | ||
| Samples | Peak1 | Trap1 | Peak 2 | Trap2 | Peak 3 | Trap3 |
|---|---|---|---|---|---|---|
| T m (K) | E (eV) | T m (K) | E (eV) | T m (K) | E (eV) | |
| G-Mn-0.1 | 354 | 0.71 | 401 | 0.80 | 529 | 1.06 |
| GC-0.5h | 348 | 0.70 | 376 | 0.75 | 416 | 0.83 |
| GC-1h | 349 | 0.70 | 374 | 0.775 | 417 | 0.83 |
| GC-2h | 347 | 0.69 | 372 | 0.74 | 417 | 0.83 |
| GC-5h | 348 | 0.70 | 376 | 0.75 | 423 | 0.85 |
3.3. Enhanced PL and persistent luminescence from VIMn2+ doped germanate glass ceramics
Thermal treatment of the glass specimen results in the precipitation of a nanocrystalline secondary phase. The details of this process will be discussed in the subsequent paragraph. Here, we first consider its effect on the PL performance of the material, assuming that through crystal precipitation, the optically active VIMn2+ species can be forced into an ordered octahedral ligand field with strongly enhanced PL afterglow duration. Since the sample G-Mn-0.1 already as a glass has the longest PL lifetime of all samples (Fig. 3c), we focus on this composition in the following experiments. As already noted, thermal treatment was performed on the basis of prior DSC analyses. After crystallization, the visual color of PL from the sample changes from deep red to orange, see Fig. 4. The corresponding PL spectra are shown in Fig. 7. With the onset of crystallization, there is a clear red-shift of the broad main emission peak, i.e., from ∼643 nm to ∼671 nm. At the same time, a weaker green emission band appears at ∼530 nm, indicating re-precipitation of Mn2+ in a less-strong ligand field, i.e., tetrahedral IVMn2+.32–34 The appearance of this band is the reason for the apparent change in the PL color. The inset of Fig. 7a shows the dependence of integrated emission intensity on the crystallization time. The integration was made over the spectral range from 350 nm to 820 nm. It depicts that the intensity of the glass ceramic sample is stronger than the glass sample. We further notice that particularly for sample GC-5h, the overall PL intensity is enhanced – two times than that of the glassy sample. Fig. 7b shows the excitation spectra of the glass ceramic samples, recorded for the VIMn2+ species. The assignment of the excitation band is similar to G-Mn-0.1.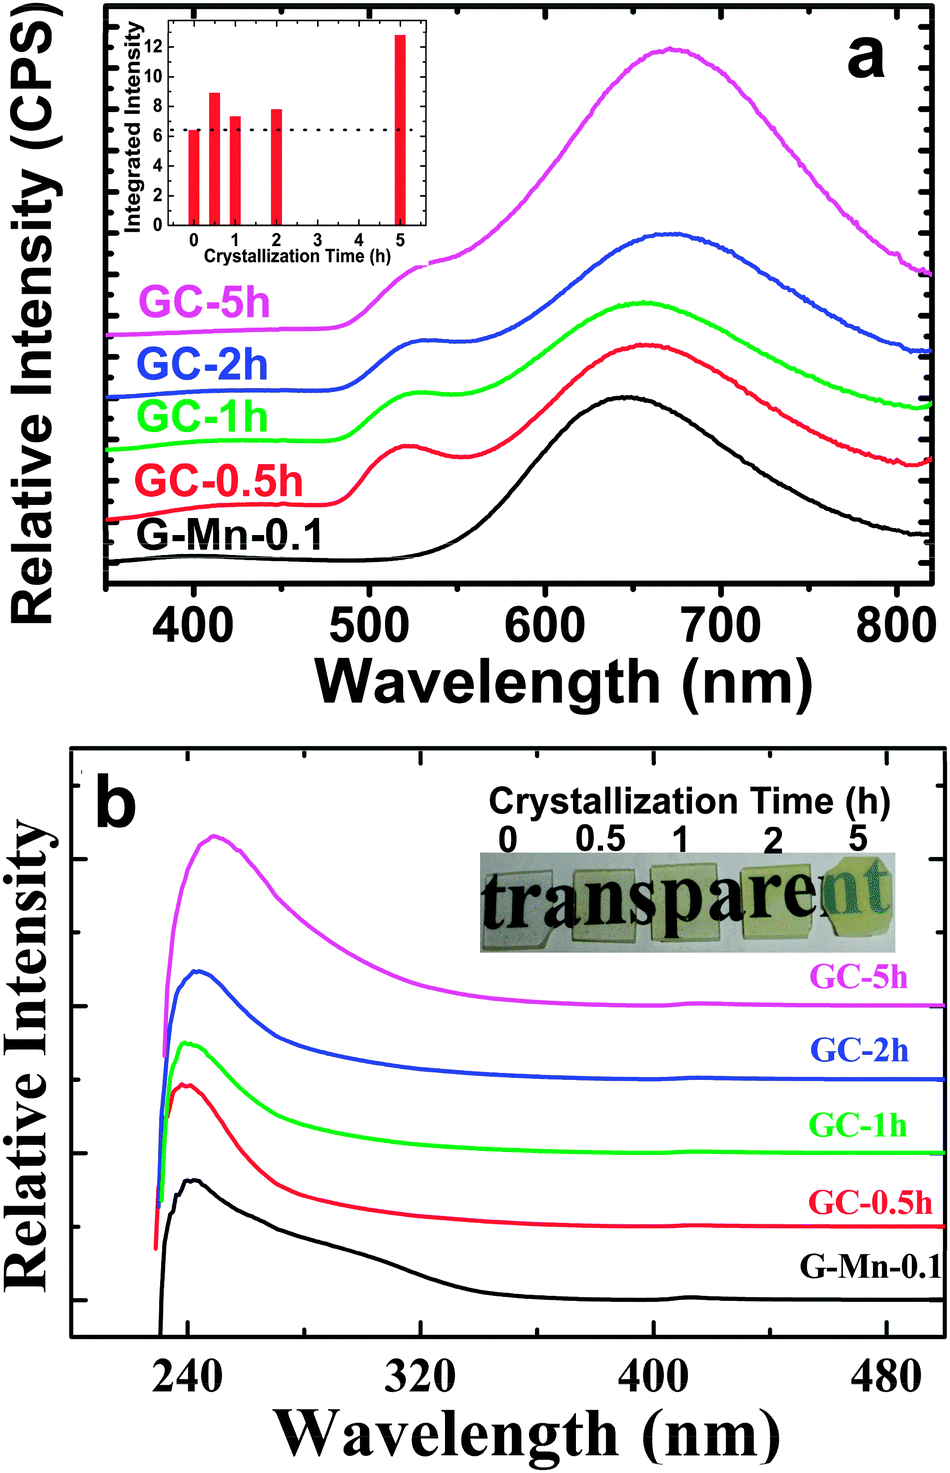 | ||
| Fig. 7 (a) PL spectra (λex = 250 nm) and (b) Excitation spectra (λem = 650 nm) of glass sample G-Mn-0.1 and glass-ceramic samples GC-0.5h, GC-1h, GC-2h and GC-5h. The curves were moved vertically for clarity. The inset of (a) shows the dependence of integrated PL intensity on crystallization time while the inset of (b) is the images of G-Mn-0.1, GC-0.5h, GC-1h, GC-2h and GC-5h. | ||
With the removal of the excitation source, all glass ceramics exhibit a more intense and longer afterglow. This is especially the case for sample GC-5h (see Fig. 8). Noteworthy, even after 104 h, some afterglow could still be detected. Fig. 9 shows the time resolved emission spectra of GC-5h, which were measured at different delay times from 15 seconds to 104 hours. A strong blue-shift of the emission peak occurs within the first 15 s, i.e., from 671 nm to 635 nm (see Fig. 9 and 7a). Subsequently, the peak slightly red-shifts to ∼650 nm (see the 30 h to 104 h delayed curves in Fig. 9). This implies multiple VIMn2+ emission centers in the glass ceramic sample. The green PL band which was attributed to IVMn2+ does not show persistent luminescence after removal of the excitation source (see Fig. 9).
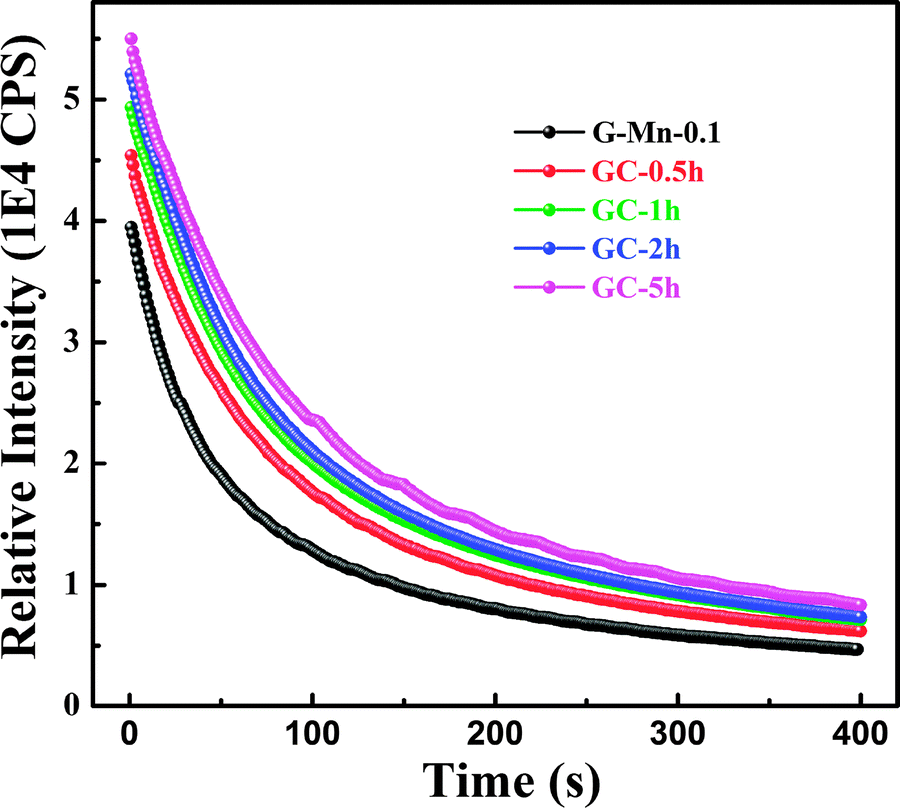 | ||
| Fig. 8 Afterglow decay curves of glass sample G-Mn-0.1 and glass-ceramic samples GC-0.5h, GC-1h, GC-2h and GC-5h. | ||
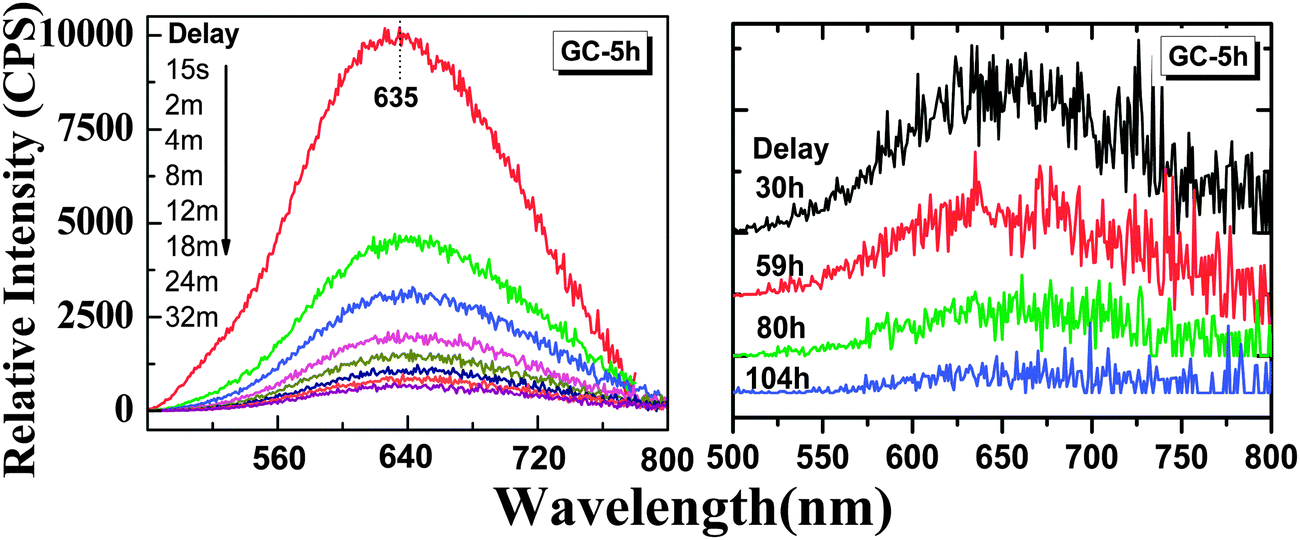 | ||
| Fig. 9 Afterglow spectra of the glass sample GC-5h. The samples were pre-irradiated using a UV-254 nm lamp for 5 min and measured at different delay times (15 seconds to 104 hours) after removing the lamp. | ||
TL, XRD and EPR spectra of glass ceramic samples were collected to understand the observed differences between glass and glass ceramic samples. The TL spectra indicate that the strongest peak occurs at ∼360 K in the glass ceramics, at a lower temperature than in the glassy specimen (see Fig. 6). This means that the energetic depth of the underlying defect is slightly lower. Again, we obtain an accurate fit with three Gaussian bands (Table 1). For GC-5h, the corresponding defect depths are 0.70 eV, 0.75 eV and 0.85 eV, respectively, all lower than the ones observed in G-Mn-0.1. This might be due to the substitution of gallium ion with a higher ionization energy (IE) 2963 kJ mol−1 for the aluminum ion (IE = 2745 kJ mol−1) in glass ceramic samples as will be discussed below. The decrease of the content of the codopant with lower IE will make the traps shallower. This was observed similarly in ZnS:Cu+,Co2+.14 The much higher intensity of TL emission further indicates a much higher number density of those defects.
Fig. 10 shows the XRD pattern of the glass samples G-Mn-0.1 after different crystallization times (0–5 h). As expected, there are no obvious diffraction peaks in the glass sample, nor in the GC-0.5h sample. This indicates that those two samples are amorphous, or that the crystals are too small to cause lattice diffraction. For GC-0.5h, we expect the latter because we did observe the green emission band in the PL spectra which we took as evidence for the occurrence of some IVMn2+. In GC-1h, GC-2h and GC-5h, sharp diffraction peaks appear and grow further with prolonged treatment time. We use Scherrer's equation to obtain a rough estimate of the corresponding crystallite size, D = Kλ/β![[thin space (1/6-em)]](https://www.rsc.org/images/entities/char_2009.gif) cosθ, where D is the crystallite size, K is a dimensionless shape factor, λ is the X-ray wavelength, β (rad) is the line broadening at half maximum (FWHM), and θ (rad) is the Bragg angle. The strongest diffraction peak with 2θ = 27.02° was selected for the calculation, yielding an average size of ∼30 nm, 50 nm and 60 nm for GC-1h, GC-2h and GC-5h, respectively. For GC-5h, the morphology and size distribution of those nanocrystals was also analyzed by HR-TEM, see Fig. 11a, where irregular crystallites with size of ∼20–50 nm were observed. The lattice fringes can be observed in a higher resolution image, as the inset of Fig. 11a shows, and the distance between neighboring crystal lattice fringes is ∼0.328 nm, and it corresponds to the (002) crystal facet of albite Na(Al,Ga)Ge3O8. This consists of the diffraction patterns of Fig. 10, which point to a triclinic phase of space group C
cosθ, where D is the crystallite size, K is a dimensionless shape factor, λ is the X-ray wavelength, β (rad) is the line broadening at half maximum (FWHM), and θ (rad) is the Bragg angle. The strongest diffraction peak with 2θ = 27.02° was selected for the calculation, yielding an average size of ∼30 nm, 50 nm and 60 nm for GC-1h, GC-2h and GC-5h, respectively. For GC-5h, the morphology and size distribution of those nanocrystals was also analyzed by HR-TEM, see Fig. 11a, where irregular crystallites with size of ∼20–50 nm were observed. The lattice fringes can be observed in a higher resolution image, as the inset of Fig. 11a shows, and the distance between neighboring crystal lattice fringes is ∼0.328 nm, and it corresponds to the (002) crystal facet of albite Na(Al,Ga)Ge3O8. This consists of the diffraction patterns of Fig. 10, which point to a triclinic phase of space group C![[1 with combining macron]](https://www.rsc.org/images/entities/char_0031_0304.gif) , NaAlGe3O8 (ICSD #61170). Ga3+ can readily substitute for Al3+ to form the gallium albite, Na(Al,Ga)Ge3O8, which we expect to occur in the present case. We relate the presence of Al3+ to crucible dissolution, which was confirmed by two-dimensional element mapping analysis as shown in Fig. 11b–f. Sodium, germanium, aluminum, gallium and oxygen are homogeneously distributed throughout the sample.
, NaAlGe3O8 (ICSD #61170). Ga3+ can readily substitute for Al3+ to form the gallium albite, Na(Al,Ga)Ge3O8, which we expect to occur in the present case. We relate the presence of Al3+ to crucible dissolution, which was confirmed by two-dimensional element mapping analysis as shown in Fig. 11b–f. Sodium, germanium, aluminum, gallium and oxygen are homogeneously distributed throughout the sample.
 | ||
| Fig. 10 XRD patterns of glass sample G-Mn-0.1 and glass-ceramic samples GC-0.5h, GC-1h, GC-2h and GC-5h. The simulated pattern of NaAlGe3O8 (ICSD #61170) is shown for reference at the bottom of the figure. | ||
 | ||
| Fig. 11 (a) High resolution TEM image of the glass ceramic sample GC-5h, the scale bar is 20 nm. Inset: the HR-TEM image of the sample, scale bar 2 nm. The red circle denotes the boundary between glass and crystal phases. The distance between neighbored crystal lattice fringes is ∼0.328 nm, and it corresponds to the (002) crystal facet of the albite Na(Al,Ga)Ge3O8 solid solution compound. (b)–(f) Two-dimensional elemental mapping of the distribution of Na, Al, Ge, Ga, and O, respectively. | ||
The Rietveld refining was made with FullProf Suite Program version 2011, and it starts with the crystallographic data of NaAlGe3O8 (ICSD #61170). The refining produces lattice parameters of a = 8.4063 Å, b = 13.2844 Å, c = 7.3389 Å, α = 94.39, β = 116.28, γ = 90.86 and V = 731.59 Å3 for sample GC-5h. The cell volume is a little bigger than 731.47 Å3 (ICSD #61170). This expansion of the cell is a sign for the incorporation of gallium into the NaAlGe3O8 compound and, thus, for the formation of the solid solution Na(Al,Ga)Ge3O8. It is also consistent with the shifts of the diffraction peaks to somewhat lower angles as compared to the pure high-albite (see Fig. 10). High-albite comprises one type of octahedral sodium sites and four types of tetrahedral Ge/Al/Ga sites. When manganese ions are introduced, considering their radius alone, they can assumedly substitute for either sodium or for any of the tetrahedral sites. The latter explains the occurrence of some green PL, while the former is taken to be at the origin of prolonged afterglow.
3.4. Afterglow mechanism
Inspecting more carefully the PL and the afterglow spectra of the Mn2+ doped glass ceramics (see Fig. 7a and 9), we find notable differences, especially in the green spectral range. The green emission is absent from the afterglow spectra. This implies that the persistent luminescence mechanism is not due to a process which involves thermally activated electrons released from traps and consequently tunneling through the conduction band. The latter would be the case if trapped electrons are thermally emitted from the traps and lifted to the conduction band. Subsequently, they can be captured by the activator ions. Afterglow is then a result of the recombination of electrons and holes. If this route dominated the emission process, also the green emission of IVMn2+ should be visible in the afterglow since the higher-lying excited level from which this emission occurs is much closer to the conduction band as compared to the gap between the red-emitting level and the conduction band. On this basis, we propose the mechanism, as schematically shown in Fig. 12.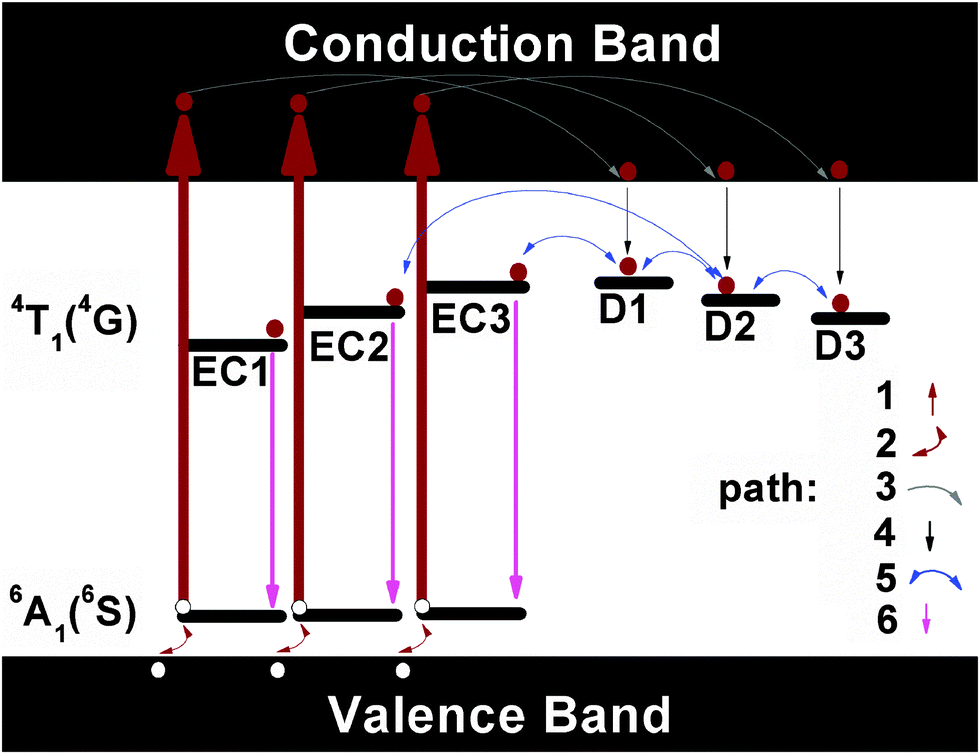 | ||
| Fig. 12 Schematic of the mechanism of persistent luminescence processes in the Mn2+ doped glasses and glass-ceramics. EC1, EC2 and EC3 stand for the different types of octahedral Mn2+ emission centers; for clarity, only the ground state 6A1 (6S) and the first excited state 4T1 (4G) of Mn2+ are shown. D1, D2 and D3 stand for the different types of defects with depth as shown in Table 1. Dark red solid circles are electrons while white solid circles are holes. Paths 1 to 6 denote the different processes involved in the generation of the persistent luminescence processes. | ||
When the samples were illuminated with ultraviolet light, different types of Mn2+ emission centers (named EC1, EC2 and EC3 but the number is for sake of visualization in Fig. 11) in the hosts are excited along path 1 into the 4T1 (4P) state, the latter lying in the conduction band. This leads to a separation of electrons and holes. Holes subsequently follow path 2 and flow into the valence band. Simultaneous removal of the electron and hole will not lead to the valence variation of the manganese ion. Some electrons, on the other side, relax to the lower end of the conduction band via path 3. Another portion of electrons transits through the non-radiative path 4 to the different types of the shallow defects such as D1, D2 and D3. D1–D3 have the depths as summarized in Table 1. When the excitation source is removed, electrons start to escape from the traps D1–D3 via path 5. Path 5 is thermally activated and it, hence, is slow at room temperature. The electrons can also be removed from D1 (or D2, D3) directly, and be trapped on the excited states of EC1 (or EC2, EC3). They can further also escape from a deeper defect to a shallower defect reversibly, and then be captured by the activators. In the meanwhile, thermal stimulation will lift holes from the valence band to the ground state via path 2. Once the electrons are trapped on EC1 (EC2, EC3), they emit their potential energy in the form of red light by recombining to holes. The relaxation dynamics, in turn, depend on the depth and the density of defects D1 to D3. As the Mn2+ doped glass is transformed into the glass ceramic, the defects become shallower and more populated. We did try to charge these shallow defects with other light sources such as 365 nm or 410 nm LEDs, but failed. This confirms that path 1 is the crucial process for lifting the electrons into the conduction band directly. Once electrons are in the conduction band, they can move freely and, especially, charge the defects. The defects, as discussed in ref. 14, may not be randomly distributed throughout the sample. They with depth as presented in Table 1 prefer gathering in the vicinity of manganese sites. It, therefore, enables energy transfer possible from the defects to the activators.
In view of the ultralong lasting afterglow, we had tried to synthesize Mn2+ doped NaAlGe3O8 crystals by traditional high temperature solid state reaction but failed. Further studies are obviously necessary on how to prepare the high pressure phase with a controlled size and morphology by other techniques rather than the current technique of crystallization from the glass phase. Usually for nanosized persistent luminescence materials, the persistence will be greatly shortened especially as compared to bulk materials. This work, however, differently, shows that the persistence can be preserved longer than 100 h even when the doped crystalline phase of Na(Al,Ga)Ge3O8 becomes as small as 50 nm. This, plus luminescence in the 600 nm to 800 nm range lying in the tissue transparent region, demonstrates its potential application in tumor bioimaging or photodynamic therapy. This study is the first and primary step towards it.
4. Conclusions
In this work, we found a new type of Mn2+ doped sodium gallium aluminum germanate glass which can exhibit red to near infrared luminescence persisting longer than 48 h in the spectral range from 600 to 800 nm. The persistence of Mn2+ red luminescence can be preserved and improved even longer than 100 h through controlled crystallization and defect engineering (modulation of the defect depth and density as Fig. 6 and Table 1 reveal). This is thanks to successfully inducing in glass the formation of albite Na(Al,Ga)Ge3O8 which comprises sodium octahedral sites, and therefore, stabilizing the red emissive Mn2+ ions. The controlled crystallization can lead to the precipitated crystal Na(Al,Ga)Ge3O8 with a size smaller than 50 nm (see Fig. 10 and 11), and this small size of the nanocrystal does not quench the persistent luminescence as many reports have reported, and it, therefore, provides us with new insights into the field of biomedical imaging or photodynamic therapy after further optimization and grafting of functional surface layers to the Mn2+ doped nanocrystals in the future.Acknowledgements
The authors would like to acknowledge financial support from the National Natural Science Foundation of China (Grant No. 51322208 and 51132004), Guangdong Natural Science Foundation for Distinguished Young Scholars (Grant No. S20120011380), and the Department of Education of Guangdong Province (Grant No. 2013gjhz0001).References
- M. Peng, J. Qiu and Q. Zhang, Opt. Mater., 2014, 36, 1769–1770 CrossRef PubMed.
- P. F. Smet, D. Poelman and M. P. Hehlen, Opt. Mater. Express, 2012, 2, 452–454 CrossRef.
- H. F. Brito, J. Hölsä, T. Laamanen, M. Lastusaari, M. Malkamäki and L. C. Rodrigues, Opt. Mater. Express, 2012, 2, 371–381 CrossRef CAS.
- Z. Pan, Y.-Y. Lu and F. Liu, Nat. Mater., 2012, 11, 58–63 CrossRef CAS PubMed.
- H. Lin, B. Wang, J. Xu, R. Zhang, H. Chen, Y. Yu and Y. Wang, ACS Appl. Mater. Interfaces, 2014, 6, 21264–21269 CAS.
- W. Chen and J. Zhang, J. Nanosci. Nanotechnol., 2006, 6, 1159–1166 CrossRef CAS PubMed.
- Q. Le Masne de Chermont, C. Chanéac, J. Seguin, F. Pellé, S. Maîtrejean, J.-P. Jolivet, D. Gourier, M. Bessodes and D. Scherman, Proc. Natl. Acad. Sci. U. S. A., 2007, 104, 9266–9271 CrossRef CAS PubMed.
- K.-L. Wong, G.-L. Law, M. B. Murphy, P. A. Tanner, W.-T. Wong, P. K.-S. Lam and M. H.-W. Lam, Inorg. Chem., 2008, 47, 5190–5196 CrossRef CAS PubMed.
- T. Maldiney, A. Lecointre, B. Viana, A. l. Bessière, M. Bessodes, D. Gourier, C. Richard and D. Scherman, J. Am. Chem. Soc., 2011, 133, 11810–11815 CrossRef CAS PubMed.
- A. Abdukayum, J.-T. Chen, Q. Zhao and X.-P. Yan, J. Am. Chem. Soc., 2013, 135, 14125–14133 CrossRef CAS PubMed.
- T. Maldiney, A. Bessière, J. Seguin, E. Teston, S. K. Sharma, B. Viana, A. J. Bos, P. Dorenbos, M. Bessodes and D. Gourier, Nat. Mater., 2014, 13, 418–426 CrossRef CAS PubMed.
- S. Sharma, D. Gourier, B. Viana, T. Maldiney, E. Teston, D. Scherman and C. Richard, Opt. Mater., 2014, 36, 1901–1906 CrossRef CAS PubMed.
- H. Homayoni, L. Rashidi and W. Chen, Rev. Nanosci. Nanotechnol., 2014, 3, 107–132 CrossRef PubMed.
- F. Clabau, X. Rocquefelte, T. Le Mercier, P. Deniard, S. Jobic and M.-H. Whangbo, Chem. Mater., 2006, 18, 3212–3220 CrossRef CAS.
- D. Chen, Y. Chen, H. Lu and Z. Ji, Inorg. Chem., 2014, 53, 8638–8645 CrossRef CAS PubMed.
- D. Kulesza, A. Wiatrowska, J. Trojan-Piegza, T. Felbeck, R. Geduhn, P. Motzek, E. Zych and U. Kynast, J. Lumin., 2013, 133, 51–56 CrossRef CAS PubMed.
- D. Kulesza and E. Zych, J. Phys. Chem. C, 2013, 117, 26921–26928 CAS.
- P. A. Tanner, Lanthanide Luminescence, Springer, 2011, pp. 183–233 Search PubMed.
- J. Xu, Z. Ju, X. Gao, Y. An, X. Tang and W. Liu, Inorg. Chem., 2013, 52, 13875–13881 CrossRef CAS PubMed.
- S. Ye, J. Zhang, X. Zhang, S. Lu, X. Ren and X.-j. Wang, J. Appl. Phys., 2007, 101, 063545 CrossRef PubMed.
- Y. Zhuang, Y. Katayama, J. Ueda and S. Tanabe, Opt. Mater., 2014, 36, 1907–1912 CrossRef CAS PubMed.
- F. Kang, Y. Hu, L. Chen, X. Wang, H. Wu and Z. Mu, J. Lumin., 2013, 135, 113–119 CrossRef CAS PubMed.
- P. F. Smet, J. Botterman, K. Van den Eeckhout, K. Korthout and D. Poelman, Opt. Mater., 2014, 36, 1913–1919 CrossRef CAS PubMed.
- Y. Zhuang, J. Ueda and S. Tanabe, J. Mater. Chem. C, 2013, 1, 7849–7855 RSC.
- Y. Zhuang, J. Ueda and S. Tanabe, Appl. Phys. Express, 2013, 6, 052602 CrossRef.
- A. Lecointre, A. Bessière, B. Viana and D. Gourier, Radiat. Meas., 2010, 45, 497–499 CrossRef CAS PubMed.
- L. Lin, C. Shi, Z. Wang, W. Zhang and M. Yin, J. Alloys Compd., 2008, 466, 546–550 CrossRef CAS PubMed.
- A. Winterstein, H. Akamatsu, D. Möncke, K. Tanaka, M. Schmidt and L. Wondraczek, Opt. Mater. Express, 2013, 3, 184–193 CrossRef CAS.
- I. Machado, L. Prado, L. Gomes, J. Prison and J. Martinelli, J. Non-Cryst. Solids, 2004, 348, 113–117 CrossRef CAS PubMed.
- N. Da, M. Peng, S. Krolikowski and L. Wondraczek, Opt. Express, 2010, 18, 2549–2557 CrossRef CAS PubMed.
- B. Padlyak, O. Vlokh, B. Kuklinski and K. Sagoo, Ukr. J. Phys. Opt., 2006, 7, 1–10 CrossRef CAS.
- C. Li, Q. Su and S. Wang, Mater. Res. Bull., 2002, 37, 1443–1449 CrossRef CAS.
- Y. Takahashi, M. Ando, R. Ihara and T. Fujiwara, Opt. Mater. Express, 2011, 1, 372–378 CrossRef CAS.
- J. Qiu, H. Igarashi and A. Makishima, Sci. Technol. Adv. Mater., 2005, 6, 431–434 CrossRef CAS PubMed.
- Y. Zhuang, J. Ueda and S. Tanabe, Appl. Phys. Lett., 2014, 105, 191904 CrossRef PubMed.
- S. Chenu, E. Véron, C. Genevois, G. Matzen, T. Cardinal, A. Etienne, D. Massiot and M. Allix, Adv. Opt. Mater., 2014, 2, 364–372 CrossRef CAS.
- S. Chenu, E. Véron, C. Genevois, A. Garcia, G. Matzen and M. Allix, J. Mater. Chem. C, 2014, 2, 10002–10010 RSC.
- G. Gao and L. Wondraczek, J. Mater. Chem. C, 2013, 1, 1952–1958 RSC.
- J. Pilbrow, Transition ion electron paramagnetic resonance, Clarendon Press, Oxford, 1990 Search PubMed.
- A. Winterstein-Beckmann, D. Möncke, D. Palles, E. Kamitsos and L. Wondraczek, J. Non-Cryst. Solids, 2013, 376, 165–174 CrossRef CAS PubMed.
- Z. Xia, Y. Zhang, M. S. Molokeev and V. V. Atuchin, J. Phys. Chem. C, 2013, 117, 20847–20854 CAS.
- K. Li, D. Geng, M. Shang, Y. Zhang, H. Lian and J. Lin, J. Phys. Chem. C, 2014, 110, 11026–11034 Search PubMed.
- N. Guo, Y. Huang, Y. Jia, W. Lv, Q. Zhao, W. Lü, Z. Xia and H. You, Dalton Trans., 2013, 42, 941–947 RSC.
- W. Lu, Z. Hao, X. Zhang, Y. Luo, X. Wang and J. Zhang, Inorg. Chem., 2011, 50, 7846–7851 CrossRef CAS PubMed.
- L. Van Uitert, J. Electrochem. Soc., 1967, 114, 1048–1053 CrossRef CAS PubMed.
- B. Padlyak and B. Kukliński, Radiat. Meas., 2004, 38, 593–597 CrossRef CAS PubMed.
- C. Shalgaonkar and A. Narlikar, J. Mater. Sci., 1972, 7, 1465–1471 CrossRef CAS.
- S. W. McKeever, Thermoluminescence of solids, Cambridge University Press, 1988 Search PubMed.
| This journal is © The Royal Society of Chemistry 2015 |