 Open Access Article
Creative Commons Attribution 3.0 Unported Licence
Photoluminescence and energy transfer rates and efficiencies in Eu3+ activated Tb2Mo3O12†
F.
Baur
a,
F.
Glocker
b and
T.
Jüstel
*a
aMünster University of Applied Sciences, Institute for Optical Technologies, Stegerwaldstraße 39, 48565 Steinfurt, Germany. E-mail: tj@fh-muenster.de
bRheinMain University of Applied Sciences, Department of Physical Engineering, Am Brückweg 26, 65428 Rüsselsheim, Germany
First published on 30th December 2014
Abstract
Luminous efficacy (LE) and colour rendering index (CRI) of various simulated phosphor-converted warm white-light emitting diodes are calculated. Actual measured phosphor emission spectra are employed for this task. The efficacy and CRI of Eu3+ activated red emitting phosphors are superior to Eu2+ emitting nitride-based phosphors, however, Eu3+ suffers from low absorption strength in the blue spectral range. Tb3+ exhibits comparatively strong absorption in this range and can be used as a sensitizer for Eu3+. A solid solution series of (Tb1−xEux)2Mo3O12 (TM:Eu3+) powders and ceramic discs is prepared by conventional solid state synthesis. Complete transfer from Tb3+ to Eu3+ is achieved in the (Tb0.8Eu0.2)2Mo3O12 sample and a red colour point is realized upon 487 nm (Tb3+ 7F6 → 5D4) excitation with a quantum efficiency of 94%. Full conversion of a 380 nm LED and improved conversion of a 465 nm LED was achieved employing TM:Eu3+ ceramics. The position and temperature related shift of the Eu3+ Stark sublevels is determined from temperature-dependent emission and excitation spectra. These spectra also reveal excited state absorption from thermally excited Eu3+ 7F1, 7F2 and 7F3 states. High-temperature measurements in the range of 350 to 800 K show a T0.5 of 627 K. Decay measurements exhibit a clearly visible rise time. A new method to determine energy transfer rates from rise time curves is developed. From the energy transfer rates the transfer mechanism and efficiency can be determined with a higher degree of confidence compared to methods based on luminescence intensities.
Introduction
Solid state lighting, especially on the basis of phosphor-converted light-emitting diodes (pcLEDs), is gaining ever increasing importance.1–3 For the generation of white light with a high colour rendering index (CRI) generally a blue LED coated with yellow emitting YAG:Ce phosphor is used. While high luminous efficacies (LE) can be achieved with such a setup, the emitted light is cool white since almost no red light is emitted.4 For domestic lighting application warm-white light, resembling that of incandescent light sources, is generally considered the most suitable.5 However, introducing red emitters inevitably results in a decreased luminous efficacy due to the reduced human eye sensitivity in the red spectral range and due to a reduced package gain caused by spectral interaction between the yellow (green) and red emitting converter materials. Warm-white light sources commonly employ broad-band red emitters such as Sr2Si5N8:Eu2+ and CaAlSiN3:Eu2+.6 While these phosphors are highly efficient, their emission reaches into the deep red spectral range around 700 nm where the eye sensitivity is zero, resulting in a comparatively low luminous efficacy.7,8 Therefore, the choice of the red emitting phosphor greatly influences the LE of the pcLED. It has been shown in simulations that the application of red narrow-band or line emitting phosphors is required to achieve high luminous efficacies in warm-white light emitting pcLEDs.9–11 However, these works employed Gauss curves to simulate the phosphors' emission spectra. To the best of our knowledge there is no overview yet of the LE and CRI that can be theoretically achieved on a pcLED when applying different commercially available phosphors. Eu3+ activated red emitting phosphors generally exhibit high LE compared to band-emitting Eu2+ activated red-emitting phosphors, but they suffer from low absorption in the blue spectral range. The use of sensitizers is a suitable method to overcome such shortcomings as for example in the commercial phosphors BaMgAl10O17:Eu2+,Mn2+ or LaPO4:Ce3+,Tb3+. Eu3+, however, cannot be sensitized by Ce3+ as a Ce3+/Eu3+ metal-to-metal charge transfer quenches the luminescence.3,11 The energy transfer from Tb3+ to Eu3+ is well documented in published literature, making Tb3+ a potential sensitizer for Eu3+.34,35,44,48–50 Tb3+ exhibits absorption around 487 nm, but as the underlying transition is spin- and parity forbidden as well, absorption in principal is not significantly stronger than that of Eu3+ itself. Tb2Mo3O12 is a known host material that overcomes this limitation to some extent.51 The Tb3+ concentration is high and molybdate hosts often lead to enhanced absorption strength of the 4f4f transitions.20 This results in a comparatively strong Tb3+ absorption in the blue spectral range.LED spectra calculations
In order to evaluate the value of red line emitting Eu3+ phosphors, we simulated spectra composed of a blue 465 nm (1000 cm−1, 22 nm FWHM) LED spectrum in combination with spectra of either Y3Al5O12:Ce3+ (YAG:Ce) or Lu3Al5O12:Ce3+ (LuAG:Ce) and either Sr2Si5N8:Eu2+ (Sr258:Eu2+), CaAlSiN3:Eu2+ (CASN:Eu2+), Tb2Mo3O12:Eu3+ (TM:Eu3+), Li3La2Ba3(MoO4)8:Sm3+ (LBLM:Sm3+), Mg14Ge5O24:Mn4+ (MG:Mn4+), or K2SiF6:Mn4+ (KSF:Mn4+). A second set of spectra was created by simulating the spectrum of a fully converted near-UV emitting LED (395 nm) with blue emitting BaMgAl10O17:Eu2+ (BAM:Eu2+) and green emitting SrSi2N2O2:Eu2+ (Sr1222:Eu2+) and any one of the aforementioned red emitting phosphors. The commercially available (Sr,Ca)AlSiN3:Eu2+ phosphor exhibits an emission similar to Sr2Si5N8:Eu2+, so the results should be similar as well. All emission spectra were taken from self-made phosphor samples, except that of KSF:Mn4+ which was digitized from the Adachi and Takahashi publication.12The experimental emission spectra were combined by summing their intensity values to yield simulated pcLED emission spectra. The ratio of the phosphors was adjusted to result in a spectrum with a correlated colour temperature (CCT) of 2700 K and 3000 K, respectively. The CIE1931 x/y colour points of the spectra were chosen according to ANSI C78.377 (2700 K: 0.4578/0.4101; 3000 K: 0.4338/0.4030). There is only one distinct way to combine three spectra to yield a specific colour point. For each simulated spectrum LE and CRI were calculated employing Osram Sylvania Color Calculator v4.59.52 The results are presented in Table 1 and 2. It should be noted that the calculated LED spectra are no replacement for measurements on real pcLEDs, as potential changes of the overall spectral shape due to re-absorption processes are not considered. Moreover, we are aware of the fact that Eu3+ is solely weakly absorbing radiation at 465 nm since the 4f–4f transitions at this position have rather low oscillator strength. Therefore, the ratios given in the tables are not ratios for the physical amount of phosphor, but the ratio of the emission integrals on the combined spectrum. For practical application, absorption, quantum efficiencies and reabsorption would need to be taken into account. However, the results pose as a guideline as to what can theoretically be achieved when employing a certain phosphor blend.
| 465 nm LED+ | 2700 K | 3000 K | ||||
|---|---|---|---|---|---|---|
| CRI | LE [lm W−1] | Ratios (LED/Garnet/Red) | CRI | LE [lm W−1] | Ratios (LED/Garnet/Red) | |
| YAG:Ce + TM:Eu3+ | 90 | 359 | 0.09![[thin space (1/6-em)]](https://www.rsc.org/images/entities/char_2009.gif) : :![[thin space (1/6-em)]](https://www.rsc.org/images/entities/char_2009.gif) 0.57 0.57![[thin space (1/6-em)]](https://www.rsc.org/images/entities/char_2009.gif) : :![[thin space (1/6-em)]](https://www.rsc.org/images/entities/char_2009.gif) 0.34 0.34 |
90 | 357 | 0.11![[thin space (1/6-em)]](https://www.rsc.org/images/entities/char_2009.gif) : :![[thin space (1/6-em)]](https://www.rsc.org/images/entities/char_2009.gif) 0.60 0.60![[thin space (1/6-em)]](https://www.rsc.org/images/entities/char_2009.gif) : :![[thin space (1/6-em)]](https://www.rsc.org/images/entities/char_2009.gif) 0.29 0.29 |
| YAG:Ce + LBLM:Sm3+ | 85 | 313 | 0.08![[thin space (1/6-em)]](https://www.rsc.org/images/entities/char_2009.gif) : :![[thin space (1/6-em)]](https://www.rsc.org/images/entities/char_2009.gif) 0.43 0.43![[thin space (1/6-em)]](https://www.rsc.org/images/entities/char_2009.gif) : :![[thin space (1/6-em)]](https://www.rsc.org/images/entities/char_2009.gif) 0.49 0.49 |
84 | 319 | 0.10![[thin space (1/6-em)]](https://www.rsc.org/images/entities/char_2009.gif) : :![[thin space (1/6-em)]](https://www.rsc.org/images/entities/char_2009.gif) 0.48 0.48![[thin space (1/6-em)]](https://www.rsc.org/images/entities/char_2009.gif) : :![[thin space (1/6-em)]](https://www.rsc.org/images/entities/char_2009.gif) 0.42 0.42 |
| YAG:Ce + CASN:Eu2+ | 95 | 260 | 0.06![[thin space (1/6-em)]](https://www.rsc.org/images/entities/char_2009.gif) : :![[thin space (1/6-em)]](https://www.rsc.org/images/entities/char_2009.gif) 0.38 0.38![[thin space (1/6-em)]](https://www.rsc.org/images/entities/char_2009.gif) : :![[thin space (1/6-em)]](https://www.rsc.org/images/entities/char_2009.gif) 0.56 0.56 |
93 | 272 | 0.08![[thin space (1/6-em)]](https://www.rsc.org/images/entities/char_2009.gif) : :![[thin space (1/6-em)]](https://www.rsc.org/images/entities/char_2009.gif) 0.43 0.43![[thin space (1/6-em)]](https://www.rsc.org/images/entities/char_2009.gif) : :![[thin space (1/6-em)]](https://www.rsc.org/images/entities/char_2009.gif) 0.49 0.49 |
| YAG:Ce + Sr258:Eu2+ | 85 | 309 | 0.07![[thin space (1/6-em)]](https://www.rsc.org/images/entities/char_2009.gif) : :![[thin space (1/6-em)]](https://www.rsc.org/images/entities/char_2009.gif) 0.43 0.43![[thin space (1/6-em)]](https://www.rsc.org/images/entities/char_2009.gif) : :![[thin space (1/6-em)]](https://www.rsc.org/images/entities/char_2009.gif) 0.49 0.49 |
84 | 315 | 0.10![[thin space (1/6-em)]](https://www.rsc.org/images/entities/char_2009.gif) : :![[thin space (1/6-em)]](https://www.rsc.org/images/entities/char_2009.gif) 0.48 0.48![[thin space (1/6-em)]](https://www.rsc.org/images/entities/char_2009.gif) : :![[thin space (1/6-em)]](https://www.rsc.org/images/entities/char_2009.gif) 0.42 0.42 |
| YAG:Ce + MG:Mn4+ | 78 | 241 | 0.06![[thin space (1/6-em)]](https://www.rsc.org/images/entities/char_2009.gif) : :![[thin space (1/6-em)]](https://www.rsc.org/images/entities/char_2009.gif) 0.40 0.40![[thin space (1/6-em)]](https://www.rsc.org/images/entities/char_2009.gif) : :![[thin space (1/6-em)]](https://www.rsc.org/images/entities/char_2009.gif) 0.54 0.54 |
83 | 254 | 0.08![[thin space (1/6-em)]](https://www.rsc.org/images/entities/char_2009.gif) : :![[thin space (1/6-em)]](https://www.rsc.org/images/entities/char_2009.gif) 0.44 0.44![[thin space (1/6-em)]](https://www.rsc.org/images/entities/char_2009.gif) : :![[thin space (1/6-em)]](https://www.rsc.org/images/entities/char_2009.gif) 0.48 0.48 |
| YAG:Ce + KSF:Mn4+ | 93 | 337 | 0.08![[thin space (1/6-em)]](https://www.rsc.org/images/entities/char_2009.gif) : :![[thin space (1/6-em)]](https://www.rsc.org/images/entities/char_2009.gif) 0.56 0.56![[thin space (1/6-em)]](https://www.rsc.org/images/entities/char_2009.gif) : :![[thin space (1/6-em)]](https://www.rsc.org/images/entities/char_2009.gif) 0.35 0.35 |
94 | 339 | 0.11![[thin space (1/6-em)]](https://www.rsc.org/images/entities/char_2009.gif) : :![[thin space (1/6-em)]](https://www.rsc.org/images/entities/char_2009.gif) 0.60 0.60![[thin space (1/6-em)]](https://www.rsc.org/images/entities/char_2009.gif) : :![[thin space (1/6-em)]](https://www.rsc.org/images/entities/char_2009.gif) 0.30 0.30 |
| LuAG:Ce + TM:Eu3+ | 73 | 345 | 0.06![[thin space (1/6-em)]](https://www.rsc.org/images/entities/char_2009.gif) : :![[thin space (1/6-em)]](https://www.rsc.org/images/entities/char_2009.gif) 0.44 0.44![[thin space (1/6-em)]](https://www.rsc.org/images/entities/char_2009.gif) : :![[thin space (1/6-em)]](https://www.rsc.org/images/entities/char_2009.gif) 0.50 0.50 |
75 | 343 | 0.09![[thin space (1/6-em)]](https://www.rsc.org/images/entities/char_2009.gif) : :![[thin space (1/6-em)]](https://www.rsc.org/images/entities/char_2009.gif) 0.46 0.46![[thin space (1/6-em)]](https://www.rsc.org/images/entities/char_2009.gif) : :![[thin space (1/6-em)]](https://www.rsc.org/images/entities/char_2009.gif) 0.46 0.46 |
| LuAG:Ce + LBLM:Sm3+ | 92 | 290 | 0.06![[thin space (1/6-em)]](https://www.rsc.org/images/entities/char_2009.gif) : :![[thin space (1/6-em)]](https://www.rsc.org/images/entities/char_2009.gif) 0.30 0.30![[thin space (1/6-em)]](https://www.rsc.org/images/entities/char_2009.gif) : :![[thin space (1/6-em)]](https://www.rsc.org/images/entities/char_2009.gif) 0.65 0.65 |
92 | 292 | 0.08![[thin space (1/6-em)]](https://www.rsc.org/images/entities/char_2009.gif) : :![[thin space (1/6-em)]](https://www.rsc.org/images/entities/char_2009.gif) 0.33 0.33![[thin space (1/6-em)]](https://www.rsc.org/images/entities/char_2009.gif) : :![[thin space (1/6-em)]](https://www.rsc.org/images/entities/char_2009.gif) 0.60 0.60 |
| LuAG:Ce + CASN:Eu2+ | 78 | 225 | 0.04![[thin space (1/6-em)]](https://www.rsc.org/images/entities/char_2009.gif) : :![[thin space (1/6-em)]](https://www.rsc.org/images/entities/char_2009.gif) 0.25 0.25![[thin space (1/6-em)]](https://www.rsc.org/images/entities/char_2009.gif) : :![[thin space (1/6-em)]](https://www.rsc.org/images/entities/char_2009.gif) 0.71 0.71 |
79 | 231 | 0.06![[thin space (1/6-em)]](https://www.rsc.org/images/entities/char_2009.gif) : :![[thin space (1/6-em)]](https://www.rsc.org/images/entities/char_2009.gif) 0.28 0.28![[thin space (1/6-em)]](https://www.rsc.org/images/entities/char_2009.gif) : :![[thin space (1/6-em)]](https://www.rsc.org/images/entities/char_2009.gif) 0.67 0.67 |
| LuAG:Ce + Sr258:Eu2+ | 89 | 283 | 0.06![[thin space (1/6-em)]](https://www.rsc.org/images/entities/char_2009.gif) : :![[thin space (1/6-em)]](https://www.rsc.org/images/entities/char_2009.gif) 0.30 0.30![[thin space (1/6-em)]](https://www.rsc.org/images/entities/char_2009.gif) : :![[thin space (1/6-em)]](https://www.rsc.org/images/entities/char_2009.gif) 0.64 0.64 |
89 | 286 | 0.07![[thin space (1/6-em)]](https://www.rsc.org/images/entities/char_2009.gif) : :![[thin space (1/6-em)]](https://www.rsc.org/images/entities/char_2009.gif) 0.33 0.33![[thin space (1/6-em)]](https://www.rsc.org/images/entities/char_2009.gif) : :![[thin space (1/6-em)]](https://www.rsc.org/images/entities/char_2009.gif) 0.60 0.60 |
| LuAG:Ce + MG:Mn4+ | 43 | 198 | 0.03![[thin space (1/6-em)]](https://www.rsc.org/images/entities/char_2009.gif) : :![[thin space (1/6-em)]](https://www.rsc.org/images/entities/char_2009.gif) 0.27 0.27![[thin space (1/6-em)]](https://www.rsc.org/images/entities/char_2009.gif) : :![[thin space (1/6-em)]](https://www.rsc.org/images/entities/char_2009.gif) 0.70 0.70 |
48 | 205 | 0.05![[thin space (1/6-em)]](https://www.rsc.org/images/entities/char_2009.gif) : :![[thin space (1/6-em)]](https://www.rsc.org/images/entities/char_2009.gif) 0.29 0.29![[thin space (1/6-em)]](https://www.rsc.org/images/entities/char_2009.gif) : :![[thin space (1/6-em)]](https://www.rsc.org/images/entities/char_2009.gif) 0.66 0.66 |
| LuAG:Ce + KSF:Mn4+ | 64 | 314 | 0.06![[thin space (1/6-em)]](https://www.rsc.org/images/entities/char_2009.gif) : :![[thin space (1/6-em)]](https://www.rsc.org/images/entities/char_2009.gif) 0.43 0.43![[thin space (1/6-em)]](https://www.rsc.org/images/entities/char_2009.gif) : :![[thin space (1/6-em)]](https://www.rsc.org/images/entities/char_2009.gif) 0.51 0.51 |
67 | 315 | 0.08![[thin space (1/6-em)]](https://www.rsc.org/images/entities/char_2009.gif) : :![[thin space (1/6-em)]](https://www.rsc.org/images/entities/char_2009.gif) 0.45 0.45![[thin space (1/6-em)]](https://www.rsc.org/images/entities/char_2009.gif) : :![[thin space (1/6-em)]](https://www.rsc.org/images/entities/char_2009.gif) 0.47 0.47 |
| BAM:Eu2+ + Sr1222:Eu2+ | 2700 K | 3000 K | ||||
|---|---|---|---|---|---|---|
| CRI | LE [lm W−1] | Ratios (BAM/1222/Red) | CRI | LE [lm W−1] | Ratio (BAM/1222/Red) | |
| Sr1222:Eu2+ + TM:Eu3+ | 83 | 359 | 0.09![[thin space (1/6-em)]](https://www.rsc.org/images/entities/char_2009.gif) : :![[thin space (1/6-em)]](https://www.rsc.org/images/entities/char_2009.gif) 0.40 0.40![[thin space (1/6-em)]](https://www.rsc.org/images/entities/char_2009.gif) : :![[thin space (1/6-em)]](https://www.rsc.org/images/entities/char_2009.gif) 0.51 0.51 |
85 | 357 | 0.11![[thin space (1/6-em)]](https://www.rsc.org/images/entities/char_2009.gif) : :![[thin space (1/6-em)]](https://www.rsc.org/images/entities/char_2009.gif) 0.42 0.42![[thin space (1/6-em)]](https://www.rsc.org/images/entities/char_2009.gif) : :![[thin space (1/6-em)]](https://www.rsc.org/images/entities/char_2009.gif) 0.46 0.46 |
| Sr1222:Eu2+ + LBLM:Sm3+ | 91 | 312 | 0.07![[thin space (1/6-em)]](https://www.rsc.org/images/entities/char_2009.gif) : :![[thin space (1/6-em)]](https://www.rsc.org/images/entities/char_2009.gif) 0.27 0.27![[thin space (1/6-em)]](https://www.rsc.org/images/entities/char_2009.gif) : :![[thin space (1/6-em)]](https://www.rsc.org/images/entities/char_2009.gif) 0.65 0.65 |
91 | 315 | 0.10![[thin space (1/6-em)]](https://www.rsc.org/images/entities/char_2009.gif) : :![[thin space (1/6-em)]](https://www.rsc.org/images/entities/char_2009.gif) 0.30 0.30![[thin space (1/6-em)]](https://www.rsc.org/images/entities/char_2009.gif) : :![[thin space (1/6-em)]](https://www.rsc.org/images/entities/char_2009.gif) 0.60 0.60 |
| Sr1222:Eu2+ + CASN:Eu2+ | 84 | 232 | 0.05![[thin space (1/6-em)]](https://www.rsc.org/images/entities/char_2009.gif) : :![[thin space (1/6-em)]](https://www.rsc.org/images/entities/char_2009.gif) 0.23 0.23![[thin space (1/6-em)]](https://www.rsc.org/images/entities/char_2009.gif) : :![[thin space (1/6-em)]](https://www.rsc.org/images/entities/char_2009.gif) 0.71 0.71 |
85 | 240 | 0.07![[thin space (1/6-em)]](https://www.rsc.org/images/entities/char_2009.gif) : :![[thin space (1/6-em)]](https://www.rsc.org/images/entities/char_2009.gif) 0.26 0.26![[thin space (1/6-em)]](https://www.rsc.org/images/entities/char_2009.gif) : :![[thin space (1/6-em)]](https://www.rsc.org/images/entities/char_2009.gif) 0.67 0.67 |
| Sr1222:Eu2+ + Sr258:Eu2+ | 89 | 305 | 0.07![[thin space (1/6-em)]](https://www.rsc.org/images/entities/char_2009.gif) : :![[thin space (1/6-em)]](https://www.rsc.org/images/entities/char_2009.gif) 0.27 0.27![[thin space (1/6-em)]](https://www.rsc.org/images/entities/char_2009.gif) : :![[thin space (1/6-em)]](https://www.rsc.org/images/entities/char_2009.gif) 0.65 0.65 |
89 | 308 | 0.10![[thin space (1/6-em)]](https://www.rsc.org/images/entities/char_2009.gif) : :![[thin space (1/6-em)]](https://www.rsc.org/images/entities/char_2009.gif) 0.30 0.30![[thin space (1/6-em)]](https://www.rsc.org/images/entities/char_2009.gif) : :![[thin space (1/6-em)]](https://www.rsc.org/images/entities/char_2009.gif) 0.60 0.60 |
| Sr1222:Eu2+ + MG:Mn4+ | 50 | 205 | 0.05![[thin space (1/6-em)]](https://www.rsc.org/images/entities/char_2009.gif) : :![[thin space (1/6-em)]](https://www.rsc.org/images/entities/char_2009.gif) 0.25 0.25![[thin space (1/6-em)]](https://www.rsc.org/images/entities/char_2009.gif) : :![[thin space (1/6-em)]](https://www.rsc.org/images/entities/char_2009.gif) 0.70 0.70 |
55 | 214 | 0.06![[thin space (1/6-em)]](https://www.rsc.org/images/entities/char_2009.gif) : :![[thin space (1/6-em)]](https://www.rsc.org/images/entities/char_2009.gif) 0.27 0.27![[thin space (1/6-em)]](https://www.rsc.org/images/entities/char_2009.gif) : :![[thin space (1/6-em)]](https://www.rsc.org/images/entities/char_2009.gif) 0.67 0.67 |
| Sr1222:Eu2+ + KSF:Mn4+ | 80 | 348 | 0.09![[thin space (1/6-em)]](https://www.rsc.org/images/entities/char_2009.gif) : :![[thin space (1/6-em)]](https://www.rsc.org/images/entities/char_2009.gif) 0.41 0.41![[thin space (1/6-em)]](https://www.rsc.org/images/entities/char_2009.gif) : :![[thin space (1/6-em)]](https://www.rsc.org/images/entities/char_2009.gif) 0.50 0.50 |
82 | 347 | 0.11![[thin space (1/6-em)]](https://www.rsc.org/images/entities/char_2009.gif) : :![[thin space (1/6-em)]](https://www.rsc.org/images/entities/char_2009.gif) 0.43 0.43![[thin space (1/6-em)]](https://www.rsc.org/images/entities/char_2009.gif) : :![[thin space (1/6-em)]](https://www.rsc.org/images/entities/char_2009.gif) 0.45 0.45 |
For both Eu3+ and Sm3+ the emission only slightly depends on the host material, therefore the results should hold true for most available hosts. For the highest LE and a high CRI Eu3+is the most suitable red emitter. Compared to CASN:Eu2+ an increase in LE of 31% (3000 K) or 38% (2700 K) is realized. For a high LE with an excellent CRI KSF:Mn4+ is the most suitable red emitter. It offers almost the same CRI as CASN:Eu2+ but with 25% (3000 K) or 30% (2700 K) higher LE. Sr258:Eu3+ and LBLM:Sm3+ exhibit no particularly strong advantages, but offer a good CRI with a LE higher than CASN:Eu. It should be noted that the performance of Mn4+ strongly depends on the host material. 660 nm emitting MGM:Mn4+results in a low LE and low CRI at the same time.
To enhance the CRI of Sr258:Eu2+ comprising pcLEDs YAG:Ce can be substituted with LuAG:Ce. This decreases the LE but increases the CRI to close to 90. All other investigated red phosphors, with the exception of LBLM:Sm3+ which behaves similar to Sr258:Eu2+, suffer from combination with LuAG:Ce and should be combined with YAG:Ce.
Another approach to warm-white light generation is the full-conversion near-UV LED. Its advantage is the low reabsorption since ideally all applied phosphors solely absorb in the near-UV spectral range. In this scenario Eu3+ offers the highest LE as well, but the CRI has decreased. Among the investigated red emitting phosphors only Sr258:Eu2+ and LBLM:Sm3+ exhibit a very good CRI of 89 and 91, respectively. The highest LE can be achieved with Eu3+, at the cost of a slightly decreased CRI.
Experimental section
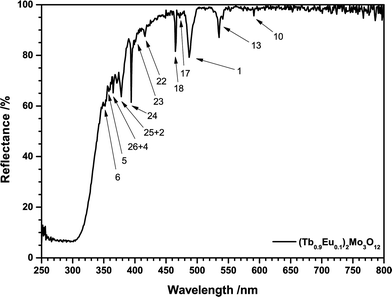
Powder samples of (Tb1−xEux)2Mo3O12 (TM:Eu3+) with 0 ≤ x ≤ 1 were prepared by conventional solid state reactions. Stoichiometric amounts of high purity Tb4O7 (99.99%, Treibacher), MoO3 (99.95%, AlfaAesar) and Eu2O3 (99.99%, Treibacher) were thoroughly blended in an agate mortar employing acetone as grinding medium. The resulting mixtures were dried, transferred to porcelain crucibles and calcined two times at 900 °C for 10 h in air with an intermediate grinding. After the first annealing step some particles emitting green-light or orange-light could be observed under a UV lamp in the powder, indicating the presence of pure Tb2Mo3O12and Eu2Mo3O12 instead of the solid solution. The second annealing step resulted in a homogeneously emitting solid solution powder. The Tb4O7 educt is of mixed valence, (Tb0.5IIITb0.5IV)4O7, therefore requiring reduction of Tb4+. Despite the low annealing temperature apparently all Tb4+ is reduced to Tb3+ as the samples exhibit a slightly yellowish body colour very unlike brownish Tb4O7. The reflection spectrum depicted in Fig. 3 underlines this conclusion. Ceramic discs were produced by pressing 100 mg of the synthesized powders at 0.87 GPa for two minutes in a hydraulic uniaxial press. The green bodies were sintered at 850 °C for 5 hours under air. If placed uncovered in the furnace, the ceramic discs exhibited brownish discolorations. Placing the green bodies between two alumina discs prevented the discoloration which is assumedly caused by partial oxidation of Tb3+ to Tb4+.XRD, fluorescence, reflection and decay measurements and temperature dependent reflection and external quantum efficiency (EQE) measurements were performed as published earlier.13 An integration sphere with an inner shell made of Spectralon was used for room temperature reflectance and quantum efficiency measurements. The lattice parameters were calculated from XRD patterns of the synthesized powders employing STOE WinXPOW software.14
Results and discussion
Three modifications of Tb2Mo3O12 and Eu2Mo3O12 exist, the high-temperature α- and β-phases, which crystallize in the monoclinic C12/c1 (15) and the tetragonal P![[4 with combining macron]](https://www.rsc.org/images/entities/char_0034_0304.gif) 21m (113) space group, respectively and the metastable orthorhombic Pba2 (32) β′ phase.15–18,51 The melting points of the Tb and Eu compounds are 1172 and 1144 °C, respectively. The α/β-transition occurs at 835 (Tb3+) and 881 °C (Eu3+) while the metastable β′ phase forms at 160 (Tb3+) and 180 °C (Eu3+).16 The XRD patterns depicted in Fig. 1 show that the β′ phase was obtained in this work as expected from the synthesis conditions.
21m (113) space group, respectively and the metastable orthorhombic Pba2 (32) β′ phase.15–18,51 The melting points of the Tb and Eu compounds are 1172 and 1144 °C, respectively. The α/β-transition occurs at 835 (Tb3+) and 881 °C (Eu3+) while the metastable β′ phase forms at 160 (Tb3+) and 180 °C (Eu3+).16 The XRD patterns depicted in Fig. 1 show that the β′ phase was obtained in this work as expected from the synthesis conditions.
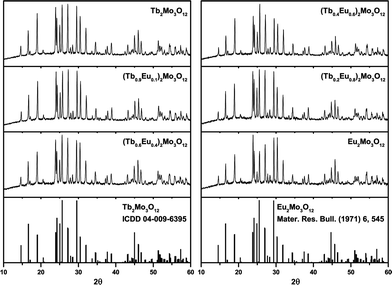 | ||
| Fig. 1 XRD patterns of the synthesized (Tb1−xEux)2Mo3O12 powders with x = 0, 0.1, 0.4, 0.6, 0.8, 1 and reference patterns of orthorhombic Tb2Mo3O12 and Eu2Mo3O12. | ||
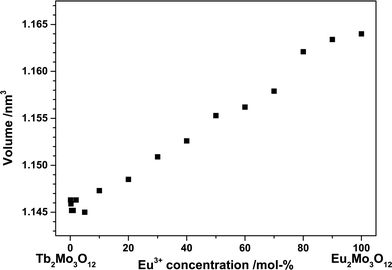
The ionic radii of Tb3+ and Eu3+ differ by merely 2% and both end members crystallize in the same space group. Therefore, according to Vegard's law, a complete solid solution series should exist with a linear dependence of the lattice constants on the Tb3+/Eu3+concentration.19 The unit cell volume for the synthesized powders plotted against the Eu3+ concentration in Fig. 2 exhibits an approximately linear behaviour. The unit cell's b and c axis are of almost the same length, rendering an exact determination from our powder samples difficult.
Both Eu3+ and Tb3+ exhibit characteristic reflection spectra in the UV and visible spectral range caused by multiple intraconfigurational [Xe]4f6 → [Xe]4f6 and [Xe]4f8 → [Xe]4f8 transitions, respectively. All transitions are parity forbidden according to Laporte rule so their probability and absorption strength is low. However, at sufficiently high activator concentrations the lines are intense enough to be readily distinguished as depicted in Fig. 3. The reflection spectra of all samples consist of a broad band and several lines. Furthermore, the high reflectance in the visible range indicates high sample quality and the absence of Tb4+. Incorporated Tb4+ would result in a brownish body colour due to a Tb3+/Tb4+ metal-to-metal charge transfer (MMCT) as can be observed in Tb4O7. The broad absorption band in the UV-C to UV-B range is assigned to ligand-to-metal charge transfer (LMCT) transitions. These are essentially transitions from O2− 2p to Mo6+ 4d or to Eu3+ 5d bands or orbitals and are commonly observed in Eu3+ doped molybdates.20–22 DOS calculations have shown that a 4d band of Mo6+ in molybdates is often located around 4 eV, matching the spectral region of the observed absorption band.23,24 Such transitions are spin and parity allowed and result in high absorption. Efficient excitation is possible via O2−/Eu3+ LMCT transitions and this mechanism has been widely applied in fluorescent lamps to excite Eu3+ in oxides.25,26 Contrary to that, the O2−/Mo6+ LMCT is often partly quenched at room temperature, resulting in poor excitability in that spectral region.53
In today's commercial pcLEDs the excitation wavelength is either around 400 nm for near-UV LEDs or around 450 nm for blue LEDs,4,27i.e. excitation via the CT bands is not possible. The Eu3+ activated samples exhibit two prominent absorption lines at 394 nm and 465 nm, originating from the 7F0 → 5L6 and 7F0 → 5D2 transitions. While the energy of these transitions fits to the emission spectra of near-UV and blue LED chips very well, the low absorption cross-section hinders an efficient application in phosphor converted LEDs (pcLEDs). Trivalent Terbium exhibits a relatively broad and strong line absorption multiplet peaking at 487 nm with a FWHM of 10 nm. This broad absorption can be assigned to transitions from the 7F6 ground state to the 5D4 state. The ligand field generated by the O2− ligands lifts the mj degeneracy of both states.28 Due to the symmetry of the dopant sites each ±mj pair is degenerate, so that for an odd number of f-electrons J + 1 distinct levels emerge, i.e. 7 and 5, respectively. The large number of potential transitions from and to the ground and excited state sublevels explains the observed broad absorption line.
The excitation spectra as depicted in Fig. 4 exhibit the different transitions of single and co-doped samples. As discussed earlier the broad structured band between 250 and 350 nm is attributed to the O2− → Mo6+ and Eu3+ LMCT, respectively. Due to the higher positive charge and reduction potential of Mo6+, the low-energy shoulder is assigned to Mo6+ LMCT, while the high-energy shoulder is assigned to Eu3+ LMCT. However, the Tb2Mo3O12 sample (a) exhibits a band apparently consisting of two components as well. Since no Eu3+ is present and the emission at 541.5 nm was monitored, this cannot be ascribed to a Eu3+ LMCT. The Tb3+ LMCT is at much higher energies, however, the lowest 4f–5d transition of Tb3+ is reported to be located around 275 nm in [TbCl6]3−.29 Therefore, this high-energy shoulder is tentatively assigned to a Tb3+ 4f–5d transition. The excitation of the Tb2Mo3O12 sample (a) was measured monitoring the green 541.5 nm emission of Tb3+. Peaks that could be attributed to specific transitions were assigned a number that can be found in Table 3 and Fig. 5. The Tb3+ excitation spectrum shows the 7F6 → 5D4 transition as a prominent feature as depicted in Fig. 4. Similarly the observed transitions in the Eu2Mo3O12 sample (c), monitored at the red 615 nm emission of Eu3+ were assigned numbers which are included in Table 3 and Fig. 5. While all transitions of Tb3+ seem to originate from the 7F6 ground state, in the Eu2Mo3O12 excitation spectra transitions that apparently originate from the excited 7F1, 7F2, and 7F3 states can be observed. According to Boltzmann equation, weighted with the respective number of degenerate states,30 the percentile population at 297 K of the four lowest-lying 7FJ levels in TM:Eu3+ is 68.9%, 28.6%, 2.49% and 0.015%, respectively. The 7F3 level is merely slightly populated and among the potential transitions only the 7F3 → 5D3 can be observed as a weak line multiplet centred at 447.5 nm. This can be explained by the transition being partially allowed due to ΔJ = 0.
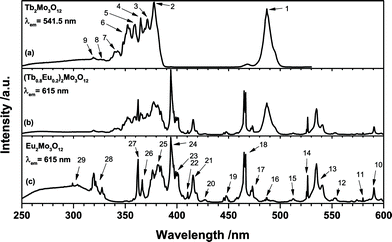 | ||
| Fig. 4 Excitation spectra of (a) Tb2Mo3O12, (b) (Tb0.6Eu0.4)2Mo3O12 and (c) Eu2Mo3O12 with emission monitored at 541.5 nm and 615 nm, respectively. | ||
| Number | Wavelength/nm | Wavenumber/103 cm−1 | Transitions |
|---|---|---|---|
| 1 | 487 | 20.5 | 7F6 → 5D4 |
| 2 | 378 | 26.5 | 7F6 → 5D3 |
| 3 | 371.5 | 26.9 | 7F6 → 5L10 |
| 4 | 363–369 | 27.1–27.5 | 7F6 → 5G6 + 5L9 + 5G5 |
| 5 | 359.5 | 27.8 | 7F6 → 5D2 |
| 6 | 348–355 | 28.2–28.7 | 7F6 → 5L8 +5G4 + 5L7 |
| 7 | 336–345 | 29.0–29.8 | 7F6 → 5L6 + 5G3 + 5G2 |
| 8 | ∼326 | ∼30.7 | 7F6 → 5D1 |
| 9 | 319 | 31.3 | 7F6 → 5D0 |
| 10 | 590.5 | 16.9 | 7F1 → 5D0 |
| 11 | 580 | 17.2 | 7F0 → 5D0 |
| 12 | 553 | 18.1 | 7F2 → 5D1 |
| 13 | 535 | 18.7 | 7F1 → 5D1 |
| 14 | 526.5 | 19.0 | 7F0 → 5D1 |
| 15 | 512.5 | 19.5 | 7F3 → 5D2 |
| 16 | 487 | 20.5 | 7F2 → 5D2 |
| 17 | 473 | 21.1 | 7F1 → 5D2 |
| 18 | 465 | 21.5 | 7F0 → 5D2 |
| 19 | 447.5 | 22.3 | 7F3 → 5D3 |
| 20 | 427 | 23.4 | 7F2 → 5D3 |
| 21 | 415 | 24.1 | 7F1 → 5D3 |
| 22 | 411 | 24.3 | 7F0 → 5D3 |
| 23 | 398–402 | 24.9–25.1 | 7F0 → 5L6 |
| 24 | 394 | 25.4 | 7F0 → 5L7 |
| 25 | 371–390 | 25.6–27.0 | 7F0 → 5L8 + 5Gj + 5L9 + 5L10 |
| 26 | 366.5 | 27.3 | 7F1 → 5D4 |
| 27 | 362.5 | 27.6 | 7F0 → 5D4 |
| 28 | 315–332 | 30.1–31.7 | 7F0 → 5Hj |
| 29 | 297–306 | 32.7–33.7 | 7F0 → 5Fj + 5Ij |
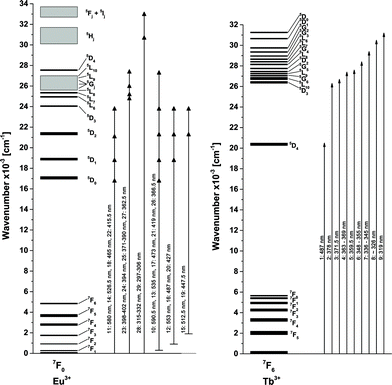 | ||
| Fig. 5 Fraction of the energy level diagram of Eu3+ and Tb3+ with observed transitions, created from Dieke.32 | ||
To further investigate this finding, temperature dependent excitation spectra of the red 615 nm emission of Eu2Mo3O12 were recorded (Fig. 6). Lines that were assigned to transitions from excited states increase in intensity with increasing temperature while those originating from 7F0 transitions decrease with increasing temperature due to thermal quenching of the emission. Furthermore, the 7F0 lines exhibit a blue-shift with increasing temperature as depicted in the inset of Fig. 6. The inset shows the lines attributed to the 7FJ → 5D0 (J = 0, 1) transitions, respectively. The 7F0 → 5D0 transition around 580 nm is strongly forbidden due to J = 0 ⇔ 0 and is therefore of weak intensity. The observed blue shift is the same for all 7F0 transitions and can be quantified to approximately 20 cm−1 from 100 to 500 K or 0.05 cm−1 K−1. The 7F1 → 5D0 transition around 591 nm exhibits no such shift as do none of the other transitions originating from either 7F1 or 7F2. Therefore, we conclude that the 7F0 ground state shifts to lower energy while the excited states remain at their respective energy position. Furthermore, a red-shift of the O2− → Mo6+ LMCT band can be observed with increasing temperature. A phase-transition can be ruled out as the cause as the shift progresses steadily within the 100 to 500 K range and the β → β′ transition occurs around 450 K.16 The orthorhombic Ln2Mo3O12 phase seems to possess negative thermal expansion coefficient according to Xiao et al.31 Though charge transfer transitions are not as sensitive to distance changes, the decreased O2−/Mo6+ distance could explain the observed red-shift.
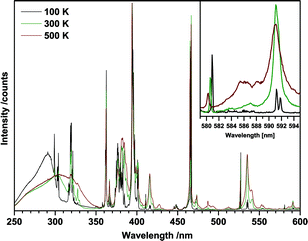 | ||
| Fig. 6 Temperature dependent excitation spectra of Eu2Mo3O12 monitoring the red 615 nm emission of Eu3+. The inset depicts the 7F0 → 5D0 and 7F1 → 5D0 transition lines. | ||
At 100 K the lines can be resolved to their respective Stark components. The inset of Fig. 6 depicts this for the 7F1 → 5D0 transition. The 7F1 level is split into J + 1 = 2 distinct Stark sublevels, resulting in two transitions peaking at 591.2 nm and 591.8 nm, respectively. Similarly, the 7F1 → 5D1 transition around 535 nm results in four lines, since both states are split into two distinct sublevels. From the spectral positions of the peaks of the four 7F0 → 5DJ (J = 0, 1, 2, 3) transitions the energy positions of the Stark sublevels of 5D0, 5D1, 5D2 and 5D3 were determined. The energetic position of the two 7F1 sublevels were calculated by applying these values to the spectral positions of the peaks of the two 7F1 → 5D0,1 transitions in the excitation spectrum. The determination of 7F2 sublevels was not possible since due to the large number of transitions involved the individual peaks could not be sufficiently discerned. The obtained values are listed in Table 4. The accuracy of the absolute values is at least 0.5 nm, corresponding to 30 to 15 cm−1, depending on the spectral position. The relative accuracy, i.e. the positions of the sublevels relative to each other is 0.1 nm, corresponding to 6 cm−1 or less.
| Level | m j | Energy [cm−1] |
|---|---|---|
| 7F0 | 0 | |
| 7F1 | 0 | 307 |
| ±1 | 323 | |
| 5D0 | 0 | 17![[thin space (1/6-em)]](https://www.rsc.org/images/entities/char_2009.gif) 215 215 |
| 5D1 | 0 | 18![[thin space (1/6-em)]](https://www.rsc.org/images/entities/char_2009.gif) 968 968 |
| ±1 | 19![[thin space (1/6-em)]](https://www.rsc.org/images/entities/char_2009.gif) 001 001 |
|
| 5D2 | 0 | 21![[thin space (1/6-em)]](https://www.rsc.org/images/entities/char_2009.gif) 492 492 |
| ±1 | 21![[thin space (1/6-em)]](https://www.rsc.org/images/entities/char_2009.gif) 468 468 |
|
| ±2 | 21![[thin space (1/6-em)]](https://www.rsc.org/images/entities/char_2009.gif) 422 422 |
|
| 5D3 | 0 | 24![[thin space (1/6-em)]](https://www.rsc.org/images/entities/char_2009.gif) 337 337 |
| ±1 | 24![[thin space (1/6-em)]](https://www.rsc.org/images/entities/char_2009.gif) 355 355 |
|
| ±2 | 24![[thin space (1/6-em)]](https://www.rsc.org/images/entities/char_2009.gif) 372 372 |
|
| ±3 | 24![[thin space (1/6-em)]](https://www.rsc.org/images/entities/char_2009.gif) 393 393 |
Emission spectra of (Tb1−xEux)2Mo3O12 (0 < x < 1) upon 487 nm excitation were recorded and are presented in Fig. 7(a). The 487 nm radiation excites the 7F6 → 5D4 transition in Tb3+. The corresponding 5D4 → 7F5 emission peaking at 541.5 nm can be observed in all spectra, but decreases in intensity with increasing Eu3+ concentration. At x > 0.2 the green Tb3+ emission is completely quenched. Even at low concentrations such as x = 0.001 Eu3+ emission can be observed, indicating a highly efficient Tb3+ to Eu3+ energy transfer. The dominant peaks of the Eu3+ emission are located around 590 nm, 615 nm, and 700 nm, corresponding to transitions from 5D0 to 7FJ (J = 1, 2, 4), respectively. The nature of the Eu3+ emission will be discussed in more detail later in this work. Upon exciting at 487 nm via Tb3+, the Eu3+ emission intensity increases with increasing Eu3+ concentration until a maximum is reached at 20% after which the intensity starts to decreases. This is mainly caused by the decreasing Tb3+ concentration and consequent decreasing absorption in the 487 nm range. A second potential factor is concentration quenching of the Eu3+ emission. To disentangle these two phenomena the emission was recorded upon 465 nm excitation which directly excites the Eu3+ ions (7F0 → 5D3) and eliminates the influence of the energy transfer on the emission intensity. The spectra are presented in Fig. 7(b). If Eu3+ is directly excited the highest emission intensity can be achieved for the sample comprising 60% Eu3+.
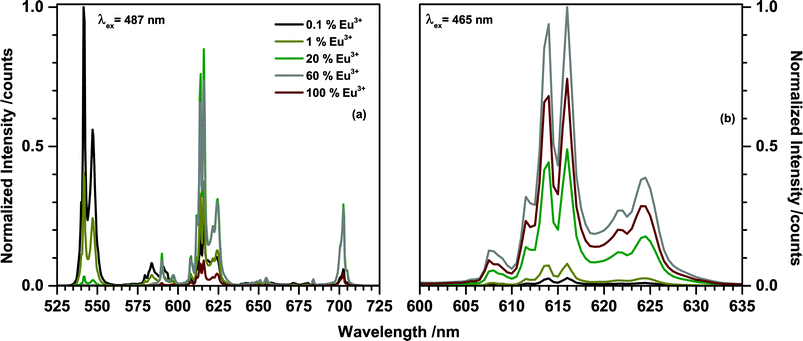 | ||
| Fig. 7 Emission spectra of (Tb1−xEux)2Mo3O12 with different Eu3+ concentrations upon (a) 487 nm excitation and (b) 465 nm excitation. | ||
To determine the thermal quenching (TQ) behaviour of TM:Eu3+, emission spectra of (Tb0.6Eu0.4)2Mo3O12 were recorded in the range of 350 to 800 K with a high temperature sample holder. Similar to the temperature-dependent excitation spectra, a blue-shift of some of the Stark sublevels with increasing temperature could be observed (Fig. 8(a)). This is attributed to lattice contraction and an increase of the strength of the ligand field influencing the central Eu3+ ion. This causes an increase of the Stark splitting and consequently of the energy distance between the 5D0 and some of the 7FJ sublevels.
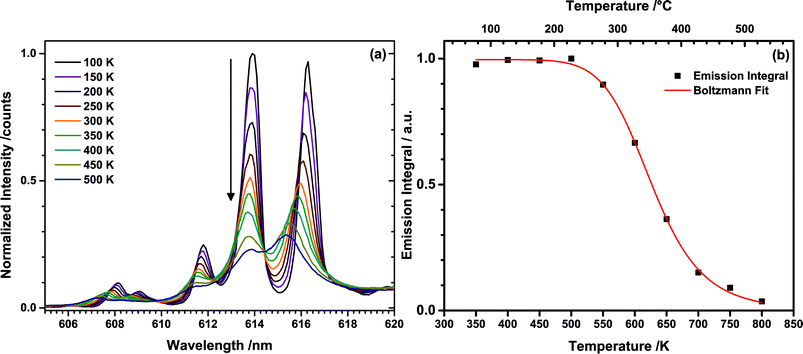 | ||
| Fig. 8 (a) Temperature dependent emission spectra of the 5D0 → 7F2 transition of Eu3+ upon 487 nm excitation (Tb3+) and (b) integrated emission intensities with the corresponding Boltzmann fit. | ||
Emission intensities in the range of 550–800 nm were integrated and plotted over the temperature as depicted in Fig. 8(b). The emission intensity remains constant up to a temperature of 500 K, while at higher temperature thermal quenching sets in. The normalized data points were fitted with the Boltzmann equation
 | (1) |
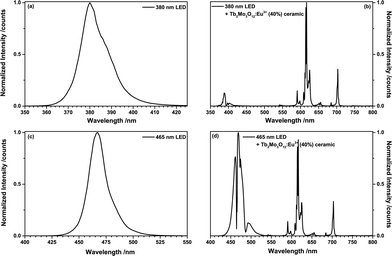
To investigate the LED performance of TM:Eu3+, a (Tb0.6Eu0.4)2Mo3O12 ceramic disc (0.4 mm thickness) was placed on a 380 nm UV-emitting LED and a 465 nm blue LED, respectively. Fig. 9(a) depicts the emission spectrum of the 380 nm LED and Fig. 9(b) shows the spectrum of the same LED behind a (Tb0.6Eu0.4)2Mo3O12 ceramic disc. The 380 nm LED excites both Tb3+ and Eu3+. Tb3+ absorbs mainly via the 7F6 → 5D3 and 5L10 transitions at 378 nm and 372 nm, respectively. Eu3+ absorbs via the 7F0 → 6L8 and 6L7 transitions at 394 nm and 399 nm, respectively. Almost full conversion of the UV radiation could be achieved, resulting in an orange-red CIE1931 colour point of x = 0.641, y = 0.325. Fig. 9(c) and (d) depict the emission spectra of a blue 465 nm LED and of the same LED behind the (Tb0.6Eu0.4)2Mo3O12 ceramic disc. The blue LED emission is absorbed by both Tb3+ and Eu3+. The involved transitions are Tb3+ 7F6 → 5D4 (487 nm) and Eu3+ 7F0 → 5D2 (465 nm) and to a lesser extend Eu3+ 7F1 → 5D2 (473 nm). The CIE 1931 colour point is in the purple region with x = 0.213, y = 0.114.
In both LEDs TM:Eu3+ exhibits increased absorption strength compared to a non-sensitized Eu3+ phosphor due to the simultaneous absorption by Tb3+and Eu3+. No Tb3+ emission could be observed due to the very efficient energy transfer to Eu3+.
External quantum efficiencies (EQE) were determined for excitation at 465 nm (Eu3+ excitation) and 487 nm (Tb3+ excitation). Here, the EQE is defined as
 | (2) |
The results are listed in Table 5. The EQE increases with increasing Eu3+ concentration until it reaches a maximum of 94% at 20% Eu3+. At low Eu3+ concentrations the fraction of photons absorbed by the host structure without conversion to red light is comparatively large, resulting in the observed lower EQE. Increasing the Eu3+ concentration further results in a decrease of EQE. This is attributed to concentration quenching. The emission spectrum of the 20% Eu3+ sample already possesses a red colour point with hardly any green Tb3+ emission visible. Therefore, TM:Eu3+ (20%) is the most promising sample of the concentration series, combining a high EQE with a red colour point.
| Eu3+ concentration [%] | EQE (λex = 465 nm) | EQE (λex = 487 nm) |
|---|---|---|
| 0 | 74 | |
| 1 | 56 | 80 |
| 5 | 70 | 89 |
| 10 | 74 | 85 |
| 20 | 73 | 94 |
| 40 | 75 | 80 |
| 50 | 63 | 72 |
| 60 | 65 | 67 |
| 80 | 46 | 48 |
| 100 | 48 |
Decay curve measurements for the Eu3+ 5D2 → 7F2 emission around 615 nm upon 487 nm (Tb3+ 7F6 → 5D4) excitation presented in Fig. 10(a) revealed the existence of a pronounced rise time of the Eu3+ emission. The established term rise time describes the phenomenon that the emission intensity increases for a period of time following excitation. In the diagram it is visible as a rising of the decay curves in the range of 10−4 s. The emission intensity measured in a decay experiment is proportional to the number of excited activator ions. Therefore, an increase of the emission intensity implicates an increase in the number of excited activator ions over time. Since the excitation source is switched off at the beginning of a decay measurement, this phenomenon indicates some sort of energy transfer. Either within the activator ion, i.e. from one excited state to the other or between two separate ions. Upon 465 nm excitation (Eu3+ 7F0 → 5D2) no rise time could be observed (Fig. 10(b)). Therefore, the rise time is caused by energy transfer from Tb3+ to Eu3+. As depicted in Fig. 10(a) the length of the rise time decreases with increasing Eu3+ concentration due to decreasing mean minimal sensitizer and activator distance. The decay time of Eu3+ decreases independent of the excitation pathway, which is caused by concentration quenching and reflects the decreasing internal quantum efficiency (IQE). The IQE is defined here as the probability of the occurrence of a radiative transition to the ground state as opposed to that of a non-radiative relaxation and is proportional to the decay time. The value differs from the EQE in so far as losses occurring due to competing absorption processes and reabsorption of generated photons in the material are disregarded. The sample possessing the highest IQE is the 0.1% Eu3+ sample contrary to the 20% sample possessing the highest EQE. This demonstrates the influence of host absorption on the EQE of activators with low absorption coefficients. Several attempts to determine the energy transfer rate from rise time curves can be found in literature.33–38
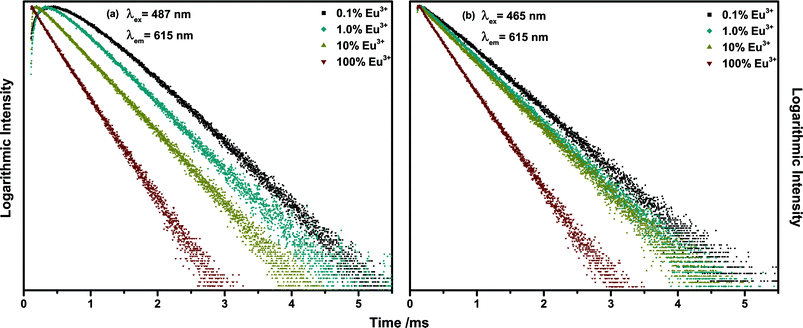 | ||
| Fig. 10 Decay curves of 615 nm emission of (Tb1−xEux)2Mo3O12 with x = 0.001, 0.01, 0.1, 1 under (a) 487 nm and (b) 465 nm excitation. | ||
However, these models are only valid if a complete energy transfer occurs from the sensitizer to the activator, i.e. a transfer efficiency of ηET = 1. This is obviously not the case for TM:Eu3+ with Eu3+ concentrations lower than 20% as Tb3+ emission can be observed. Therefore, the following differential equations are used to model the decay behaviour:
 | (3) |
 | (4) |
N Tb and NEu are the number of excited Tb3+ and Eu3+ ions, respectively. ETTb,Eu is the rate of the energy transfer from Tb3+ to Eu3+. λTband λEu are the combined rates of non-radiative and radiative transitions to the ground state of the respective ion. Solving the differential equations results in
 | (5) |
There is no unique solution to this function when fitting a decay curve. It is only possible to determine the sum of ETTb,Eu and λTb but not their separate values. However, eqn (5) can be simplified to
| NEu(t) = −C[e−λTb,totalt−e−λEut] | (6) |
To extract the energy transfer rate ETTb,Eu from λTb,total two methods can be employed. One way is to derive it from the energy transfer efficiency ηET, which is defined as the ratio of the energy transfer rate to the total decay rate:
 | (7) |
| ETTb,Eu = λTb,totalηET | (8) |
The energy transfer efficiency ηET is frequently calculated from either luminescence intensities or lifetimes by employing equations
 | (9) |
 | (10) |
Therefore, the ratio of ETTb,Eu and λTb was approximated from emission spectra. Under the assumption that all Eu3+ emission stems from energy transfer from Tb3+, the emission integral of Eu3+ is proportional to ETTb,Eu. Furthermore, the emission integral of Tb3+ can be assumed to be proportional to λTb. Consequently, the ratio of the emission integrals of Tb3+ and Eu3+ will be equal to the ratio of λTb and ETTb,Eu, henceforth denoted as RET.
 | (11) |
Considering that
| λTb + ETTb,Eu = λTb,total, |
 | (12) |
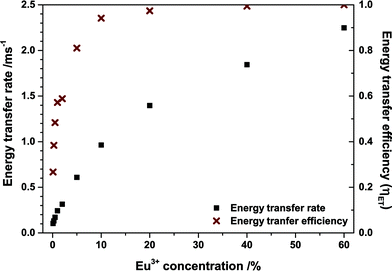
Energy transfer rates were calculated with eqn (12). In Fig. 11 the energy transfer rate and the energy transfer efficiency are plotted in dependence on the Eu3+ concentration. The transfer rate increases steadily due to a decreasing mean minimal distance from Tb3+ to Eu3+ while the efficiency converges to unity. No rate could be calculated for the 80% sample as the rise time can hardly be observed in that case due to its very short duration.
Energy transfer can occur either by exchange interaction or multipolar interaction.41 Exchange interaction is generally assumed to occur only if the mutual separation between sensitizer and activators ions is not larger than about 0.3 nm.42,43 Generally, Blasse's equation is employed to determine the critical distance of the energy transfer.44–47 However, the equation uses the sum of sensitizer and activator concentration and effectively calculates the mean minimum distance within the combined group of sensitizer and activator ion and not the mean minimum distance from the sensitizer to the activator. In case of TM:Eu3+ the calculated distance does not change as Eu3+ substitutes Tb3+ and the sum remains unity. Another method to approximate the energy transfer mechanism is by employing the distance dependence of the energy transfer efficiency.
To disentangle the relation of transfer efficiency and sensitizer–activator distance in a given material, I0/I or τ0/τ are frequently plotted against the concentration of the activator ion.44–47 This stems from the relations  for multipolar interaction and
  for exchange interaction. These relations were approximated by Reisfeld from Dexter's calculations.41 From eqn (10) follows that I0/I value is equal to
  . By employing the values for ηET obtained from fitting the rise time curves, the plots depicted in Fig. 12 were attained.
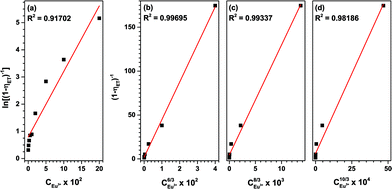 | ||
| Fig. 12 Dependence of energy transfer rates on (a) CEu3+6/3, (b) CEu3+8/3 and (c) CEu3+10/3 and (d) the dependence of ln(I0/I (Tb3+)) on CEu3+. | ||
These plots depict the proportionality of the energy transfer efficiency to the Eu3+ concentration to the power of 1, 6/3, 8/3 and 10/3, respectively. An R2 of 0.997 was achieved for C6/3, strongly pointing at a dipole–dipole ET mechanism. This is in good agreement with the published literature on Tb3+ to Eu3+ energy transfer.33,44,48
Conclusions
In warm-white pcLEDs the highest LE and very good CRI values can be achieved by employing Eu3+ activated phosphors as the red emitter. While Eu3+ suffers from weak absorption in the blue and near-UV spectral region, Tb2Mo3O12:Eu3+ shows increased absorption in both ranges due to combined absorption from Tb3+ and Eu3+. Due to a very efficient energy transfer from Tb3+ to Eu3+ the phosphor exhibits solely red emission at Eu3+ concentration of 20% and higher. A method to determine energy transfer rates from rise time curves and emission spectra has been developed and was used to calculate the energy transfer efficiency and investigate the nature of the energy transfer mechanism. The energy transfer follows the dipole–dipole mechanism and the transfer efficiency is independent of the temperature but depends strongly on the Eu3+ concentration. Temperature-dependent excitation spectra revealed that Eu3+ 7F1, 7F2 and 7F3 levels are thermally populated at room temperature and transitions originating from these levels can be observed.By using TM:Eu3+ ceramics a full conversion of a 380 nm LED and reasonable conversion of a blue 465 nm LED was achieved. The quantum efficiency depends on the Eu3+ concentration and reached a maximum of 87% in (Tb0.8Eu0.2)2Mo3O12. These observations show that TM:Eu3+ is a very promising candidate as a radiation converter for warm-white pcLEDs and underline the potential of red line emitters for high efficiency pcLEDs with a very good CRI.
Acknowledgements
This work was generously financially supported by Merck KGaA, Darmstadt, Germany.Notes and references
- E. F. Schubert and J. K. Kim, Science, 2005, 308, 1274 CrossRef CAS PubMed.
- S. C. Allen and A. J. Steckl, Appl. Phys. Lett., 2008, 92, 143309 CrossRef PubMed.
- LEDs for lighting applications, ed. P. Mottier, ISTE Ltd, London, 2009 Search PubMed.
- Y. Narukawa, M. Ichikawa, D. Sanga, M. Sano and T. Mukai, J. Phys. D: Appl. Phys., 2010, 43, 354002 CrossRef.
- M. Born and T. Jüstel, Chem. Unserer Zeit, 2006, 40, 294 CrossRef CAS.
- R.-J. Xie and N. Hirosaki, Sci. Technol. Adv. Mater., 2007, 8, 588 CrossRef CAS PubMed.
- A. A. Setlur, Electrochem. Soc. Interface, 2009, 18, 32 CAS.
- R. Mueller-Mach, G. O. Mueller, M. R. Krames, H. A. Höppe, F. Stadler, W. Schnick, T. Jüstel and P. Schmidt, Phys. Status Solidi A, 2005, 202, 1727 CrossRef CAS.
- P.-C. Hung and J. Y. Tsao, J. Disp. Technol., 2013, 9, 405 CrossRef.
- A. Žukauskas, R. Vaicekauskas, F. Ivanauskas, H. Vaitkevičius and M. S. Shur, Appl. Phys. Lett., 2008, 93, 51115 CrossRef PubMed.
- J. Y. Tsao, J. J. Wierer Jr, L. E. S. Rohwer, M. E. Coltrin, M. H. Crawford, J. A. Simmons, P.-C. Hung, H. Saunders, D. S. Sizov, R. Bhat and C.-E. Zah, in III-Nitride Based Light Emitting Diodes and Applications, ed. T.-Y. Seong, J. Han, H. Amano and H. Morkoc, Springer, Dordrecht, 2013, p. 11 Search PubMed.
- S. Adachi and T. Takahashi, J. Appl. Phys., 2008, 104, 23512 CrossRef PubMed.
- F. Baur, A. Katelnikovas, S. Sakirzanovas, R. Petry and T. Jüstel, Z. Naturforsch., B: J. Chem. Sci., 2014, 69, 183 CAS.
- WinXPOW, STOE & Cie GmbH, Darmstadt, Germany, 2011 Search PubMed.
- E. T. Keve, S. C. Abrahams, K. Nassau and A. M. Glass, Solid State Commun., 1970, 8, 1517 CrossRef CAS.
- L. H. Brixner, P. E. Bierstedt, A. W. Sleight and M. S. Licis, Mater. Res. Bull., 1971, 6, 545 CrossRef CAS.
- K. Nassau, J. W. Shiever and E. T. Keve, J. Solid State Chem., 1971, 3, 411 CrossRef CAS.
- S. C. Abrahams, C. Svensson and J. L. Bernstein, J. Chem. Phys., 1980, 72, 4278 CrossRef CAS PubMed.
- L. Vegard, Z. Phys., 1921, 5, 17 CrossRef CAS.
- A. Katelnikovas, J. Plewa, S. Sakirzanovas, D. Dutczak, D. Enseling, F. Baur, H. Winkler, A. Kareiva and T. Jüstel, J. Mater. Chem., 2012, 22, 22126 RSC.
- P. S. Dutta and A. Khanna, ECS J. Solid State Sci. Technol., 2013, 2, R3153–R3167 CrossRef CAS PubMed.
- X. Liu, L. Li, H. M. Noh, B. K. Moon, B. C. Choi and J. H. Jeong, Dalton Trans., 2014, 43, 8814 RSC.
- J.-Y. Chen, Q.-R. Zhang, T.-Y. Liu, Z.-X. Shao and C.-Y. Pu, Chin. Phys. Lett., 2007, 24, 1660 CrossRef CAS.
- W. Zhang, J. Sun, X. Wang, G. Shen and D. Shen, CrystEngComm, 2012, 14, 3490 RSC.
- H. Yamamoto, S. Shionoya and W. M. Yen, Practical applications of phosphors, CRC Press, Boca Raton, FL, 2007 Search PubMed.
- A. M. Srivastava and T. J. Sommerer, Electrochem. Soc. Interface, 1998, 7, 28 CAS.
- E. F. Schubert, Light-emitting diodes, Cambridge Univ. Press, Cambridge, 2010 Search PubMed.
- J.-C. G. Bünzli and S. V. Eliseeva, in Lanthanide Luminescence: Photophysical, Analytical and Biological Aspects, ed. P. Hänninen and H. Härmä, Springer-Verlag. Berlin, Heidelberg, 2011, p. 1 Search PubMed.
- L. J. Nugent, R. D. Baybarz and J. L. Burnett, J. Phys. Chem., 1973, 77, 1528 CrossRef CAS.
- E. Würzberg, J. Chem. Phys., 1976, 64, 1254 CrossRef PubMed.
- X. L. Xiao, Y. Z. Cheng, J. Peng, M. M. Wu, D. F. Chen, Z. B. Hu, R. Kiyanagi, J. S. Fieramosca, S. Short and J. Jorgensen, Solid State Sci., 2008, 10, 321 CrossRef CAS PubMed.
- G. H. Dieke, H. M. Crosswhite and H. Crosswhite, Spectra and energy levels of rare earth ions in crystals, Interscience Publishers, New York, 1968 Search PubMed.
- M. O. Rodrigues, J. D. L. Dutra, L. A. O. Nunes, G. F. de Sá, W. M. de Azevedo, P. Silva, F. A. A. Paz, R. O. Freire and S. A. Júnior, J. Phys. Chem. C, 2012, 116, 19951 CAS.
- M. L. Debasu, D. Ananias, J. Rocha, O. L. Malta and L. D. Carlos, Phys. Chem. Chem. Phys., 2013, 15, 15565 RSC.
- M. L. Debasu, D. Ananias, A. G. Macedo, J. Rocha and L. D. Carlos, J. Phys. Chem. C, 2011, 115, 15297 CAS.
- Y. Ruan, Q. Xiao, W. Luo, R. Li and X. Chen, Nanotechnology, 2011, 22, 275701 CrossRef PubMed.
- R. M. Ranson, E. Evangelou and C. B. Thomas, Appl. Phys. Lett., 1998, 72, 2663 CrossRef CAS PubMed.
- G. U. Caldiño, J. Phys.: Condens. Matter, 2003, 15, 3821 CrossRef.
- B. C. Joshi, R. Lohani and B. Pande, Indian J. Pure Appl. Phys., 2001, 39, 443 CAS.
- P. I. Paulose, G. Jose, V. Thomas, N. V. Unnikrishnan and M. K. R. Warrier, J. Phys. Chem. Solids, 2003, 64, 841 CrossRef CAS.
- R. Reisfeld, E. Greenberg, R. Velapoldi and B. Barnett, J. Chem. Phys., 1972, 56, 1698 CrossRef CAS PubMed.
- Y. Wang and D.-Y. Wang, J. Electrochem. Soc., 2006, 153, H166 CrossRef CAS PubMed.
- T.-W. Kuo, C.-H. Huang and T.-M. Chen, Opt. Express, 2010, 18, A231 CrossRef CAS PubMed.
- J. Zhou and Z. Xia, J. Mater. Chem. C, 2014, 2, 6978 RSC.
- M. Müller and T. Jüstel, J. Lumin., 2014, 155, 398 CrossRef PubMed.
- Z. Yang, S. Ma, H. Yu, F. Wang, X. Ma, Y. Liu and P. Li, J. Alloys Compd., 2011, 509, 76 CrossRef CAS PubMed.
- Z. Fen and T. Wanjun, Opt. Mater., 2014, 37, 561 CrossRef CAS PubMed.
- T. Jiang, X. Yu, X. Xu, H. Yu, D. Zhou and J. Qiu, Opt. Mater., 2014, 36, 611 CrossRef CAS PubMed.
- Z. Xia, J. Zhuang and L. Liao, Inorg. Chem., 2012, 51, 7202–7209 CrossRef CAS PubMed.
- Z. Xia, J. Zhuang, A. Meijerink and X. Jing, Dalton Trans., 2013, 42, 6327 RSC.
- V. V. Atuchin, A. S. Aleksandrovsky, O. D. Chimitova, A. S. Krylov, M. S. Molokeev, B. G. Bazarov, J. G. Bazarova and Z. Xia, Opt. Mater., 2014, 36, 1631–1635 CrossRef CAS PubMed.
- Color Calculator, Osram Sylvania, Danvers, MA, USA, 2011 Search PubMed.
- M. Wiegel and G. Blasse, J. Solid State Chem., 1992, 99, 388–394 CrossRef CAS.
Footnote |
| † Electronic supplementary information (ESI) available: CIE1931 colour points of TM:Eu3+ with various Eu3+ concentrations upon 487 nm excitation. See DOI: 10.1039/c4tc02588a |
| This journal is © The Royal Society of Chemistry 2015 |

