Synthesis, structure and optical properties of cerium-doped calcium barium phosphate – a novel blue-green phosphor for solid-state lighting
Received
18th August 2014
, Accepted 20th October 2014
First published on 20th October 2014
Abstract
A new blue-green phosphor, Ca6BaP4O17:Ce3+, which can be prepared by conventional solid-state synthesis, is reported as a candidate phosphor for solid-state lighting with near-ultraviolet LEDs. Under excitation at around 400 nm, Ca6BaP4O17:Ce3+ shows strong blue-green emission with the peak position at 477 nm. Ce3+,Si4+ co-doping is found to enhance the luminous intensity, and the unique emission characteristics of this combination are studied and related to the crystal structure. Ca6BaP4O17 is an exceptional host material, which also accommodates Eu2+, emitting strong yellow light under 400 nm excitation. A fabricated white LED, combining Ca6BaP4O17:Ce3+,Si4+ with Ca6BaP4O17:Eu2+ and a red CaAlSiN3:Eu2+ phosphor, achieved a luminous efficacy of 45 lm W−1 with a color-rendering index of 93 around the correlated color temperature of 4500 K.
1 Introduction
White light-emitting diodes (LEDs) consisting of an InGaN LED and phosphors have become widely available as an environmentally friendly lighting system known as solid-state lighting (SSL). Due to their low energy consumption, long lifetime, and the elimination of the risk of hazardous Hg exposure, the replacement of conventional lighting sources by LEDs has accelerated in recent years. Different configurations are possible for white LED, based on either a blue LED or a near-ultraviolet (UV) LED.1,2 Although the most widely used white LEDs consist of a blue InGaN LED combined with various phosphors, finding bright phosphors that are well-matched with a near-UV LED would be a good impetus for this alternative approach to white LEDs.
Many Ce3+-containing phosphors, including oxides, sulfides, and nitrides, have been proposed as color-converting materials for SSL. However, only a few Ce3+-doped oxide phosphors are genuine candidates for white LEDs since oxide hosts rarely offer excitation in the near-UV or blue part of the spectrum. The garnet system, YAG:Ce3+, is an important exception, exhibiting a large red shift in the 5d energy level of Ce3+ such that it absorbs in the blue and emits in the yellow.3 It plays an important role in SSL based upon blue LEDs emitting at 460 nm. However, its excitation band matches with only blue light and restricts its application for near-UV. The luminescence of Ce3+ in perovskite hosts such as CaHfO3, LaScO3 and GdScO3 is more typical of oxide systems;4 the wavelength of the Ce3+ excitation band in these materials extends up to around 350 nm, but it is too short to meet the excitation wavelength range for near-UV LEDs at ∼400 nm. In terms of Ce3+-doped oxide phosphors that can be excited at around 400 nm and emit in the visible, among the few examples are Sr2Ba(AlO4F)1−x(SiO5)x:Ce3+ and Ba9Y2Si6O24:Ce3+, the latter exhibiting a quantum efficiency of 60% for emission across a broad part of the visible spectrum.5,6
We previously reported the discovery and crystal structure of Ca6BaP4O17 (hereafter referred to as CBP) and explored the potential of its Eu2+-activated derivative for use as a phosphor in SSL. CBP:Eu2+ emits a strong yellow light under excitation from the near-UV to the blue.7 Here we report CBP:Ce3+ for a near-UV LED which proves to be an exceptional Ce-based blue-green phosphate phosphor showing bright emission with a high internal quantum yield. To the best of our knowledge, this is the first report of a Ce-doped phosphate phosphor enabling excitation with a near-UV LED. Co-doped CBP:Ce3+,Si4+ phosphors have also been prepared and enhance the blue-green emission for the high Ce concentration region, substituting the P site with Si. We have investigated the unique emission performance due to the lattice expansion accompanying an increasing Ce,Si co-doping concentration. It is possible to correlate the unit cell volume of the CBP host lattice with the position of the lowest Ce3+ 4f–5d transition.
The CBP host is one of the few phosphors that can accommodate both Eu2+ and Ce3+ with different emission colors when excited with a near-UV LED. Phosphors co-doped with Ce3+ and Eu2+, such as CaAl2Si2O8,8 Li2SrSiO4,9 and Ca8La2(PO4)6O2,10 have been proposed before, but none are well adapted for near-UV LEDs. In the present work, the luminous efficacy of a white LED fabricated by combining CBP:Ce3+,Si4+, CBP:Eu2+, CaAlSiN3:Eu2+ and a near-UV LED was 45 lm W−1 with a color rendering index, Ra, of 93.
2 Experimental
2.1 Synthetic procedures
Phase pure samples of CBP:Ce3+ were synthesized by a conventional solid state reaction between CaCO3 (Hakushin Chemicals), BaCO3 (Hakushin Chemicals), CaHPO4 (Alfa Aesar) and CeO2 (Alfa Aesar). The ground mixtures of the starting materials were placed in alumina crucibles and heated in a reducing atmosphere of 5% H2 + 95% N2 in the range of 1250–1300 °C for 10 h. CBP:Ce3+,Si4+ Co-doped samples were readily prepared by adding SiO2 (Tatsumori) to the starting materials, with the same synthesis conditions as those for CBP:Ce3+. Co-doping samples were substituted in the chemical formula of (Ca1−xCex)6Ba(P1−6x/4Si6x/4)4O17 considering the charge balance. After synthesis, the samples were crushed into fine powders for characterisation.
2.2 Crystallography and optical characterization
Laboratory powder X-ray diffraction (PXRD) data were obtained on a PANalytical X'Pert Powder diffractometer (Bragg–Brentano geometry) using Cu-Kα radiation and a position sensitive detector (X'Celerator) with a step size of 0.02° in the range of 2θ = 10–120°. Calculations of the unit cell volumes were carried out with the nonlinear, least-squares cell-refinement program, UNITCELL.11 The crystal structure of CBP was depicted in VESTA.12
Photoluminescence and photoluminescence excitation spectra at room temperature were measured using a Horiba FluoroLog-3 spectrometer and a Hitachi spectrometer (model F4500). The UV-vis reflectance spectra were measured on a PerkinElmer Lambda 750 spectrophotometer. The photoluminescence quantum efficiency was measured from PL measurements with an integrating sphere equipped with a 150 W Xe lamp and a multichannel spectrophotometer (model MCPD7000; Otsuka Electronics). The temperature-dependence of the photoluminescence was measured using a multichannel spectrophotometer (model MCPD7000; Otsuka Electronics).
2.3 White LED fabrication
White LEDs were fabricated by embedding the Ca6BaP4O17:Ce3+,Si4+(blue-green), Ca6BaP4O17:Eu2+(yellow) and CaAlSiN3:Eu2+(red) phosphors in a transparent silicone resin; the down-converter was packaged with 1 W InGaN LED chips, targetting a correlated color temperature of around 4500 K.
3 Results and discussion
3.1 Phase identification
The as-prepared powder of CBP is white for the pure sample with a slightly bluish tinge for doped samples. The body colors of the samples become grayish as the Ce concentration increases. Some defects may have been induced by the substitution of the divalent site with trivalent Ce3+.
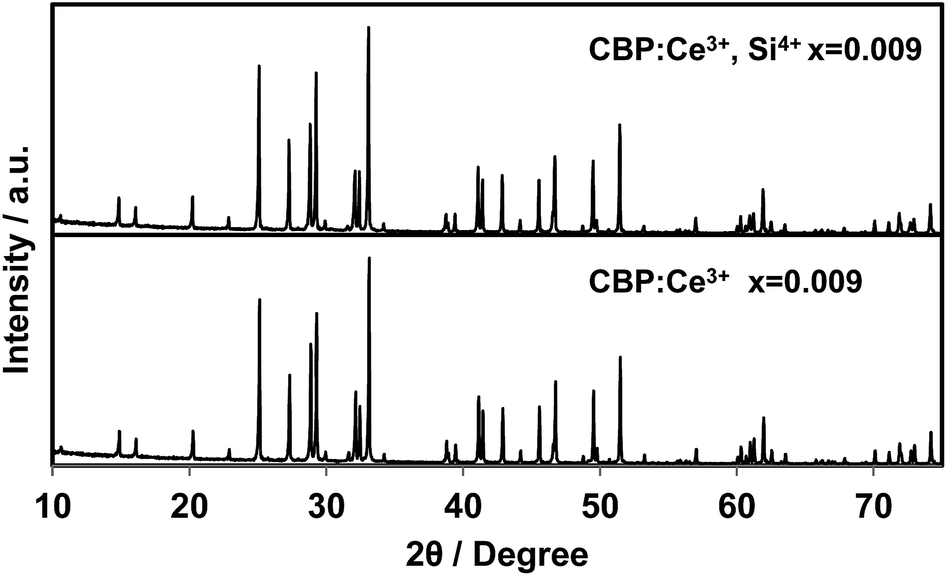
There is no JCPDS ICDD PDF for CBP since the structure of CBP has only recently been solved in our previous work.7 The phase identification was achieved by comparing the PXRD pattern from CBP:Ce3+ with that from CBP:Eu2+. As shown in Fig. 1, the PXRD pattern for CBP:Ce3+ is indistinguishable from the one for CBP:Eu2+.
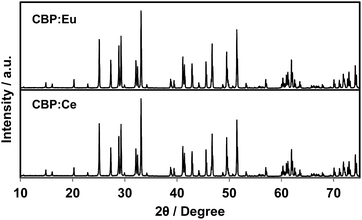 |
| | Fig. 1 Experimental PXRD patterns of CBP:Eu and CBP:Ce in the range of 2θ = 10–75°. | |
CBP has a monoclinic structure in the space group C2/m with a single Ba site and two Ca sites (Fig. 2).7 The Ba site is coordinated by twelve oxygen atoms with an average bond length of 3.04 Å, the Ca1 site by eight oxygen atoms with an average bond length of 2.51 Å, and the Ca2 site by seven oxygen atoms with an average bond length of 2.42 Å. Schematic illustrations of the coordination around the Ba and Ca sites are depicted in Fig. 3. The two P sites are in PO4 tetrahedra, which are isolated from other PO4 tetrahedra. The structure also contains an oxide ion that is not part of a PO4 tetrahedron; it is coordinated to Ca1 and Ca2, but not to Ba.
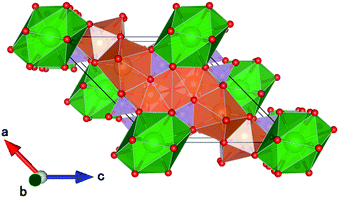 |
| | Fig. 2 Schematic crystal structure illustrations of CBP projected onto the (010) plane. Ba is green, Ca is brown, P is mauve and oxygen is red. | |
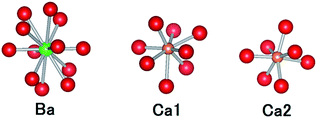 |
| | Fig. 3 Comparison of the coordination geometries around the Ba site, the Ca1 site and the Ca2 site. Colors as in Fig. 2. | |
3.2 Optical properties of Ca6BaP4O17:Ce3+
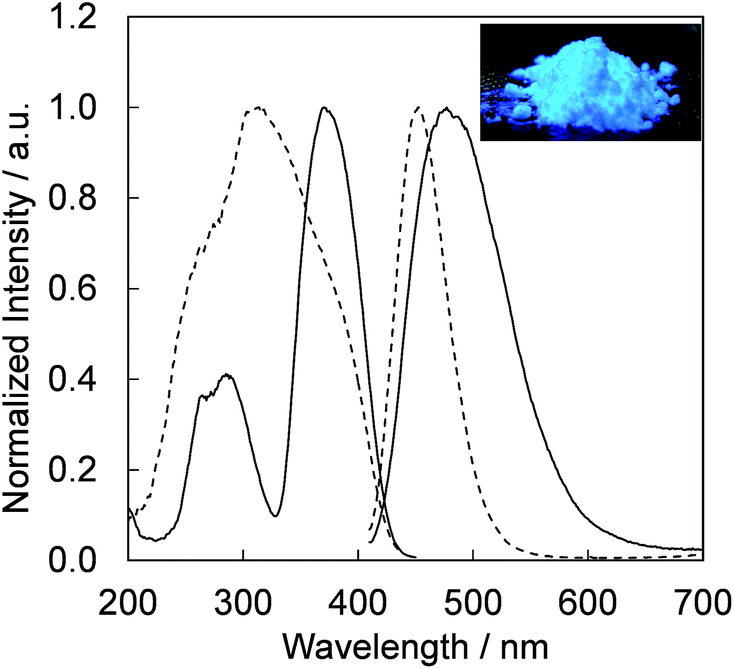
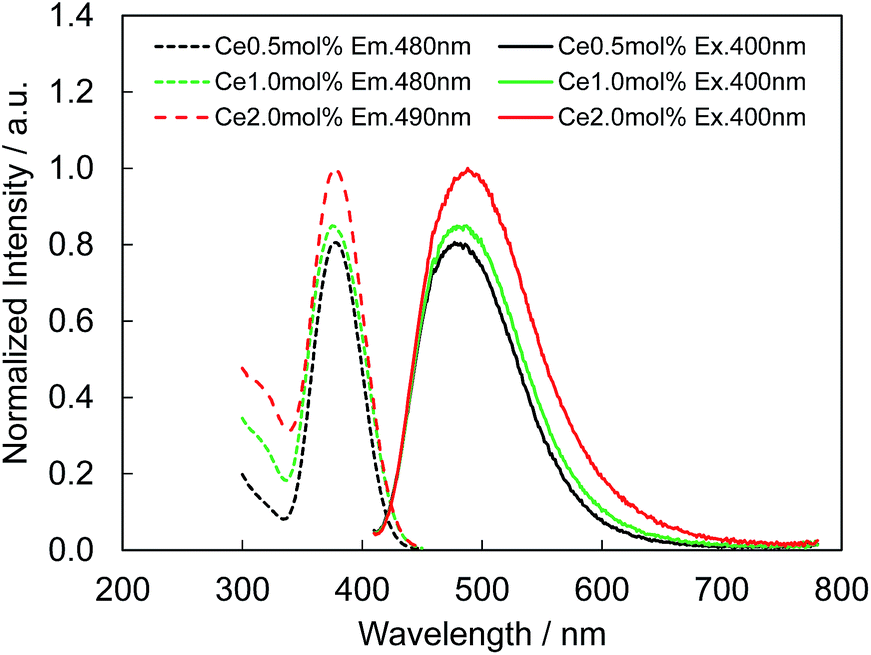
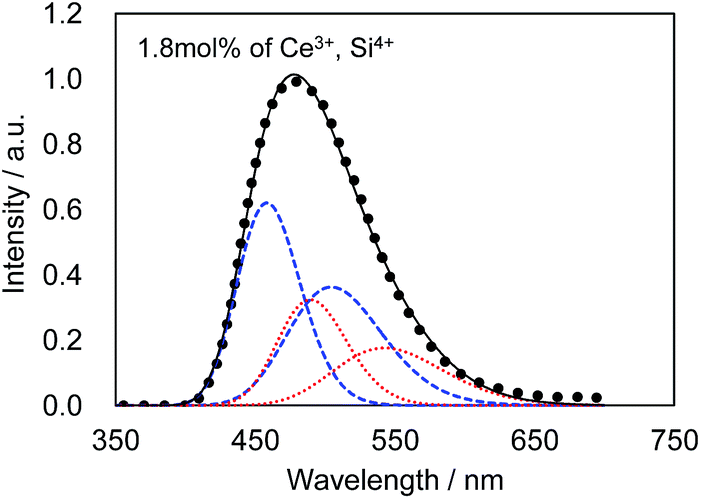
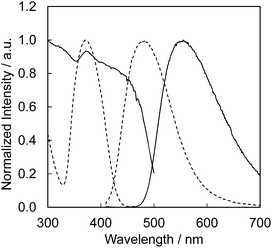
Fig. 4 presents the excitation and emission spectra of CBP:Ce3+ at 1.8 mol% doping with respect to Ca, compared to the commercially available, typical blue phosphor BaAlMg10O17:Eu2+(LP-B4). CBP:Ce3+ has a broad blue-green emission spectrum with the peak position at 477 nm and a full width at half maximum of 98 nm, wider than the 53 nm from the BAM; it can therefore contribute a higher Ra to LED fabrication. Fig. 5 shows the excitation and emission spectra of CBP:Ce3+ at different doping levels with respect to Ca. The doublet emission band is indicative of typical Ce3+ luminescence and can be fitted by two Gaussians separated by 2000 cm−1 as shown in Fig. 6. The emission at 477 nm corresponds to the 5d → 4f transition of the Ce3+ ions. The maximum of the excitation band is at 370 nm giving a Stokes shift of about 5300 cm−1. The color coordinates on the CIE chromaticity diagram are (0.172, 0.267).
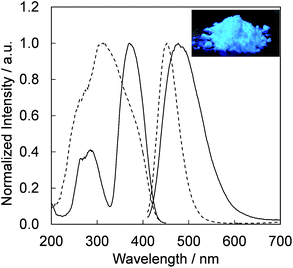 |
| | Fig. 4 Photoluminescence and photoluminescence excitation spectra of CBP activated with 1.8 mol% of Ce3+ (solid line) and BaAlMg10O17:Eu2+ (dashed line) excited at 400 nm. The inset shows a photograph of the CBP:Ce3+ excited by a 400 nm LED. | |
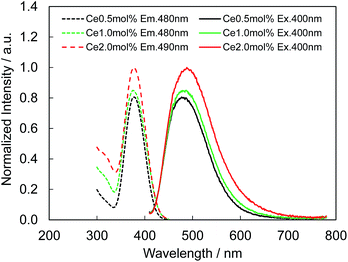 |
| | Fig. 5 Photoluminescence (solid line) and photoluminescence excitation (dashed line) spectra of CBP activated with 0.5 mol%, 1.0 mol% and 2.0 mol% of Ce3+. | |
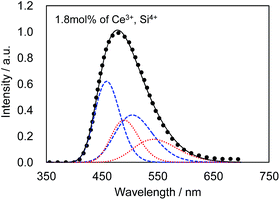 |
| | Fig. 6 Decomposition of the photoluminescence spectrum excited at 400 nm. Observed (dotted line), fitted curve (solid line) and deconvoluted Gaussian components for Ca1 site (blue dashed line) and Ca2 site (red dashed line). | |
We were unable to determine the distribution of Ce3+ in CBP directly from the PXRD, but we believe that it substitutes at the Ca sites. The ionic radius of the twelve-coordinated Ba is 1.61 Å, and the ionic radii of the seven and eight-coordinated Ca are 1.06 and 1.12 Å. Considering the ionic radii of seven, eight and twelve-coordinated Ce3+, which are 1.07, 1.14 and 1.34 Å, respectively, occupation of Ce3+ at the two Ca sites can be expected.13 According to the following empirical eqn (1) by Dorenbos, the absorption energy in eV can be approximately related for Ce3+ and Eu2+ dopants in the same host material, as long as both dopants sit in the same crystallographic site:14
| | | E(Eu2+,CBP) = (0.64 ± 0.02) × E(Ce3+,CBP) + (0.53 ± 0.06) | (1) |
E(Eu2+,CBP) and E(Ce3+,CBP) represent the absorption energies of Eu and Ce in the CBP host. Based on this equation, the expected excitation peak wavelength of CBP:Eu2+ is 467 nm as calculated from the excitation peak (373 nm) for CBP:Ce3+. This agrees very well with our previous work on CBP:Eu2+, which found an excitation maximum at 465 nm. Neglecting the contribution of the difference in Stokes shift between Eu2+ and Ce3+, the emission peak wavelength of CBP:Eu2+ can also be estimated from the emission wavelength (480 nm) of CBP:Ce3+ using eqn (1). At 568 nm, this is close to the measured emission peak of 550 nm. By comparing Ce3+ and Eu2+ in excitation and emission, we conclude that both are in the same sites, surrounded by the similar ligand fields of the two Ca sites.
3.3 Ce3+, Si4+ co-doping in Ca6BaP4O17
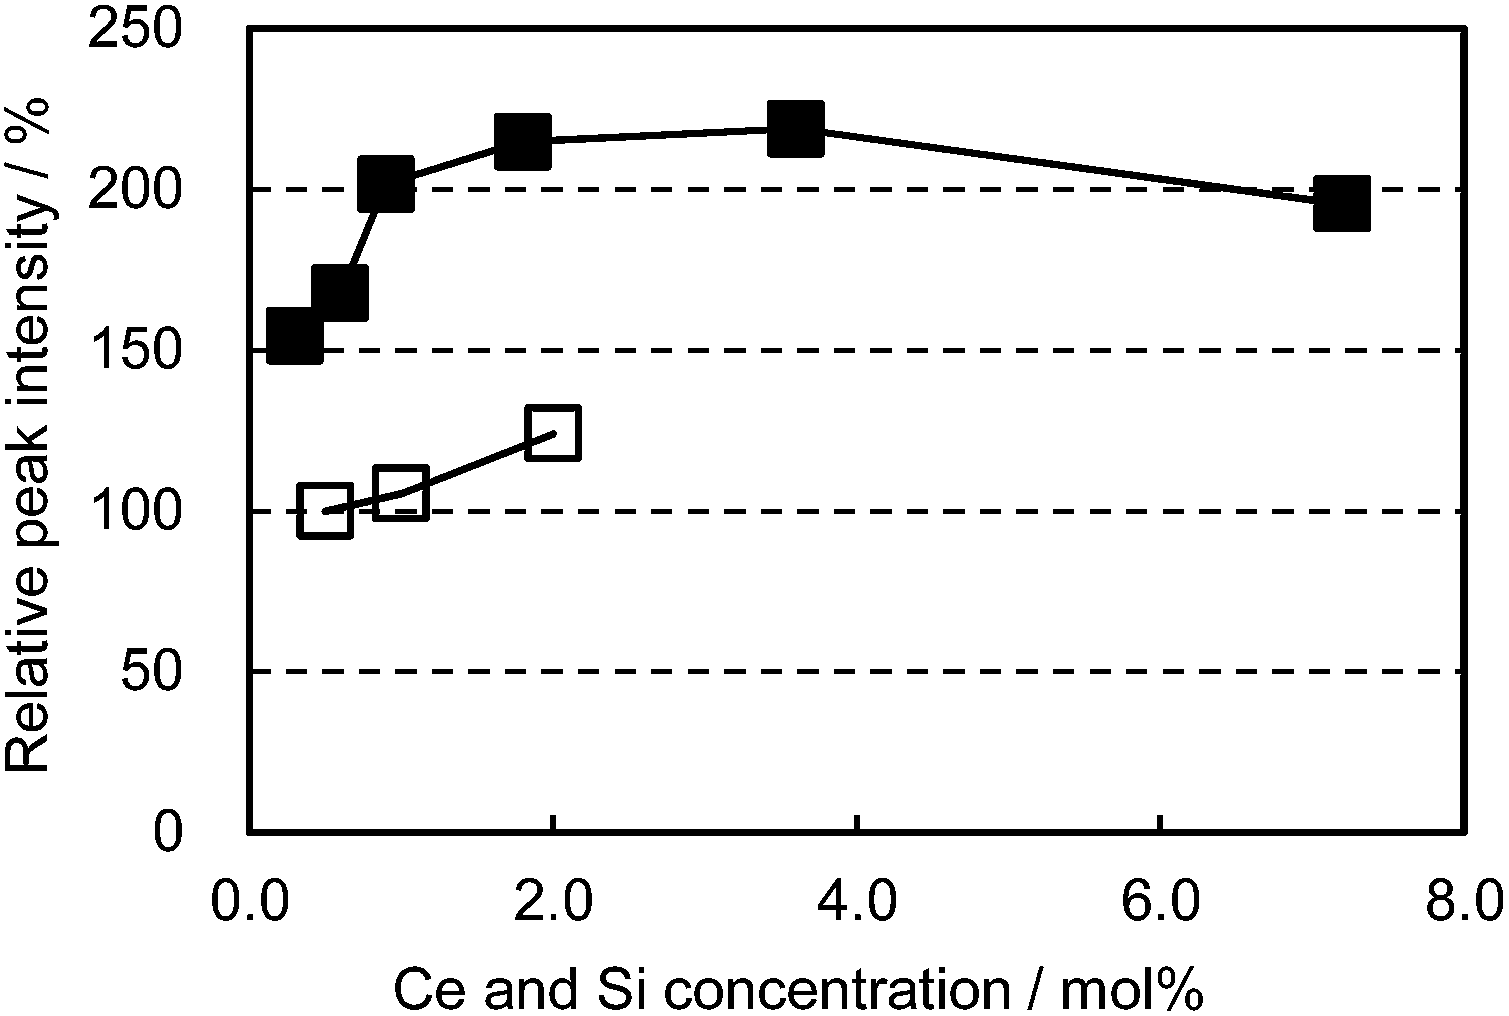
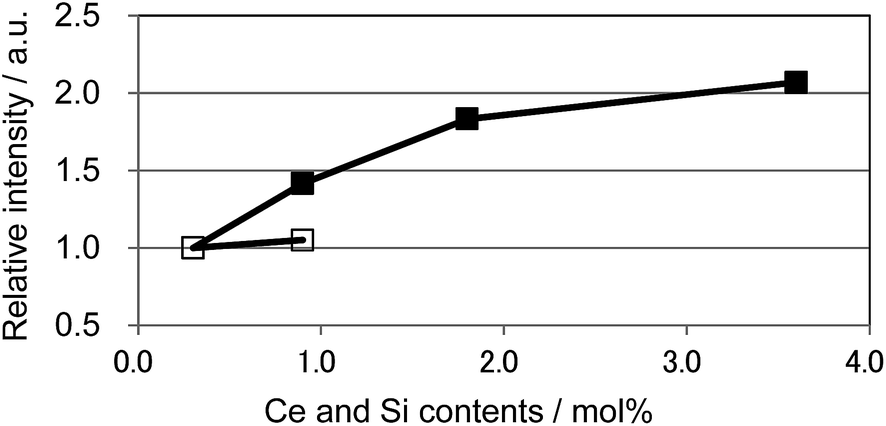
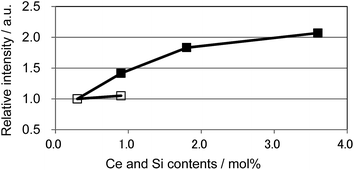
In an attempt to enhance the light conversion efficiency of the CBP:Ce3+ phosphor, Ce3+ and Si4+ co-doping was performed, targetting the Ca and P sites, respectively. This co-doping effectively improved the emission peak intensity by as much as 100% and maintained a high peak intensity over a wide Ce3+ concentration region, as shown in Fig. 7. The co-doping suppressed the grayish sample color that develops with Ce doping alone; this can be attributed to preventing defect generation by forming charge-compensating pairs (Ca2+ substituted by Ce3+ and P5+ by Si4+).
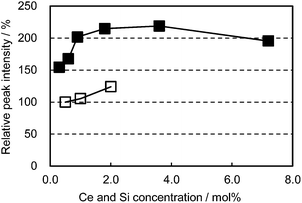 |
| | Fig. 7 Relative peak intensity as a function of Ce concentration excited at 400 nm. □: (Ca1−xCex)6BaP4O17, ■: (Ca1−xCex)6Ba(P1−6x/4Si6x/4)4O17. | |
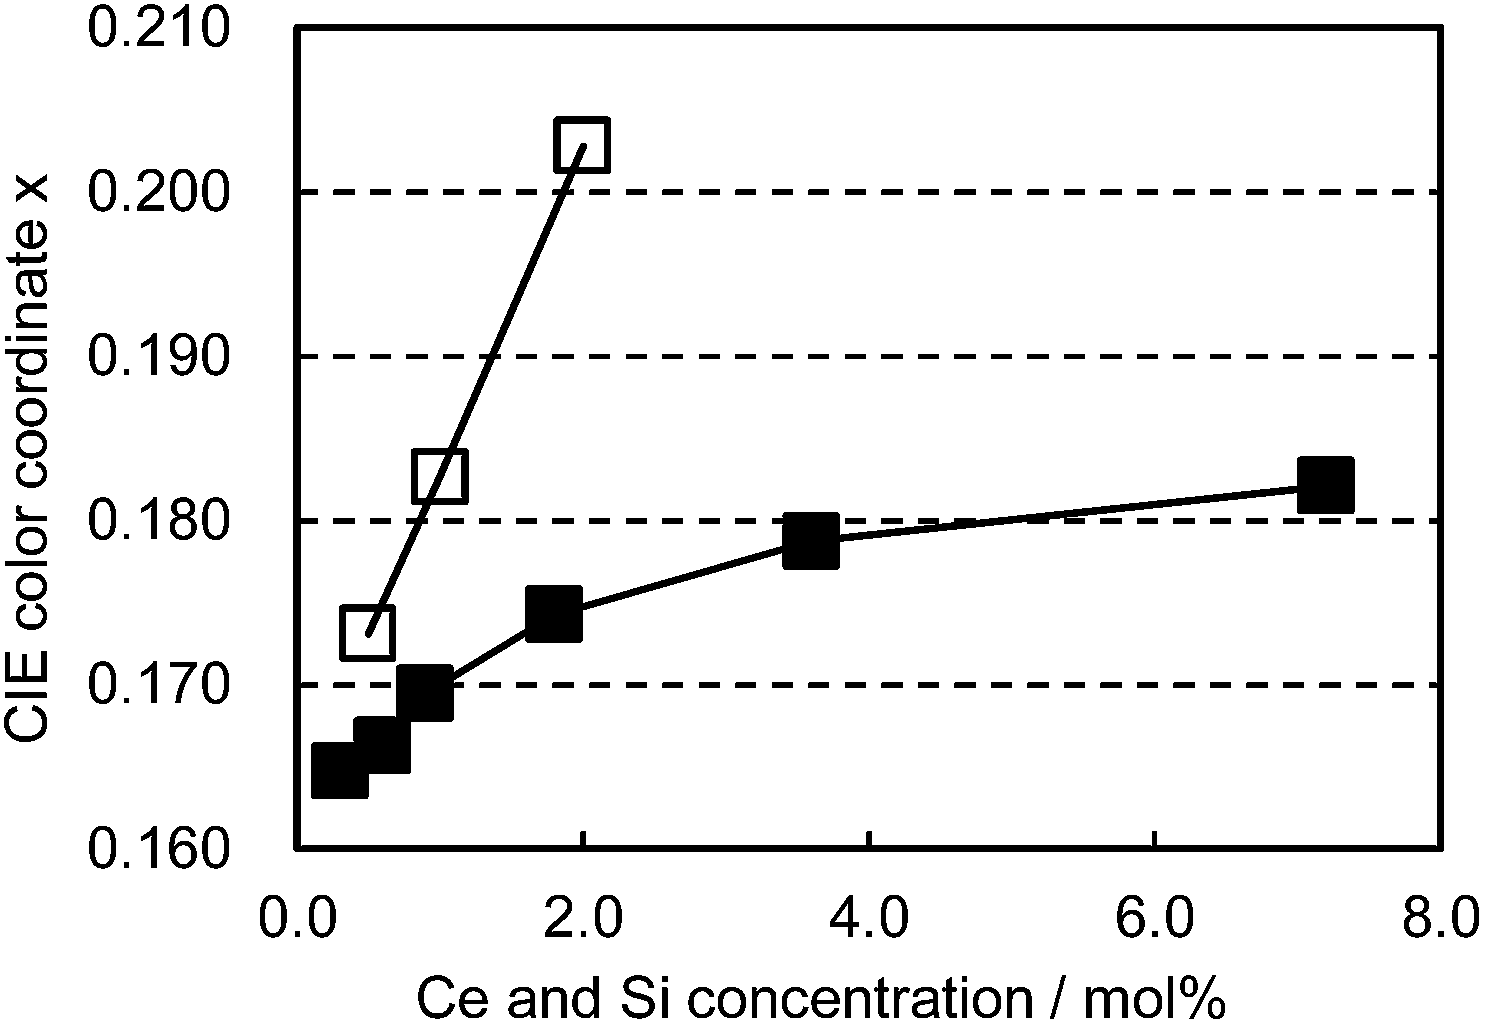
The co-doped samples also exhibit unique characteristics in the color shift as a function of Ce3+/Si4+ doping concentration. As presented in Fig. 8, Ce3+ single doping shifts the emission color linearly with the doping level. In contrast to this, Ce3+/Si4+ co-doping showed a much smaller change in emission color with an increase of concentration. The linear shift of the emission color with increasing Ce3+ concentration is generally explained by the enhancement of reabsorption due to the overlap between absorption and emission.15
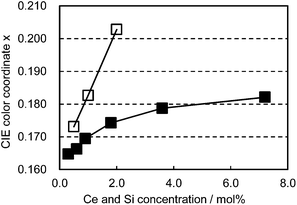 |
| | Fig. 8 Color shift as a function of Ce concentration excited at 400 nm. □: (Ca1−xCex)6BaP4O17, ■: (Ca1−xCex)6Ba(P1−6x/4Si6x/4)4O17. | |
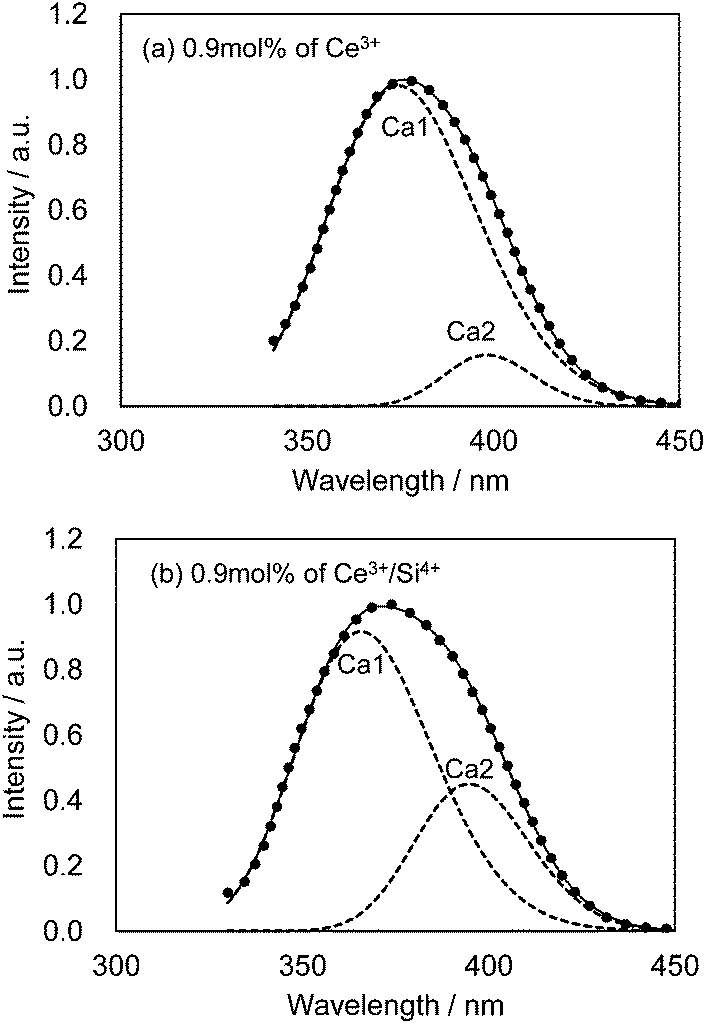
We also observed apparent differences in the shape of the excitation spectra between Ce3+ single doping and Ce3+/Si4+ co-doping. To probe the reason for the small emission color shift in the Ce3+/Si4+ samples, the lowest energy excitation band was decomposed into two Gaussian components for the Ca1 and Ca2 sites. Fig. 9 shows the results for the lowest energy excitation bands of CBP activated with 0.9 mol% of Ce3+ and with 0.9 mol% of Ce3+/Si4+, respectively. These decompositions for samples with various doping levels indicated clear differences in the site preference of Ce3+ between single doping and co-doping. For both Ca1 and Ca2 sites (assuming that Ca2 excites at a longer wavelength, see below), peak positions shift to the longer wavelength side with single doping. By contrast, the peak positions shift to shorter wavelengths in co-doped samples (Fig. 10). A slight red shift can be expected due to the reabsorption with increasing Ce3+ concentration, as explained above. However, a large blue shift in the co-doping samples overwhelms the red shift and can be attributed to the weakening crystal field on both the Ca1 and Ca2 sites as the lattice expands (see below). Fig. 11 shows the relative peak intensities of the lowest energy excitation band for Ce3+ on the Ca2 site against its intensity at 0.3 mol% doping and indicates a preference of Ce3+ for the Ca2 site. Single doping does not increase the relative peak intensity, which implies that only co-doping stimulates the relative preference of substitution by Ce3+ for the Ca2 site, which is relatively compressed by comparison with Ca1.
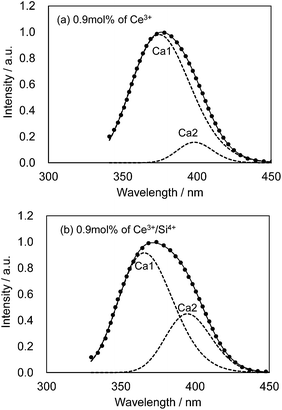 |
| | Fig. 9 Decomposition of the lowest energy excitation band monitored at 480 nm. Observed (dotted line), fitted curve (solid line) and deconvoluted Gaussian components for Ca1 and Ca2 sites (dashed lines). (a) CBP activated with 0.9 mol% of Ce3+; (b) CBP activated with 0.9 mol% of Ce3+/Si4+. | |
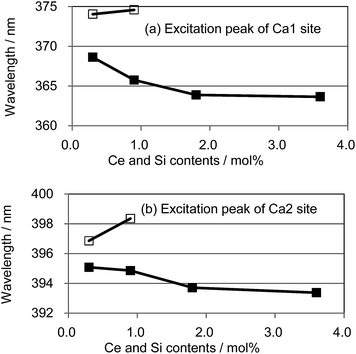 |
| | Fig. 10 Peak positions of the deconvoluted excitation bands for (a) Ca1 and (b) Ca2; □: (Ca1−xCex)6BaP4O17, ■: (Ca1−xCex)6Ba(P1−6x/4Si6x/4)4O17. | |
 |
| | Fig. 11 Relative peak intensity of the deconvoluted excitation band monitored at 480 nm for Ca2 site normalized at 0.3 mol% doping level. □: (Ca1−xCex)6BaP4O17, ■: (Ca1−xCex)6Ba(P1−6x/4Si6x/4)4O17. | |
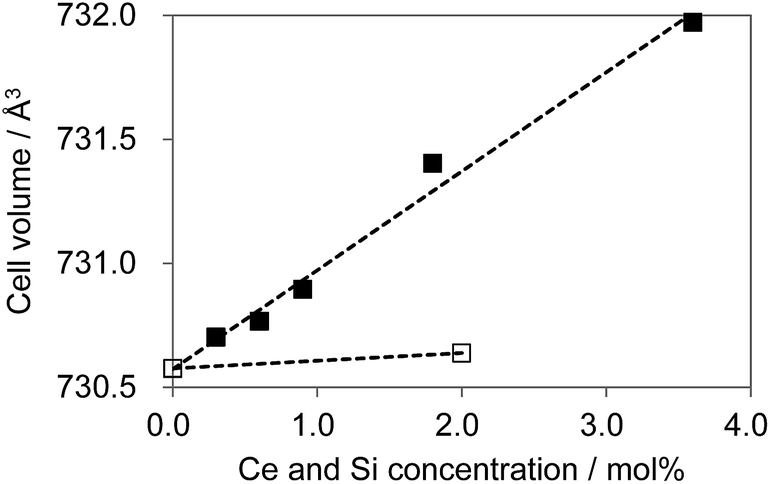
As shown in Fig. 12, substitution of Si into P sites generates no second phases. Fig. 13 shows the unit cell volume of the CBP samples as a function of Ce3+ or Ce3+/Si4+ doping concentration. Co-doping expands the unit cell volume with increasing Ce3+/Si4+ concentration due to substitution of Si on the P site (the ionic radii of the four-coordinated Si and P are 0.26 Å and 0.17 Å, respectively). Effective charge compensation has been previously reported for Ce3+ doping into the Ca site in (Ca,Ce)3Sc2Si3O12, replacing Sc3+ by Mg2+ and Ca2+ by Na+ or Li+.16 Similarly, Al3+ substitution has been reported to maintain γ-phase formation and control the distribution of Ce3+ in Ca2SiO4:Ce3+.17 To the best of our knowledge, the present work is the first report of effective charge compensation for Ce-doped alkaline-earth phosphate phosphors by co-doping with Si, though Si substitution in phosphates is well known in AlPO4-based molecular sieves.18
 |
| | Fig. 12 Experimental PXRD patterns of (Ca1−xCex)6BaP4O17 and (Ca1−xCex)6Ba(P1−6x/4Si6x/4)4O17 in the range of 2θ = 10–75°. | |
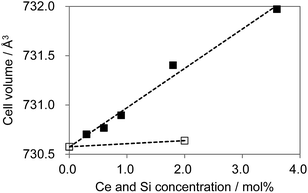 |
| | Fig. 13 Cell volume expansion as a function of Ce3+ concentration. □: (Ca1−xCex)6BaP4O17, ■: (Ca1−xCex)6Ba(P1−6x/4Si6x/4)4O17. | |
The marked increase in unit cell volume probably accounts for the blue-shift in the emission as the level of Ce3+/Si4+ co-doping increases. The absence of such an increase with single Ce3+ doping is expected since there is no obvious reason in this case for the lattice to expand. Furthermore, charge compensation must be achieved by a more complex mechanism, which probably limits the solubility. However, the underlying reason for the relative preference for Ce3+ substitution at the Ca2 site in the case of co-doping is less clear. The most likely explanation is that single doping leads to a preference for Ce3+ substitution at the Ca1 site, where charge compensation could be partly met by the higher oxygen coordination number. This is less necessary in the co-doped sample, leading to a more even distribution of Ce3+ over the two sites.
The combination of a uniform Ce distribution, in order to minimize concentration quenching, and insertion of the Ce3+ into the more compressed Ca2 site is important in order to match the excitation range with near-UV LEDs. Ce3+/Si4+ co-doping enables this, and improves the luminescence intensity of CBP:Ce3+,Si4+. Based on the 90% internal quantum efficiency of BAM at 300 nm,19 the internal quantum efficiency of CBP:Ce3+,Si4+ is 70% at 400 nm excitation, which is higher than the value of 60% reported for Ba9Y2Si6O24:Ce3+ by Seshadri et al.6 Comparing the value with the 74% achieved for P46-Y3 at 455 nm excitation measured in the same configuration, CBP:Ce3+,Si4+ is a very promising phosphor for LED use. It shows better performance than any of the other Ce3+ doped phosphates that we have studied, an observation that we ascribe to the presence of isolated oxide ions in the coordination sphere of the calcium ions.
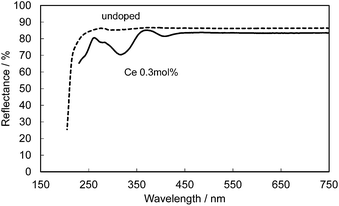
Fig. 14 shows the reflectance spectra for undoped and Ce-doped CBP. The reflectance of undoped CBP remains at about 90% in the spectral range of 250–750 nm, with a sudden drop below 250 nm corresponding to the absorption at the bandgap in CBP. The Ce3+ doping introduces a strong, broad absorption in the range 200–450 nm associated with its 4f1 → 5d1 transition. The slightly lower reflectance of only 83.5% in the range above 450 nm may be linked to compensation of the charge balance in the CBP:Ce3+ by defects such as Ca vacancies. For reference, 0.3 mol% Ce3+/Si4+ doped CBP maintains 85% reflectance in this range.
 |
| | Fig. 14 Reflectance spectra of an undoped CBP sample (dashed line) and a sample doped with 0.3 mol% of Ce (solid line). | |
3.4 Temperature dependence of the photoluminescence
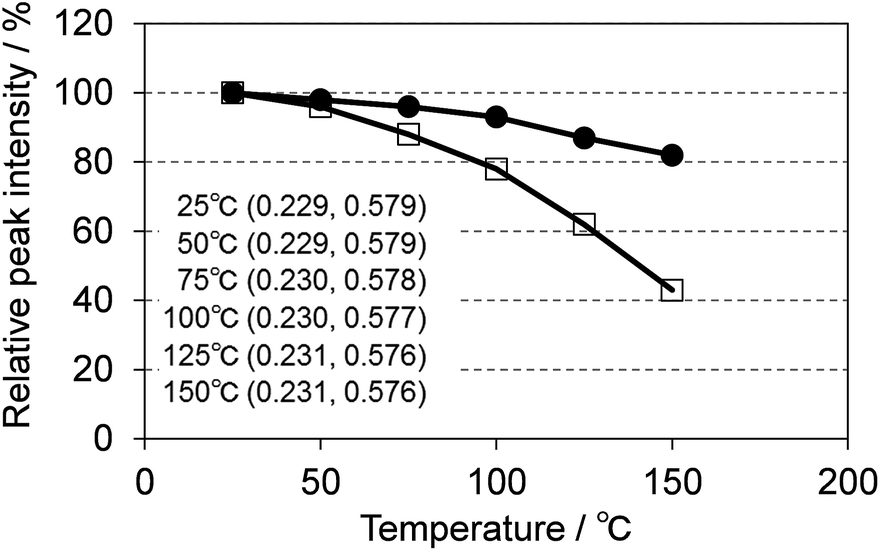
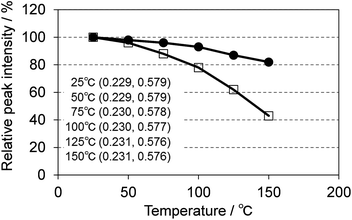
One of the key requirements for a good phosphor for SSL is the need to maintain performance at the operating temperature of the device. Fig. 15 shows the temperature dependence of the photoluminescence of (Ca0.982Ce0.018)6Ba(P0.973Si0.027)4O17 excited at 400 nm, compared with P46-Y3 excited at 455 nm. CBP:Ce3+ showed much smaller thermal quenching than P46-Y3, maintaining 80% of light output at 150 °C whereas P46-Y3 retains only 40%. CBP exhibits quite small color shift in the temperature range of 25 to 150 °C, which is suitable for LED use.
 |
| | Fig. 15 Temperature dependence of the photoluminescence of (Ca0.982Ce0.018)6Ba(P0.973Si0.027)4O17 excited at 400 nm (filled circles) and P46-Y3 excited at 455 nm (open squares). The inset shows color coordinates at each temperature. | |
3.5 Luminescence from a white LED
The CBP:Ce3+,Si4+ phosphor is highly suitable as a blue-green phosphor for SSL based upon near-UV LEDs operating at 400 nm. Equally, CBP:Eu2+ is an exceptional yellow phosphor for the same LED wavelength since its excitation spectrum spans from ∼250 to over 450 nm.7 The photoluminescence and photoluminescence excitation spectra of two samples of CBP:Ce3+,Si4+ and CBP:Eu2+ underline this point (Fig. 16). We therefore fabricated a white LED consisting of the CBP:Ce3+,Si4+ (blue-green), CBP:Eu2+(yellow), CaAlSiN3:Eu2+ (red),20 and a near-UV LED with emission at 400 nm (Fig. 17). Its correlated color temperature (CCT) was 4448 K and the CIE color coordinates were (0.370, 0.403). The luminous efficacy and external quantum efficiency of the LED at a high forward current of 350 mA were 45 lm W−1 and 20.8%, respectively. It achieved a relatively flat, broad spectrum from blue to red with good color quality at an average color rendering index (Ra) of 93. The observed CIE chromaticity coordinates of white LED were distinctly stable within x = 0.370–0.380 and y = 0.403–0.408 at the operation current from 20 mA to 350 mA. Amazingly, the Ra was unchanged in this range.
 |
| | Fig. 16 Photoluminescence and photoluminescence excitation spectra of CBP activated with Eu2+ (solid line) and Ce3+ (dashed line). Excited at 400 nm for both, monitored at 550 nm for CBP:Eu2+ and at 480 nm for CBP:Ce3+. | |
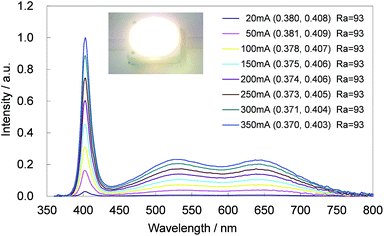 |
| | Fig. 17 Luminescence spectrum of a white LED consisting of the CBP:Ce3+,Si4+, CBP:Eu2+, CaAlSiN3:Eu2+ phosphor and a near-UV LED. The inset shows a photograph of the white LED in operation, color coordinates and Ra at each operation current. | |
4 Conclusions
A new blue-green phosphor, Ca6BaP4O17:Ce3+, has been reported. Co-substitution of P with Si was used as an effective mechanism to enhance the luminescence; Ca6BaP4O17:Ce3+,Si4+ shows strong blue-green emission with a peak position at 480 nm and a high internal efficiency of 70%. Thermal quenching of the luminescence is much smaller than in P46-Y3. A white LED using CBP:Ce3+,Si4+, CBP:Eu2+, CaAlSiN3:Eu2+ and a near-UV LED showed excellent performance.
Acknowledgements
The authors thank Dr Hiroyuki Imura for a discussion on crystallographic analysis. We also thank Mr Masashi Aoyagi for his assistance in white LED evaluation. The authors are also grateful to Dr Ali Kalaji for his assistance with the experimental work at the University of Cambridge.
Notes and references
-
S. Nakamura, S. Pearton and G. Fasol, The Blue Laser Diode: the Complete Story, Springer-Verlag, Berlin, 2000, pp. 230–235 Search PubMed.
- J. McKittrick, M. E. Hannah, A. Piquette, J. K. Han, J. I. Choi, M. Anc, M. Galvez, H. Lugauer, J. B. Talbot and K. C. Mishra, ECS J. Solid State Sci. Technol., 2013, 2, R3119 CrossRef CAS PubMed.
- G. Gundiah, J. L. Wu and A. K. Cheetham, Chem. Phys. Lett., 2007, 441, 250 CrossRef PubMed.
- A. A. Setlur and U. Happek, J. Solid State Chem., 2010, 183, 1127 CrossRef CAS PubMed.
- K. A. Denault, N. C. George, S. R. Paden, S. Brinkley, A. A. Mikhailovsky, J. Neuefeind, S. P. DenBaars and R. Seshadri, J. Mater. Chem., 2012, 22, 18204 RSC.
- J. Brgoch, C. K. H. Borg, K. A. Denault, A. A. Mikhailovsky, S. P. DenBaars and R. Seshadri, Inorg. Chem., 2013, 52, 8010 CrossRef CAS PubMed.
- N. Komuro, M. Mikami, Y. Shimomura, E. G. Bithell and A. K. Cheetham, J. Mater. Chem. C, 2014, 2, 6084 RSC.
- K. Y. Jung and J. H. Kim, J. Lumin., 2008, 128, 2004 CrossRef CAS PubMed.
- X. Zhang, H. He, Z. Li, T. Yu and Z. Zou, J. Lumin., 2008, 128, 1876 CrossRef CAS PubMed.
- M. Shang, G. Li, D. Geng, D. Yang, X. Kang, Y. Zhang, H. Lian and J. Lin, J. Phys. Chem. C, 2012, 116, 10222 CAS.
- T. J. B. Holland and S. A. T. Redfern, Mineral. Mag., 1997, 61, 65 CAS.
- K. Momma and F. Izumi, J. Appl. Crystallogr., 2011, 44, 1272 CrossRef CAS.
- R. D. Shannon, Acta Crystallogr., Sect. A: Cryst. Phys., Diffr., Theor. Gen. Crystallogr., 1976, 32, 751 CrossRef.
- P. Dorenbos, J. Phys.: Condens. Matter, 2003, 15, 4797 CrossRef CAS.
- K. Sakuma, N. Hirosaki and R.-J. Xie, J. Lumin., 2007, 126, 843 CrossRef CAS PubMed.
- Y. Shimomura, T. Kurushima, M. Shigeiwa and N. Kijima, J. Electrochem. Soc., 2008, 155, J45 CrossRef CAS PubMed.
- A. Kalaji, M. Mikami and A. K. Cheetham, Chem. Mater., 2014, 26, 3966 CrossRef CAS.
- B. M. Lok, C. A. Messina, R. L. Patton, R. T. Gajel, T. R. Cannan and E. M. Flanigen, J. Am. Chem. Soc., 1984, 106, 6092 CrossRef CAS.
- A. A. Bol and A. Meijerink, J. Phys. Chem. B, 2001, 105, 10197 CrossRef CAS.
- K. Uheda, N. Hirosaki, Y. Yamamoto, A. Naito, T. Nakajima and H. Yamamoto, Electrochem. Solid-State Lett., 2006, 9, H22 CrossRef CAS PubMed.
Footnote |
| † MCHC R&D Synergy Center, Inc., 1000 Kamoshida, Aoba, Yokohama, Kanagawa 227-8502, Japan. |
|
| This journal is © The Royal Society of Chemistry 2015 |
Click here to see how this site uses Cookies. View our privacy policy here.