 Open Access Article
Creative Commons Attribution 3.0 Unported Licence
A three layer design with mesoporous silica encapsulated by a carbon core and shell for high energy lithium ion battery anodes†
Xi
Cao
ab,
Xiuyun
Chuan
*a,
Robert C.
Massé
b,
Dubin
Huang
a,
Shuang
Li
b and
Guozhong
Cao
*b
aSchool of Earth and Space Science, Peking University, Beijing 100871, PR China. E-mail: xychuan@pku.edu.cn; Fax: +86-10-62751159; Tel: +86-10-62767965
bDepartment of Materials Science and Engineering, University of Washington, Seattle, Washington 98195, USA. E-mail: gzcao@u.washington.edu; Fax: +1-206-543-3100; Tel: +1-206-616-9084
First published on 28th September 2015
Abstract
A novel C/SiO2 composite with a carbon–silica–carbon (C-mcms) three layer structure was synthesized and evaluated as an anode material for high-energy lithium ion batteries. The C-mcms exhibits an excellent capacity of about 1055 mA h g−1 at a current density of 500 mA g−1 after 150 cycles without detectable decay, and high-rate capability, which is superior to other similar composites without the carbon core or the carbon shell. The results indicate the structural effect on the enhancement of the electrochemical properties: the SiO2 nanoparticles are completely confined between the carbon shell and the carbon core; the two carbon parts work together to keep the structural integrity and to keep the electrode highly conductive and active during cycling, which guarantees high capacity and cycle stability; the interior pores and voids among the SiO2 nanoparticles can provide free space to accommodate the volume change and buffer the volume effect of the electrode during lithiation/delithiation.
1. Introduction
As one of the most important candidates for the power source of portable electric devices, electric vehicles (EVs) and hybrid electric vehicles (HEVs), lithium ion batteries (LIBs) are attracting great interest due to their high energy density, long cycle life, and environmental friendliness. There is an increasing demand for rechargeable lithium-ion batteries with higher energy density and longer cycle life for applications to meet the rapid development in large-scale energy applications.1–5 Carbonaceous materials are commercially used as anode materials due to their advantages of long cycle life, safety and low cost. However, their low lithium-storage capacity (LiC6: 372 mA h g−1) cannot satisfy the continuously increasing requirement nowadays. Various efforts have been made to developing new and better electrode materials with higher specific capacity and tailoring materials to new nanostructures in order to enhance their electrochemical performance.4,6–10 Silicon based materials have attracted great interest due to the significantly higher theoretical specific capacity of about 4200 mA h g−1 for the Li22Si5 alloy, low-cost and higher safety. However, the severe volume change (>300%) occurring during the lithium insertion/extraction process leads to active particle cracking, electrode pulverization, and subsequent loss of electrical contact between the active material and current collector, resulting in severe capacity degradation. Several strategies have been proposed to deal with this problem, including the preparation of nanostructured Si11–15 and composite materials.16–21 By dispersing nano-Si particles in a carbon matrix, the electrochemical performance could be improved significantly. However, complex strategies are often required to prepare refined nanostructures, and the high cost of nano-silicon keeps the anode composite far from the industrial application level.As a replacement, although having a specific capacity lower than that of Si (with the largest reversible capacity of 1961 mA h g−1; the theoretical capacity of SiO2 can be calculated according to different types of reactions that exist between silica and lithium ions proposed in a previous study, the detailed mechanism and calculation are listed in the ESI†22–25), SiO2 has also received a lot of interest due to its extremely low cost and less volume change during cycling. Even though lithium oxides and lithium silicates generated in the first discharge process act as buffer layers to accommodate the volume change of the amorphous Si particles to some extent,24–28 the volume effect, along with low initial coulombic efficiency and poor electrical conductivity still remains the main obstacles to enhancing the electrochemical performance. A lot of efforts have been made to address these problems, such as synthesizing silica materials with a carbon coating and different nanostructures. For example, Chang et al.23 reported that a 24 h high energy mechanically milled SiO2 would generate 5 nm Si crystallites dispersed randomly within the amorphous silicon and exhibit a reversible capacity of ∼800 mA h g−1 at a current of 100 mA g−1 over 100 cycles. The amorphous SiO2/C composite prepared by mechanical milling and post heat-treatment exhibited a high reversible capacity of 600 mA h g−1.29 Hollow porous SiO2 nanocubes, hollow silica nanospheres and SiO2 nanotubes were also synthesized by a sacrificial template method and studied as anode materials.22,28,30 However, these methods may be time consuming, and cause environmental pollution and other issues. Thus, preparing SiO2 based composites with a controllable nanostructure and high capacity by a facile method is required for actual application.
In this work, a new type of C/SiO2 composite with a carbon–silica–carbon three layer structure was prepared by a facile method, with mesoporous silica encapsulated by the carbon core and shell. When studied as an anode material for lithium ion batteries, this composite exhibited an excellent electrochemical performance with a high specific capacitance, good cycling performance and excellent rate capability. The significant impacts of the carbon core and carbon shell in enhancing the performance were systematically investigated.
2. Experimental
2.1. Synthesis
The fabrication of the C/SiO2 composite with a carbon–silica–carbon three layer structure is illustrated in Fig. 1. Firstly, monodispersed mesoporous polymer nanospheres were prepared by a low-concentration hydrothermal method according to the literature.31 Secondly, 0.2 g of synthesized mesoporous polymer nanospheres was added into a solution containing 100 ml of H2O, 60 ml of ethanol and 300 mg of cetyltrimethylammonium bromide (CTAB) and dispersed in an ultrasonication bath for 30 min. Then, 1.65 ml of ammonia (28 wt%) was added into the mixture with mechanical stirring for another 30 min. 0.5 ml of tetraethyl orthosilicate (TEOS) was added into the above solution every 30 minutes and totally 3 times, and then the mixture was stirred for 12 h. The assembled cationic surfactant micelle template (CTAB) serves as a structure-directing agent for polymerizing the silica component by electrostatic interactions. After the product was collected by centrifugation and washed with H2O and ethanol three times, respectively, the CTAB should be removed, and then, after calcination under an Ar flow at 500 °C for 3 h at a heating rate of 3 °C min−1, a uniform core/shell mesoporous carbon–mesoporous silica (denoted as mcms) was obtained. Finally, 0.2 g of the obtained mcms was dispersed in a solution containing 10 ml of H2O, 10 ml of ethanol and 0.5 g of sucrose, and then transferred into a 30 ml polytetrafluoroethylene (PTFE)-lined stainless steel autoclave and kept at 180 °C for 4 h. The precipitate was collected and washed several times by centrifugation with deionized water after the autoclave was cooled down, and then dried at 80 °C overnight. The composites were annealed at 800 °C for 3 h under Ar flow to form the carbon–silica–carbon three layer structured composites (C-mcms).In comparison, carbon core–mesoporous silica shell nanospheres without carbon coating on the surface (denoted as mcms) and the carbon coated hollow silica nanospheres (without the carbon core, denoted as C-ms) were also studied, as shown in Fig. 2.
2.2. Structural analyses
The crystal structure of the obtained sample was characterized by means of X-ray diffraction (XRD, D8 Bruker X-ray diffractometer with Cu-Kα radiation (λ = 1.5418 Å) within the range of 10–80° (2θ)). The morphology was examined using scanning electron microscopy (SEM, JEOL JSM-7000F). Transmission electron microscopy (TEM) measurements were conducted on a Tecnai F20 microscope (FEI) operating at 200 kV accelerating voltage. The samples were suspended in ethanol and transferred onto a Cu grid for TEM measurements. The content of SiO2 was determined from the mass loss of the samples at 800 °C in air with a Q50 thermogravimetric (TGA) apparatus (TA, USA).Nitrogen adsorption–desorption isotherms were measured using a Quantachrome NOVA 4200e system. The samples were degassed at 200 °C for 10 h under vacuum prior to measurements. The specific surface area and pore size distribution were determined by multipoint Brunauer–Emmett–Teller (BET), density functional theory (DFT) desorption analyses, respectively.
X-ray photoelectron spectroscopy (XPS) analysis was performed using a Surface Science Instruments S-probe spectrometer with a monochromatized Al Kα X-ray and a low-energy electron flood gun for charge neutralization. The accelerating voltage and current were 40 kV and 40 mA, respectively. Three spots were tested on each sample to make the final results credible.
2.3. Electrochemical measurements
The electrochemical performance was tested in sandwich-type two-electrode coin cells. In order to prepare the working electrode, the as-prepared active materials were mixed and ground with Super P conductive carbon (TIMCAL graphite & carbon), and the poly(vinylidene difluoride) (PVDF, Sigma-Aldrich) binder dispersed in an N-methyl-2-pyrrolidone (NMP, Alfa Aesar) solution at a weight ratio of 80![[thin space (1/6-em)]](https://www.rsc.org/images/entities/char_2009.gif) :
:![[thin space (1/6-em)]](https://www.rsc.org/images/entities/char_2009.gif) 10
10![[thin space (1/6-em)]](https://www.rsc.org/images/entities/char_2009.gif) :
:![[thin space (1/6-em)]](https://www.rsc.org/images/entities/char_2009.gif) 10, respectively. The as-prepared slurry was uniformly spread and pressed onto Cu foil and dried in a vacuum oven at 80 °C overnight as the working electrode. CR2016-type coin cells were assembled in an argon-filled glovebox (Innovative Technology, IL-2GB) with the working electrodes, pure lithium foil as the counter electrodes, and a polypropylene film as the separator. 1 M LiPF6 in a mixture of ethylene carbon (EC)/dimethyl carbonate (DMC) (volume ratio of 1
10, respectively. The as-prepared slurry was uniformly spread and pressed onto Cu foil and dried in a vacuum oven at 80 °C overnight as the working electrode. CR2016-type coin cells were assembled in an argon-filled glovebox (Innovative Technology, IL-2GB) with the working electrodes, pure lithium foil as the counter electrodes, and a polypropylene film as the separator. 1 M LiPF6 in a mixture of ethylene carbon (EC)/dimethyl carbonate (DMC) (volume ratio of 1![[thin space (1/6-em)]](https://www.rsc.org/images/entities/char_2009.gif) :
:![[thin space (1/6-em)]](https://www.rsc.org/images/entities/char_2009.gif) 1, with 2% vinylene carbonate (VC) as the additive) was used as the electrolyte. All electrochemical measurements were performed with the assembled two-electrode battery at ambient temperature.
1, with 2% vinylene carbonate (VC) as the additive) was used as the electrolyte. All electrochemical measurements were performed with the assembled two-electrode battery at ambient temperature.
Galvanostatic discharge and charge measurements were performed with a LAND CT2001A tester (Wuhan, China) at different current densities in the voltage range of 0.01–3.5 V versus Li+/Li. Cyclic voltammetry (CV) was conducted on an electrochemical analyzer (CH Instruments, model 605C) in the voltage range of 0.01–3.0 V (vs. Li/Li+) at a scan rate of 0.1 mV s−1. Alternating current (AC) impedance was recorded on the electrochemical analyzer (CH Instruments, model 605C) with an amplitude of 5.0 mV in the frequency range from 100 kHz to 0.01 Hz. The half-cells were tested at various current rates based on the weight of the active material alone.
3. Results and discussion
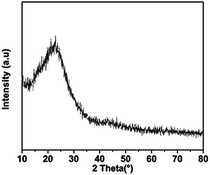
The XRD pattern of C-mcms shown in Fig. 3 demonstrates no distinct diffraction peaks, suggesting the amorphous feature of the SiO2. A broad and weak diffraction peak located in the 2θ range of 21–23° should be associated with amorphous SiO2. Fig. 4 shows the high-resolution XPS spectra of C1s and Si2p for samples mcms and C-mcms. The binding energy scales of the spectra were calibrated by assigning the most intense C1s peak a binding energy of 285.2 eV. As shown in Fig. 4a, compared with mcms, the intensity of the O–C![[double bond, length as m-dash]](https://www.rsc.org/images/entities/char_e001.gif) O (289.2 eV) peak decreases, and another peak at 289.7 eV related to the asymmetric shape of non-graphic carbon32 appears when coated with carbon outside the SiO2. However, it is clearly indicated that there is only one peak at 104.4 eV ascribed to Si4+ in the case of carbon coated mcms, as shown in Fig. 3b, suggesting the single amorphous phase of SiO2,33,34 which demonstrates that SiO2 was not reduced to other forms of Si–O composites.
O (289.2 eV) peak decreases, and another peak at 289.7 eV related to the asymmetric shape of non-graphic carbon32 appears when coated with carbon outside the SiO2. However, it is clearly indicated that there is only one peak at 104.4 eV ascribed to Si4+ in the case of carbon coated mcms, as shown in Fig. 3b, suggesting the single amorphous phase of SiO2,33,34 which demonstrates that SiO2 was not reduced to other forms of Si–O composites.
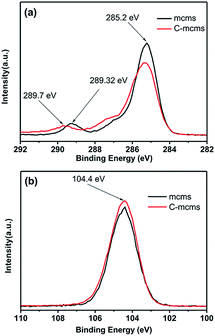 | ||
| Fig. 4 High-resolution XPS spectra of C1s (a) (inset: enlarged part of the C1s spectra) and Si2p (b) for C-mcms and mcms composites. | ||
TGA was used to determine the SiO2 content in the C-mcms, C-ms and mcms composites, as shown in Fig. 5, and the SiO2 content reached 73.5%, 83.4% and 87%, respectively.
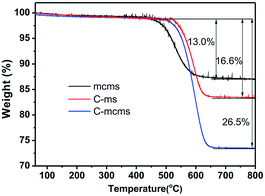 | ||
| Fig. 5 The TGA curves of the C-mcms, C-ms and mcms composites from 25 °C to 800 °C at a heating rate of 10 °C min−1 in flow air. | ||
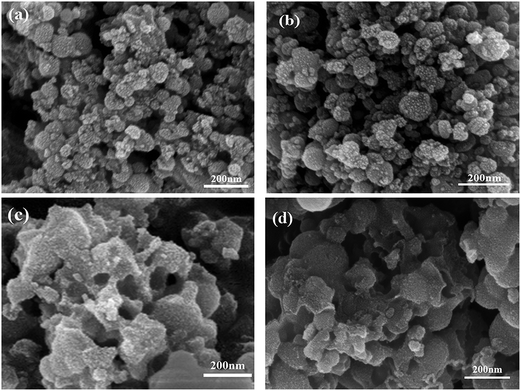
Fig. 6 presents the general view of the morphologies of mcms, C-mcms, ms, and C-ms. Among them, mcms exhibits a relatively uniform shape without agglomeration (Fig. 6a), and this structure remains after carbon coating on the surface (C-mcms, Fig. 6b). Comparatively, when mcms was converted to ms after calcination in air for 3 h, some of the mesoporous silica (ms) spheres collapsed and broke into fragments due to the gas escape, and the uniform shape was also destroyed, as shown in Fig. 6c. Even after being coated with a layer of carbon, the same disordered morphology remained (C-ms, Fig. 6d), which may result in a high surface area and surface energy. Lower magnification SEM images of these samples are shown in Fig. S1,† and the general views of the morphologies of these three samples are consistent with the above description.
Nitrogen adsorption measurements were used to determine the pore structure of the mcms, C-mcms, ms and C-ms composites. Fig. 7 shows their adsorption–desorption isotherms and the pore size distribution curves. All four samples exhibit type IV isotherms with a typical H4 type hysteresis loop, which is nearly parallel over an appreciable range of relative pressure, according to the IUPAC classification. The open H4 type hysteresis loop can be attributed to the mesoporous structures formed by slit-like pores and the aggregation of particles and internal voids in the spheres.35 The core–shell structured mcms nanosphere sample shows a relatively narrow pore size distribution from 1.5–3 nm, indicating the existence of mesopores which originated from the mesoporous silica shell and mesoporous carbon core. During the carbon coating process, some of the sucrose molecules (with a molecular diameter of about 0.9 nm) were absorbed into these nanopores, and blocked them during carbonization, which resulted in the significant decrease of the detected specific surface area and pore volume. A similar phenomenon also happens for the C-ms sample. The surface areas of the core–shell mcms, C-mcms and C-ms are calculated to be 1226, 273 and 506 m2 g−1, respectively. The corresponding pore volumes are also calculated to be 0.30, 0.17 and 0.19 cm3 g−1, in which C-mcms demonstrates the lowest surface area and pore volume. The specific surface area and pore volume of the four samples are listed in Table 1.
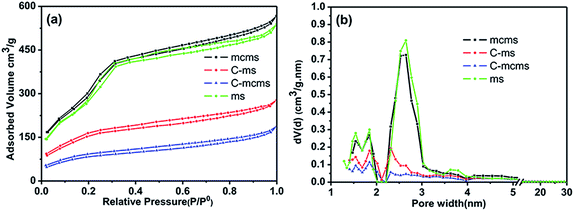 | ||
| Fig. 7 Nitrogen adsorption–desorption isotherms (a) and the Density Functional Theory (DFT) pore size distribution (b) of mcms, C-mcms, ms and C-ms. | ||
| Sample | BET surface area (m2 g−1) | Pore volume (cm3 g−1) |
|---|---|---|
| C-mcms | 273 | 0.17 |
| C-ms | 506 | 0.19 |
| mcms | 1226 | 0.30 |
| ms | 1188 | 0.27 |
As the density of SiO2 is 2.65 g cm−3, the average particle size of SiO2 (d) can be calculated based on the nitrogen–adsorption derived surface area.
| S = πd2 |
| V = πd3/6 |
| Sw = S/ρV = 6/ρd |
| d = 6/ρSw = 6/(2.65 × 106 × 1188.0) = 1.90 nm |
Transmission electron microscopy (TEM) was also carried out to provide further insight into the morphology and structure of the resulting C-mcms composites. As shown in Fig. 8, the carbon sphere core, porous silica layer, and carbon shell are organized compactly, which is in good accordance with the designed three layer structure. The size of each part of the C-mcms particle from inside to outside can also be measured to be about 100 nm diameter for the carbon core (the lighter area inside), 50 nm thick for the mesoporous silica layer (the darker area) and about 6 nm thick for the carbon shell (the lighter layer outside, and the carbon layer of the C-mcms was also observed by HRTEM, and is shown in Fig. 8c). It can be clearly found that the whole C-mcms spheres demonstrate a uniform size of 200 ± 10 nm, and are also dispersed well without agglomeration. STEM linescan was also carried out in order to further demonstrate the carbon–silica–carbon three layer structure of C-mcms. The Si, O, and C element distribution with the depth of the scanning point is shown in Fig. 8d. As we can see, there are no Si, O, and C elements detected at the start point. The C element shows a high content at the two edges of the scan line and the middle part of the particle, which refers to the carbon layer and carbon core, respectively. Correspondingly, Si and O elements show a higher content between the carbon layer and the carbon core, which refers to the SiO2 layer. Moreover, the Si and O element content decreases in the middle of the particle, with the increase of carbon content, which also confirms the three layer structure of C-mcms. TEM images of mcms and C-ms are also shown in Fig. S2;† the mcms spheres demonstrate a uniform morphology and are also dispersed well without agglomeration (Fig. S2a†), which is similar to the C-mcms. However, the uniform structure collapsed and broke into fragments after calcination, and some parts of the C-ms particles also cannot be covered by the carbon layer, as shown in Fig. S2b,† which is consistent with the description of SEM images.
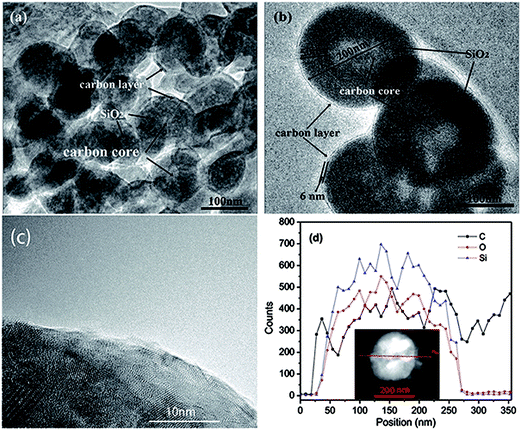 | ||
| Fig. 8 TEM images of the C-mcms (a) and (b), HRTEM of the carbon layer (c), and STEM linescan of the three layer structure of C-mcms (d). | ||
The electrochemical performance of the synthesized C/SiO2 composites as anode materials for lithium ion batteries was evaluated using CR2016 coin-type half-cells in the voltage range of 0–3.5 V.
The cyclic voltammetry (CV) curves of C-mcms at a scanning rate of 0.1 mV s−1 are displayed in Fig. 9. Several obvious reduction peaks located at 1.45 V, 1.26 V and 0.70 V can only be found in the first cycle. The small peaks at 1.45 V and 1.26 V may be attributed to side reactions between the electrolyte and electrode and the beginning formation of the solid electrolyte interface (SEI) layer on the electrode surface. The peak at 1.26 V may result from the reductive decomposition of vinylene carbonate (VC) as an additive in the electrolyte.36 According to the literature, the reduction peaks at around 1.0–1.5 V may be associated with the side reaction of Li+ with the residual oxygen-containing groups in the carbon shell or carbon core, which also consumes lithium ions and results in irreversible capacities.22 But the specific reaction between the electrolyte and electrode still remains unclear; more work may need to be done to explain it. While the long cathodic plateau at 0.70 V is associated with the electrolyte decomposition and the formation of SEI layer on the surface of the electrode.22,30,36 As reported, the formation of the solid electrolyte interface (SEI) layer on the electrode surface may contribute a lot of the irreversible capacitance, and result in a low initial coulombic efficiency. And from the second cycle, all these peaks would disappear. The long cathodic peak below 0.5 V in the first cycle should be assigned to the electrochemical reduction of SiO2 to Si, the irreversible formation of Li2O or Li4SiO4 (eqn (1a) and (1b)), and the insertion of lithium into active materials, including Si and carbon.29,36,37 These reactions can be summarized as follows:
| 2SiO2 + 4Li+ + 4e− → Li4SiO4 + Si | (1a) |
| SiO2 + 4Li+ + 4e− → 2Li2O + Si | (1b) |
| Si + xLi+ + xe− ↔ LixSi | (2) |
| C + yLi+ + ye− ↔ LiyC | (3) |
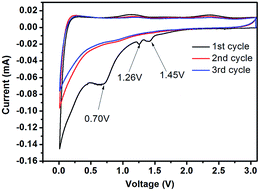 | ||
| Fig. 9 Cyclic voltammetry profiles of the C-mcms electrode measured in the voltage range of 0.01–3.0 V (vs. Li/Li+) with a scan rate of 0.1 mV s−1. | ||
Even though the inert Li2O and Li4SiO4 generated by reactions (1a) and (1b) contribute the major irreversible capacity, together with carbon, they can also act as a matrix to support and disperse the nano-Si particles preventing their aggregation and buffer the volume change during cycling, which is beneficial for maintaining a stable cycling performance, as evidenced by the following stable CV profiles after the first cycle. Both Si and carbon will alloy/dealloy with lithium reversibly and provide the reversible capacity (Reactions (2) and (3)) in the following cycles.
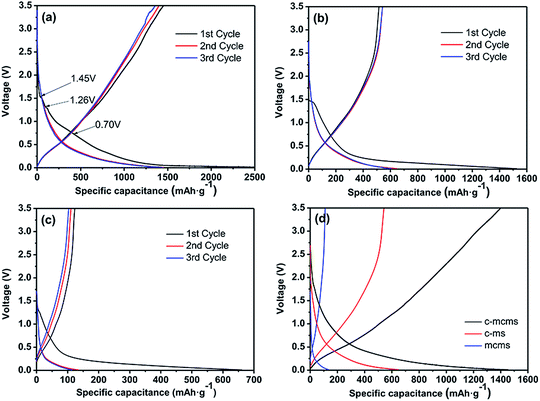
Fig. 10 displays the charge–discharge profiles of the three C/SiO2 composites for the initial three cycles in the voltage range of 0.01 to 3.5 V at a current density of 100 mA g−1. Specifically, as shown in Fig. 10a, there are two small plateaus located at 1.45 V and 1.26 V and one relatively longer plateau located at 0.7 V; these can only be found on the first discharge curve, which is consistent with the peaks in the CV profile. The initial discharge capacity of the C-mcms is found to be 2547 mA h g−1, while the charge capacities reaches 1438 mA h g−1, with an initial coulombic efficiency of 56.5%. By reducing the diameter of the SiO2 particles into nanosize, it may make the reaction more readily to complete in the first several cycles compared with the large particle size. The coulombic efficiency increases to 96% in the 2nd cycle, and remains at approximately 100% in the following cycles. The high coulombic efficiency indicates a stable SEI film on the electrode surface. The coulombic efficiency climbing to above 90% in the second cycle is common in SiO2 (ref. 38 and 39) and other anode materials, for example, the CE of the Si/H-rGO composite film increases from 47% in the first coulombic efficiency to above 94% in the subsequent cycles.40 By reducing the diameter of the SiO2 particles into nanosize, it may make the reaction more easily to complete compared with the large particle size. However, the first charge capacity of C-ms and mcms only reaches 516 and 123 mA h g−1, and the corresponding coulombic efficiencies are calculated to be 33.8% and 18.6%, respectively. Both the charge capacity and coulombic efficiency of C-mcms are much higher than those of C-ms and mcms. According to previous reports,22,30,41,42 the irreversible capacity loss in the first cycle is mainly ascribed to the formation of the solid electrolyte interphase and electrolyte degradation.
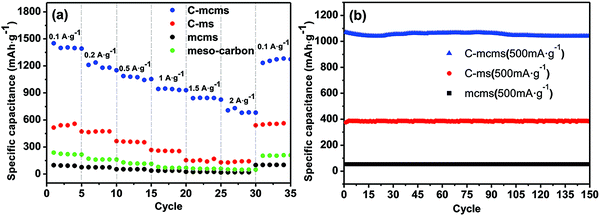
The rate performances of the three synthesized C/SiO2 composites at various charge–discharge rates were also evaluated and compared. As shown in Fig. 11a, C-mcms was found to demonstrate a better rate performance compared to C-ms and mcms at each current density. For example, it demonstrates little difference in charge capacity between different current densities and presents a higher reversible capacity of approximately 1400 mA h g−1 at a current density of 100 mA g−1 and nearly 660 mA h g−1 even at a current density of 2000 mA g−1, demonstrating the excellent high rate performance for high power lithium-ion batteries. More significantly, the C-mcms electrode also displays a good capacity recovery when the current density switches back from 2000 mA g−1 to 100 mA g−1, suggesting good electrode structure stability. However, the other two electrodes, C-ms and mcms, deliver much lower capacities at different testing current densities, for example, C-ms delivers only 605 mA h g−1 and mcms delivers only a capacity of 110 mA h g−1 at a current density of 100 mA g−1. The rate performance of mesoporous silica was also studied and is shown in Fig. S3;† the capacity only reaches 115–120 mA h g−1 at a current density of 100 mA g−1 due to its low conductivity, which is similar to that of mcms. The results demonstrate that without the carbon coating on the surface of SiO2 particles, the conductivity and capacity would be extremely low.
The cycle performance of the three different samples was also evaluated for 150 cycles at a current density of 500 mA g−1, as shown in Fig. 11b; the C-mcms electrode delivers the highest reversible specific capacitance of more than 1055 mA h g−1, and can be maintained for 150 cycles without any tendency of degradation. According to the TGA result of C-mcms, considering the 26.5% percent of carbon (with the specific capacitance to be 130 mA h g−1, shown in Fig. 11a), it can be calculated that the specific charge capacity of the silica component is about 1388 mA h g−1. However, the C-ms and mcms can only deliver a capacitance of 385 mA h g−1 and 55 mA h g−1 at a current density of 500 mA g−1, respectively. The three samples can all demonstrate a stable cycling performance, which suggests that a stable matrix was formed to support and disperse the nano-Si from aggregation and buffer the volume change during cycling.
Due to the absence of the carbon coating on the surface of mesoporous silica, the conductivity of mcms could be very poor; it becomes relatively more difficult for the transportation of lithium ions throughout the silica particles, thus demonstrating a very low initial discharge capacity. Moreover, the high specific area of mcms indicates that the SiO2 is exposed to the electrolyte directly, resulting in more side reactions with the electrolyte to form excessive SEI layers on the surface of SiO2 particles and causing the loss of electrical connection with the active material, thus leading to poor coulombic efficiency and a big capacity decay, which is almost 80% of the first discharge capacity loss. For the C-ms with a carbon layer coated on the surface of hollow mesoporous silica spheres, rate and cycle performances are improved to a great extent compared with the mcms. The conductive carbon framework can restrain the volume change of silica and guarantee rapid electron transfer throughout the composite. However, due to the structure collapse and deformation during calcination, some parts of the mesoporous SiO2 particles cannot be covered or filled by carbon, which results in the high surface area and pore volume (BET surface area: 506 m2 g−1 and pore volume: 0.19 cm3 g−1, respectively), thus lowering the integral conductivity. The uncoated or unfilled parts of SiO2 are still exposed to the electrolyte and it also results in the formation of an excessive SEI layer, thus lowering the reversible capacity.
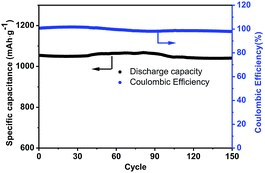
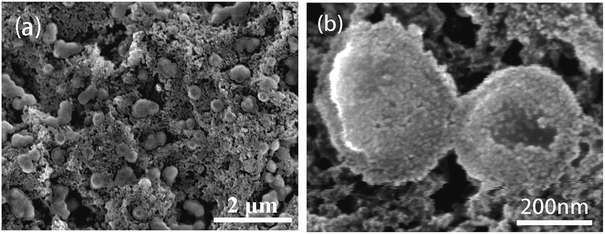
In contrast, the C-mcms with a three layer structure exhibits the best cycle performances. Fig. 12 shows the cycling performance with a coulombic efficiency of the C-mcms electrode at a high current density of 500 mA g−1. As we can see, C-mcms demonstrates an excellent charge–discharge reversibility and superior cycling stability, with a high reversible capacity of more than 1055 mA h g−1 with the coulombic efficiency maintaining at nearly 100% during the cycles. The excellent electrochemical performance may mainly be ascribed to the refined structure design: firstly, the three layer structure ensures that the porous silica nanoparticles be completely confined between carbon core and the carbon shell, as shown in the TEM picture. The carbon core and carbon shell together act as a mechanical backbone to support the SiO2 nanoparticles to be electrochemically active and help to keep the structural integrity during cycling; secondly, the carbon coating on the surface of the mcms spheres and partly inside the silica nanopores, although just several nanometres thick, not only acts as an electrical highway to reduce the transport distance of electron/lithium ions, but also lowers the surface area and results in less side reactions and less formation of the SEI. The carbon coated on the surface of SiO2 is also crucial for blocking the electrolyte outside the whole particle, minimizing the direct exposure of SiO2 particles to the electrolyte, and limiting majority of SEI formation to the outer surface of the carbon rather than the excessive formation on the SiO2 particles. Similar results have been reported before by encapsulating nano-silicon particles into a carbon chamber or hollow carbon spheres, and the electrochemical performance can be greatly enhanced.11,20,21 Thirdly, as the average particle size of SiO2 is calculated to be only 1.90 nm, the ordered internal void space with an average diameter of 2.65 nm (from the PSD, Fig. 7b) among these nanoparticles can provide free space to accommodate the mechanical strain and allow the Si to expand without pulverization during the Li+ intercalation and deintercalation process11,21,43 and help to form a relatively stable mixture, as illustrated in Fig. 13; the SEI layer formed outside of the carbon shell is helpful for maintaining a stable charge capacity and high coulombic efficiency. The assumption can be further confirmed by the SEM investigation of the C-mcms before and after cycling, as shown in Fig. 14; the C-mcms nanospheres composite electrode did not crack and pulverize after 150 charge/discharge cycles. Fourthly, the inert Li2O and Li4SiO4 generated during the first lithiation process, together with the carbon layer, can also help to improve the cycle stability by buffering the big volume change caused by the lithiation of active Si. Besides, by tailoring SiO2 particles into nanosize using the surfactant template, together with the nanopores among the SiO2 particles, the diffusion distance of lithium ions and electrons can be effectively reduced, thereby facilitating faster lithium ion transport in the silica matrix and ensuring an enhanced structural stability and cycle performance.22,30 At the same time, the local current density can also be decreased due to the high specific surface area of the silica nanoparticles.44
 | ||
| Fig. 13 Simplified two-dimensional cross-sectional view of one C-mcms sphere before and after electrochemical cycling. | ||
To further investigate the influence of different structures on the electrochemical performance of the three C/SiO2 electrodes for lithium-ion energy storage, EIS measurements were performed over a frequency range of 100 kHz to 0.01 Hz. Fig. 15a shows the Nyquist plots of the three electrodes after 30 cycles to ensure the formation of stable SEI films. The resistance Rsf ascribed to the surface film and the charge transfer resistance Rct due to the electrode reaction in the electrode–electrolyte interface are combined in a depressed semicircle in the high frequency region.45 The long slope line represents the Warburg impedance (ZW) in the low frequency region, which indicates the diffusion of lithium ions into the solid matrix. The equivalent electrical circuit model (as shown in the inset of Fig. 13a) was used to fit the three Nyquist plots, in which the symbols Rs, Rf, Rct and ZW represent the solution resistance, contact resistance, charge-transfer resistance and Warburg impedance, respectively. The fitting results are listed in Table 2. The Rf and Rct values of the C-mcms electrode are 103.6 Ω and 68.2 Ω, respectively, which are the lowest compared with the other two electrodes. These results suggest that the special three layer structure with a carbon coating outside the mesoporous silica spheres lowers the contact and charge-transfer impedances, which is consistent with the above analysis. The lithium ion diffusion coefficient (DLi) could be calculated from the low frequency plots based on the following equations:
| Z′ = Re + Rct + σω−0.5 | (4) |
 | (5) |
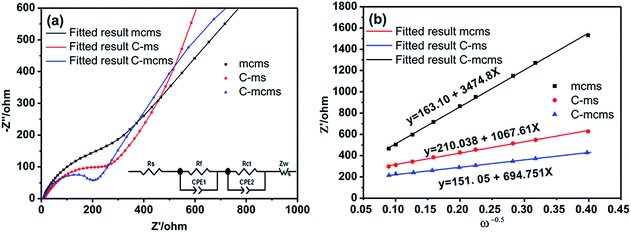 | ||
| Fig. 15 (a) The EIS plots of the three samples at 25 °C (inset: equivalent electrical circuit model) and (b) the Z′–ω−0.5 plots in the low frequency range. | ||
| Sample | R s (Ω) | R f (Ω) | R ct (Ω) |
|---|---|---|---|
| mcms | 8.3 | 240.2 | 507.3 |
| C-ms | 11.9 | 120.5 | 264.3 |
| C-mcms | 7.02 | 103.6 | 68.2 |
In eqn 4, ω(2πf) is the angular frequency in the low frequency region; both Re + Rct and the Warburg coefficient (σ) can be obtained from the fitting line while Z′ has a linear relationship with ω−0.5. In eqn (5), T is the absolute temperature, R is the gas constant, A is the surface area of the electrode, n is the number of electrons transferred per mole of the active material involved in the electrode reaction, F is Faraday's constant, and CLi is the molar concentration of lithium ions. Based on the fitting linear equation in Fig. 15b, the lithium ion diffusion coefficients of C-mcms, C-ms and mcms are calculated to be approximately 1.19 × 10⁻¹⁷ cm2 s−1, 5.07 × 10⁻¹⁸ and 4.79 × 10⁻¹⁹ cm2 s−1, respectively. The lowest surface film and charge transfer resistance and higher lithium ion diffusion coefficient and electrical conductivity confirm that C-mcms has more conductive pathways for lithium-ion transportation than the other two electrodes, resulting in enhancement in the electrochemical properties.
4. Conclusions
In summary, a new type of C/SiO2 composite with a carbon–mesoporous silica–carbon three layer structure was synthesized and evaluated as an anode material for high-energy lithium-ion batteries. The as-prepared composite with such a refined structure exhibits an excellent electrochemical capacity and cycle performance, and the effects of structure were systematically investigated by the comparison of similar composites without the carbon core or the carbon shell. It is revealed that the carbon shell may increase the integral electrical conductivity, decrease the SEI formation amount, and increase the initial coulombic efficiency, while the carbon core may support all SiO2 nanoparticles to be electrochemically active. Meanwhile, the mesopores in the SiO2 provided free space to accommodate the volume expansion and helped to keep a stable mixture during cycling. Therefore, with rational and optimal design of the C/SiO2 composites, the C-mcms composite is able to demonstrate excellent reversible capacity, high rate capability and cyclic stability, and show great potential for application as the next generation anode materials for high-energy lithium-ion batteries.Acknowledgements
This work was supported by the National Natural Science Foundation of China (grant No. 51274015) and the National Science Foundation (NSF-DMR 1505902). Xi Cao and Shuang Li would also like to thank the China Scholarship Council (CSC) for providing a scholarship for their Ph.D. study at the University of Washington.References
- J. B. Goodenough and K. S. Park, J. Am. Chem. Soc., 2013, 135, 1167–1176 CrossRef CAS PubMed.
- F. Cheng, J. Liang, Z. Tao and J. Chen, Adv. Mater., 2011, 23, 1695–1715 CrossRef CAS PubMed.
- H. Li, Z. Wang, L. Chen and X. Huang, Adv. Mater., 2009, 21, 4593–4607 CrossRef CAS PubMed.
- P. G. Bruce, B. Scrosati and J. M. Tarascon, Angew. Chem., Int. Ed., 2008, 47, 2930–2946 CrossRef CAS PubMed.
- B. Dunn, H. Kamath and J. M. Tarascon, Science, 2011, 334, 928–935 CrossRef CAS PubMed.
- Q. Zhang, E. Uchaker, S. L. Candelaria and G. Cao, Chem. Soc. Rev., 2013, 42, 3127–3171 RSC.
- Y. Wang, H. Li, P. He, E. Hosono and H. Zhou, Nanoscale, 2010, 2, 1294–1305 RSC.
- P. Poizot, S. Laruelle, S. Grugeon, L. Dupont and J. M. Tarascon, Nature, 2000, 407, 496–499 CrossRef CAS PubMed.
- W. W. Lee and J. M. Lee, J. Mater. Chem. A, 2014, 2, 1589–1626 CAS.
- V. Augustyn, J. Come, M. A. Lowe, J. W. Kim, P.-L. Taberna, S. H. Tolbert, H. D. Abruna, P. Simon and B. Dunn, Nat. Mater., 2013, 12, 518–522 CrossRef CAS PubMed.
- N. Liu, Z. Lu, J. Zhao, M. T. McDowell, H.-W. Lee, W. Zhao and Y. Cui, Nat. Nanotechnol., 2014, 9, 187–192 CrossRef CAS PubMed.
- C. Yu, X. Li, T. Ma, J. Rong, R. Zhang, J. Shaffer, Y. An, Q. Liu, B. Wei and H. Jiang, Adv. Energy Mater., 2012, 2, 68–73 CrossRef CAS PubMed.
- H. Wu and Y. Cui, Nano Today, 2012, 7, 414–429 CrossRef CAS PubMed.
- H. Wu, G. Chan, J. W. Choi, I. Ryu, Y. Yao, M. T. McDowell, S. W. Lee, A. Jackson, Y. Yang, L. Hu and Y. Cui, Nat. Nanotechnol., 2012, 7, 310–315 CrossRef CAS PubMed.
- H. Kim, M. Seo, M. H. Park and J. Cho, Angew. Chem., Int. Ed., 2010, 49, 2146–2149 CrossRef CAS PubMed.
- H. Lin, W. Weng, J. Ren, L. Qiu, Z. Zhang, P. Chen, X. Chen, J. Deng, Y. Wang and H. Peng, Adv. Mater., 2014, 26, 1217–1222 CrossRef CAS PubMed.
- K. Fu, Y. Lu, M. Dirican, C. Chen, M. Yanilmaz, Q. Shi, P. D. Bradford and X. Zhang, Nanoscale, 2014, 6, 7489–7495 RSC.
- J. Chang, X. Huang, G. Zhou, S. Cui, P. B. Hallac, J. Jiang, P. T. Hurley and J. Chen, Adv. Mater., 2014, 26, 758–764 CrossRef CAS PubMed.
- R. Yi, F. Dai, M. L. Gordin, S. Chen and D. Wang, Adv. Energy Mater., 2013, 3, 295–300 CrossRef CAS PubMed.
- B. Wang, X. Li, X. Zhang, B. Luo, Y. Zhang and L. Zhi, Adv. Mater., 2013, 25, 3560–3565 CrossRef CAS PubMed.
- Y. Park, N. S. Choi, S. Park, S. H. Woo, S. Sim, B. Y. Jang, S. M. Oh, S. Park, J. Cho and K. T. Lee, Adv. Energy Mater., 2013, 3, 206–212 CrossRef CAS PubMed.
- N. Yan, F. Wang, H. Zhong, Y. Li, Y. Wang, L. Hu and Q. W. Chen, Sci. Rep., 2013, 3, 6 Search PubMed.
- W. S. Chang, C. M. Park, J. H. Kim, Y. U. Kim, G. Jeong and H. J. Sohn, Energy Environ. Sci., 2012, 5, 6895–6899 CAS.
- Q. Sun, B. Zhang and Z. W. Fu, Appl. Surf. Sci., 2008, 254, 3774–3779 CrossRef CAS PubMed.
- B. K. Guo, J. Shu, Z. X. Wang, H. Yang, L. H. Shi, Y. N. Liu and L. Q. Chen, Electrochem. Commun., 2008, 10, 1876–1878 CrossRef CAS PubMed.
- C. Ban, B. B. Kappes, Q. Xu, C. Engtrakul, C. V. Ciobanu, A. C. Dillon and Y. Zhao, Appl. Phys. Lett., 2012, 100, 243905 CrossRef PubMed.
- Y. Yao, J. J. Zhang, L. G. Xue, T. Huang and A. S. Yu, J. Power Sources, 2011, 196, 10240–10243 CrossRef CAS PubMed.
- M. Sasidharan, D. Liu, N. Gunawardhana, M. Yoshio and K. Nakashima, J. Mater. Chem., 2011, 21, 13881–13888 RSC.
- P. P. Lv, H. L. Zhao, J. Wang, X. Liu, T. H. Zhang and Q. Xia, J. Power Sources, 2013, 237, 291–294 CrossRef CAS PubMed.
- Z. Favors, W. Wang, H. H. Bay, A. George, M. Ozkan and C. S. Ozkan, Sci. Rep., 2014, 4, 7 Search PubMed.
- Y. Fang, G. Zheng, J. Yang, H. Tang, Y. Zhang, B. Kong, Y. Lv, C. Xu, A. M. Asiri, J. Zi, F. Zhang and D. Zhao, Angew. Chem., 2014, 126, 5470–5474 CrossRef PubMed.
- H. Estrade-Szwarckopf, Carbon, 2004, 42, 1713–1721 CrossRef CAS PubMed.
- Y. Liu, T. P. Chen, Y. Q. Fu, M. S. Tse, J. H. Hsieh, P. F. Ho and Y. C. Liu, J. Phys. D: Appl. Phys., 2003, 36, L97–L100 CrossRef CAS.
- S. Hofmann and J. H. Thomas III, J. Vac. Sci. Technol., B: Microelectron. Nanometer Struct., 1983, 1, 43–47 CrossRef CAS.
- K. S. W. Sing, D. H. Everett, R. A. W. Haul, L. Moscou, R. A. Pierotti, J. Rouquerol and T. Siemieniewska, Pure Appl. Chem., 1985, 57, 603–619 CrossRef CAS.
- Y. J. Du, M. Y. Hou, D. D. Zhou, Y. G. Wang, C. X. Wang and Y. Y. Xia, J. Energy Chem., 2014, 23, 315–323 CrossRef CAS.
- M. Q. Li, J. Li, K. Li, Y. Zhao, Y. G. Zhang, D. Gosselink and P. Chen, J. Power Sources, 2013, 240, 659–666 CrossRef CAS PubMed.
- P. Lv, H. Zhao, C. Gao, T. Zhang and X. Liu, Electrochim. Acta, 2015, 152, 345–351 CrossRef CAS PubMed.
- L. Zhang, J. W. Deng, L. F. Liu, W. P. Si, S. Oswald, L. X. Xi, M. Kundu, G. Z. Ma, T. Gemming, S. Baunack, F. Ding, C. L. Yan and O. G. Schmidt, Adv. Mater., 2014, 26, 4527–4532 CrossRef CAS PubMed.
- H. Tang, J. P. Tu, X. Y. Liu, Y. J. Zhang, S. Huang, W. Z. Li, X. L. Wang and C. D. Gu, J. Mater. Chem. A, 2014, 2, 5834–5840 CAS.
- X. Q. Yang, H. Huang, Z. H. Li, M. L. Zhong, G. Q. Zhang and D. C. Wu, Carbon, 2014, 77, 275–280 CrossRef CAS PubMed.
- J. G. Tu, Y. Yuan, P. Zhan, H. D. Jiao, X. D. Wang, H. M. Zhu and S. Q. Jiao, J. Phys. Chem. C, 2014, 118, 7357–7362 CAS.
- H. Zhong, H. Zhan and Y. H. Zhou, J. Power Sources, 2014, 262, 10–14 CrossRef CAS PubMed.
- P. Lv, H. Zhao, C. Gao, Z. Du, J. Wang and X. Liu, J. Power Sources, 2015, 274, 542–550 CrossRef CAS PubMed.
- M. E. Orazem and B. Tribollet, Electrochemical Impedance Spectroscopy, 2011 Search PubMed.
Footnote |
| † Electronic supplementary information (ESI) available. See DOI: 10.1039/c5ta05879a |
| This journal is © The Royal Society of Chemistry 2015 |


