
 Open Access Article
 This Open Access Article is licensed under a Creative Commons Attribution-Non Commercial 3.0 Unported Licence
Generation of Cu–In alloy surfaces from CuInO2 as selective catalytic sites for CO2 electroreduction
Abdesslem
Jedidi
,
Shahid
Rasul
,
Dilshad
Masih
,
Luigi
Cavallo
and
Kazuhiro
Takanabe
*
Division of Physical Sciences and Engineering, KAUST Catalysis Center (KCC), King Abdullah University of Science and Technology (KAUST), 4700 KAUST, Thuwal, 23955-6900, Kingdom of Saudi Arabia. E-mail: Kazuhiro.takanabe@kaust.edu.sa
First published on 11th August 2015
Abstract
The lack of availability of efficient, selective and stable electrocatalysts is a major hindrance for scalable CO2 reduction processes. Herein, we report the generation of Cu–In alloy surfaces for electrochemical reduction of CO2 from mixed metal oxides of CuInO2 as the starting material. The material successfully generates selective active sites to form CO from CO2 electroreduction at mild overpotentials. Density functional theory (DFT) indicates that the site occupation of the inert In occurs more on the specific sites of Cu. In addition, while In atoms do not preferentially adsorb H or CO, Cu atoms, which neighbor the In atoms, alters the preference of their adsorption. This preference for site occupation and altered adsorption may account for the improved selectivity over that observed for Cu metal. This study demonstrates an example of a scalable synthesis method of bimetallic surfaces utilized with the mixed oxide precursor having the diversity of metal choice, which may drastically alter the electrocatalytic performance, as presented herein.
Introduction
Artificial photosynthesis, which takes water and atmospheric/industrially sourced carbon dioxide as reactants under sunlight irradiation to produce solar fuels, is an ideal energy conversion process that has the potential to not only ensure the protection of the environment but also safeguard global economic security.1,2 Artificial photosynthesis may involve photo/electrocatalytic H2 generation by water splitting or the direct formation of CO2 reduction products to provide a continuous supply of high-energy carrier fuels on a small/medium scale.3 The construction of electrocatalysts that can efficiently activate stable CO2 molecules has proven to be a significant challenge. The challenge is made more serious when attempting to control selectivity, as the process generates several different products because of the complex multiple electron and proton coupling steps required to yield hydrocarbons. Hori et al. performed pioneering studies on electrochemical CO2 reduction, where most of the transition metal electrocatalysts were studied.4,5 In addition to metals, semiconductors, oxide-derived metallic electrodes, and alloys have also been investigated as electrocatalysts in order to identify well performing electrodes.6 However, due to inefficiency, low selectivity, instability, and the high costs of most of the catalysts investigated for CO2 reduction to date, new avenues for electrocatalyst design are required.To develop new electrocatalysts that meet the criteria for commercial viability, a deep understanding of the reaction phenomenon ensuing at the molecular level is essential.7 Numerous strategies have previously been devised to control the reaction chemistry of the CO2 reduction utilizing one-electron shuttle,8 ionic liquids,9,10 organic compounds and organometallic complexes.11 Density functional theory (DFT) calculations have also been employed to design electrocatalysts with superior efficiency and higher selectivity.12–14 More recently, two different approaches, bimetallic15–18 and oxide-derived metal electrodes,19–21 have received much attention. In both approaches, much focus has been paid to tuning the binding strengths of the intermediates on the surface of the catalyst to improve the reaction kinetics of the CO2 reduction.
In general, the CO2 reduction activity and the product selectivity depend on the nature of the electrolyte, temperature, pressure, the stabilization of the CO2˙− radical,4 and, most importantly, on the binding of CO,22 which is a fundamental intermediate in the reduction of CO2, to the surface of the catalyst employed. For example, Pt group metals initially reduce CO2 to produce CO, which binds strongly to the surface, poisoning the electrode, preventing further CO2 reactivity, and hydrogen (H2) is generated as the main product from the competing reduction of water.4 In contrast, Au23 and Ag24 bind CO weakly to release CO from the surface before further electron–proton coupled transfer occurs to generate hydrocarbons. Cu possesses an intermediate binding energy for CO, which not only provides successive electron/proton transfers but also offers the potential for C–C coupling as well to produce methane (CH4), methanol (CH3OH) or ethanol (C2H5OH).15,18,25–27
To further tune the reactivity of Cu catalysts, the incorporation of heteroatoms on the surface is considered to affect the reactivity towards CO2 activation.13 Synergistic effects caused by the heteroatoms lead to both electronic and geometric alteration of the active sites, which may in turn cause drastic changes in the activity and selectivity for CO2 conversion. Recently, we reported that the electrodeposition of In on oxidized Cu sheets forms a unique Cu–In alloy, typically Cu11In9, which shows high selectivity for CO2 reduction to CO at a moderate overpotential.17 While the bulk electronic properties (d-band centers) were not affected by alloying Cu, density functional theory calculations suggested that the occupation of specific Cu sites (especially edge sites) due to In atoms is prevalent, and the neighboring Cu of the In on the (100) facet also effectively changes its adsorption properties.17
In this study, we designed a unique generation method for CuIn alloy active sites, starting from CuInO2. The two metal atoms in the mixed oxide precursors were essentially dispersed in an alternating manner in their crystal structures at the atomic scale, so that reduction of such oxides is expected to generate well mixed alloy active sites. The bimetallic approach would alter the local electronic and geometric environment, resulting in better control over selectivity. As a result, the identity of heteroatoms rather surprisingly alters the performance of the CO2 catalysis. Further, we extend the DFT analysis to analyze in deeper detail the In preference on different orientations of Cu surfaces and also to investigate the interaction of H and CO on pure and modified Cu surfaces other than the (100) facet. The modified surfaces contain an In atom as a replacement of a Cu atom at the top of the surface.
Experimental protocol
For the synthesis of CuInO2, first, In2O3 (Aldrich 99.9%) was mixed with Na2CO3 (Aldrich 99.999%) in a 1![[thin space (1/6-em)]](https://www.rsc.org/images/entities/char_2009.gif) :1 molar ratio and then heated at 1273 K to prepare NaInO2 in a tube furnace (Nabertherm RS 80/300/13, tube I.D. 70 mm) under a high flow of nitrogen gas (1.5 L min−1). Next, the NaInO2 was reacted with CuCl in a 1:1 molar ratio and then heat treated at 673 K for 12 h under flowing N2.28 For reference, Cu2O (Aldrich ≥99.99%) was used as purchased.
:1 molar ratio and then heated at 1273 K to prepare NaInO2 in a tube furnace (Nabertherm RS 80/300/13, tube I.D. 70 mm) under a high flow of nitrogen gas (1.5 L min−1). Next, the NaInO2 was reacted with CuCl in a 1:1 molar ratio and then heat treated at 673 K for 12 h under flowing N2.28 For reference, Cu2O (Aldrich ≥99.99%) was used as purchased.
For the electrochemical investigation, a custom-made three-electrode system was employed, controlled by a BioLogic© VMP3 potentiostat. Pt wire and Ag/AgCl (in saturated KCl) were used as the counter and reference electrodes, respectively. All the applied potentials are reported as reversible hydrogen electrode (RHE) potentials, which were measured through accurate measurements of the pH. The working electrode from the powder CuInO2 was fabricated using the electrophoretic deposition method.29 The geometric area used was typically 1.5 × 2 cm2 carbon paper (Toray TGP-H-60) for both working and counter electrodes. During electrophoretic deposition, colloidal particles of each electrocatalyst (∼0.5 g) were suspended using ultrasonication in reagent-grade acetone (50 ml) with a small amount of iodine (∼50 mg). Homogenous films on carbon paper were obtained under an applied potential of 30 V for 3 min. The films were dried at 373 K in a vacuum for 12 h. The control experiment shows that the currents that originated from the bare carbon paper electrode were negligible in the relevant potential range reported hereafter.
For CO2 conversion studies, the as-prepared Cu oxide electrodes were first subjected to the CO2 reduction conditions in 0.1 M KHCO3 (99.99%, metal basis, Sigma-Aldrich) under chronopotentiometric conditions at −1.67 mA cm−2 to obtain reduced electrodes. The KHCO3 electrolyte was saturated with a continuous flow of CO2 (10 ml min−1), and the final pH was 6.8. Further experiments at different potentials were performed using the obtained reduced electrodes.
To quantify the gas- and liquid-phase products for the CO2 reduction experiments, an on-line gas analyzer (H2, CO, CH4, CO2, C2H6, and C2H4), an off-line gas chromatograph with a flame ionization detector (CH3OH), and a high-performance liquid chromatography instrument (HPLC, Agilent 1200 series) (HCOOH, CH3COOH and other oxygenates) were employed. The on-line microGC (SRI Instruments, T-3000) was equipped with the following two channels: (1) 5A molecular sieves and a thermal conductivity detector using Ar as a carrier gas, and (2) HayeSep Q and a thermal conductivity detector. The minimum detection limit for the gas products was 50 ppm.
Powder X-ray diffraction (XRD) patterns in the 2θ range of 10–80° were recorded to investigate the crystalline nature and phase purity of the products. The XRD patterns of the powder samples were recorded on a Bruker model D8 Advance. Cu-Kα radiation from a Cu anode X-ray tube operating at 40 kV and 40 mA was used as an X-ray source for collecting the XRD patterns. X-ray photoelectron spectroscopy (XPS) was conducted using an AMICUS system (Kratos Analytical). All the peaks were calibrated on the basis of the C 1s peak at 284.8 eV.
Computational details
Electronic structure calculations were performed based on Density Functional Theory (DFT) using the revised Perdew–Burke–Ernzerhof (revPBE) exchange–correlation functional, as implemented in the VASP code.30–33 Plane-wave basis sets (with a kinetic energy cutoff of 500 eV)34 describe the valence electrons: 11 electrons of Cu (3d104s1) and three electrons of In (5s25p1). The following were used in the calculations: 0.1 eV smearing of the Fermi-level and (8 × 8 × 8) k-points for bulk calculations and (4 × 4 × 1) for surface calculations. The core electrons were replaced by projector augmented wave (PAW) pseudopotentials.35,36 The relaxation of the atomic positions in the supercell occurred until the energy differences were smaller than 0.01 eV Å−1.The bulk Cu–In alloy was treated as a well-defined Cu11In9 with lattice parameters of a = 12.814 Å, b = 4.3543 Å, c = 7.353 Å, and β = 54.49°.37,38 We modeled the (100), (111) and (211) Cu surfaces with slabs of three atomic layers (four layers for the 100 facet) and a p (3 × 3) supercell with a vacuum in the direction perpendicular to the surface of 12 Å. To understand the local preference of In atoms in the Cu surfaces, the modification of the surface was performed by replacing a Cu atom with an In atom in two cases: from the top and the second layer.
The energy of various species was calculated as described previously.35 Specifically, the electronic energy of free molecules was calculated as the electronic energy of the specific molecule referred to graphene for C atoms, to 1/2 H2 for H atoms, and to (H2O–H2) for O atoms. For adsorbed species, the adsorption energy (Eads) was calculated as the electronic energy of the relaxed slab/adsorbate species referred to the electronic energy of the relaxed clean slab, and to graphene for C atom, to 1/2H2 for H atoms, and to (H2O–H2) for O atoms.
Results and discussion
Electrocatalytic performance and characterization of the Cu–In catalyst
The CuInO2 electrode was reduced electrochemically at a geometric-electrode current density of −1.67 mA cm−2 for 1 h in 0.1 M KHCO3 saturated with CO2 (KHCO3/CO2). A typical reduction profile for the CuInO2 sample is shown in Fig. 1. The initial transition of the potential was observed to originate from the material reduction (up to ∼50 min), followed by steady state catalytic reactions (beyond ∼50 min). After the initial reduction reaction of the materials, the sample was tested under the same conditions after replacing the solution. The resulting performance with reference to the Faradaic efficiency (FE) of the various electrodes is shown in Fig. 2. Under steady-state electrolysis at −1.67 mA cm−2, the Cu sample (from Cu2O) generates FEs of 77% H2, 13% CO and 10% HCOOH, which required the potential lower than −1.0 V vs. RHE. Remarkably, the CuIn sample showed that CO2 was effectively reduced to produce FEs of H2 (6%), CO (63%), and HCOOH (31%) at ∼−0.7 V vs. RHE. | ||
| Fig. 1 Chronopotentiometric electrolysis of CuInO2 (initial reduction) at a jtot of −1.67 mA cm−2 in CO2-saturated 0.1 M KHCO3 aq. (pH 6.8). | ||
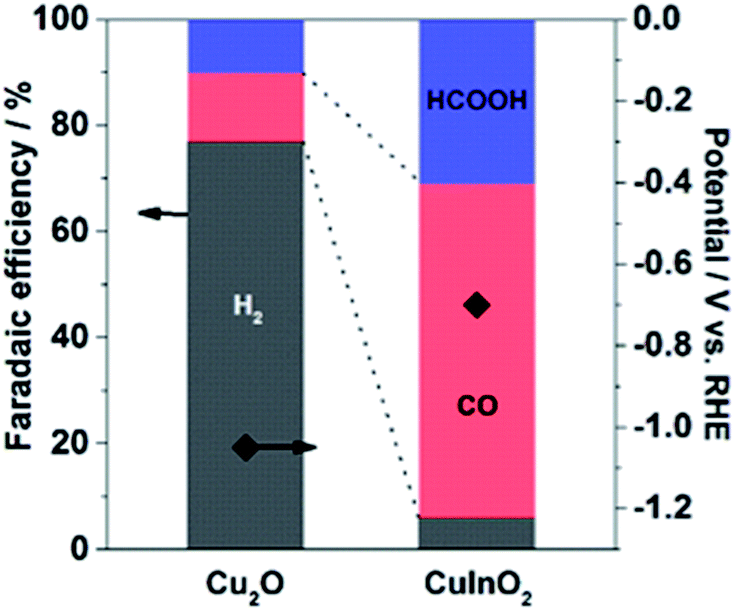 | ||
| Fig. 2 Comparison of the chronopotentiometric results of Cu-based electrodes at a jtot of −1.67 mA cm−2 in CO2-saturated 0.1 M KHCO3 aq. (pH 6.8). | ||
The CO2 reduction results obtained using bimetallic CuInO2 derived electrodes clearly demonstrate the differences in the electrocatalytic performances. The superior performance of CuIn over Cu for CO2 reduction was consistent with that obtained in our previous study for the samples where In was electrochemically deposited on oxidized Cu surfaces.17 The Faradaic efficiency at given potentials (between −0.4 and −0.7 V vs. RHE) was always higher for CuIn than for Cu alone with only slightly reduced current density.17 The improved Faradaic efficiency for CO2 reduction using CuIn surfaces is likely due to different local geometric and electronic environments around the Cu sites. On one hand, the nature of the second metal or metal oxide situated in the vicinity of Cu appears to be paramount in the context of the CO2 reduction process. On the other hand, the In electrode (high overpotential for hydrogen) produced HCOOH as a major product only at high overpotentials.39–41 Thus, the discrete nature of each component in the Cu-based system influenced the selectivity of the products from aqueous CO2 under identical conditions. The standard potentials relevant in this study at pH 6.8 are listed below for reference:
| In2O3 + 6H+ + 6e− ⇌ 2In + 3H2O, ESHE = −0.608 V |
| Cu2O + 2H+ + 2e− ⇌ 2Cu + H2O, ESHE = 0.059 V |
| CO2 + H+ + 2e− ⇌ 2HCOO−, ESHE = −0.383 V |
| CO2 + 2H+ + 2e− ⇌ CO + H2O, ESHE = −0.403 V |
The CuIn electrode was further tested at various applied potentials. Fig. 3a shows the total current density (jtot) and FE at different potentials from −0.4 to −0.8 V vs. RHE in 0.1 M KHCO3/CO2 for 1 h. Fig. 3a shows that the overall current density of the electrode increases with the applied potential, and a steady-state current was obtained at each potential when tested for at least 1 h. Although the chronoamperometric measurement at various potentials was conducted using an identical electrode, the stable currents were measured at each potential (for more than 5 h), demonstrating the excellent stability of the electrode. The product selectivities at different potentials are shown in Fig. 3b. The product distribution at a given potential remained almost unchanged during our measurement, consistent with the highly stable nature of the electrode. The CuIn electrode starts to convert CO2 at approximately −0.4 V vs. RHE, generating CO with an FE of 11% while cogenerating H2 as the main product (FE 45%). We could not capture the remaining products by HPLC and GC, probably associated with undesired metal redox reactions. When the CuIn electrode was further negatively polarized, the selectivity of the CO2 reduction product was enhanced at applied potentials from −0.5 to −0.8 V vs. RHE. The FE of the CO2 reduction products at −0.8 V vs. RHE reached ∼90% (FEs of CO and HCOOH are 70 and 19%, respectively), whereas the H2 selectivity was under 10%. This obvious trend that CO2 conversion requires higher kinetic overpotential compared to H2 formation is consistent with the reported results using Cu based samples.17,20,42 This selectivity effect was prominent only when both In and Cu were present, as Cu or In alone produced mostly H2 or HCOOH, respectively.
 | ||
| Fig. 3 (a) Chronoamperometric electrolysis profiles, (b) their Faradaic efficiencies, and (c) Tafel analysis for jCO using the CuIn electrode in CO2-saturated 0.1 M KHCO3 aq. | ||
In addition, electrokinetic data were extracted from the geometric partial current densities of jCO as a function of the overpotential against CO at −0.103 V vs. RHE (Tafel plot), and the results are plotted in Fig. 3c. The Tafel slope of CO was found to be greater than 120 mV dec−1, close to the value reported for oxide-derived (OD)-Cu electrodes.20 In the case of the Cu sample, the Tafel slope of 120 mV dec−1 is generally invoked for a single electron transfer reaction as a rate limiting step.42
Fig. 4 shows the XRD profile and SEM image of the as-prepared and after-electrolysis CuIn samples. The XRD pattern of the as-prepared sample in Fig. 4a shows the major pattern ascribable to CuInO2, along with the NaInO2 precursor and In2O3 as impurity phases. For the sample after electrolysis, major peaks assigned to metallic Cu11In9, Cu7In3 and Cu were observed, in addition to the peaks associated with the carbon substrate, consistent with the phase diagram of the Cu–In system.43 It was confirmed that the CuInO2 phase was reduced to form the metallic phase. The SEM image of the as-prepared sample in Fig. 4b shows large particle aggregates consisting of a macroporous structure. After electrolysis, some rough textures with some small porosity were observed as a result of the reduction of the solid bulk CuInO2 particles (O removal), thereby shrinking the volume of crystal structures.
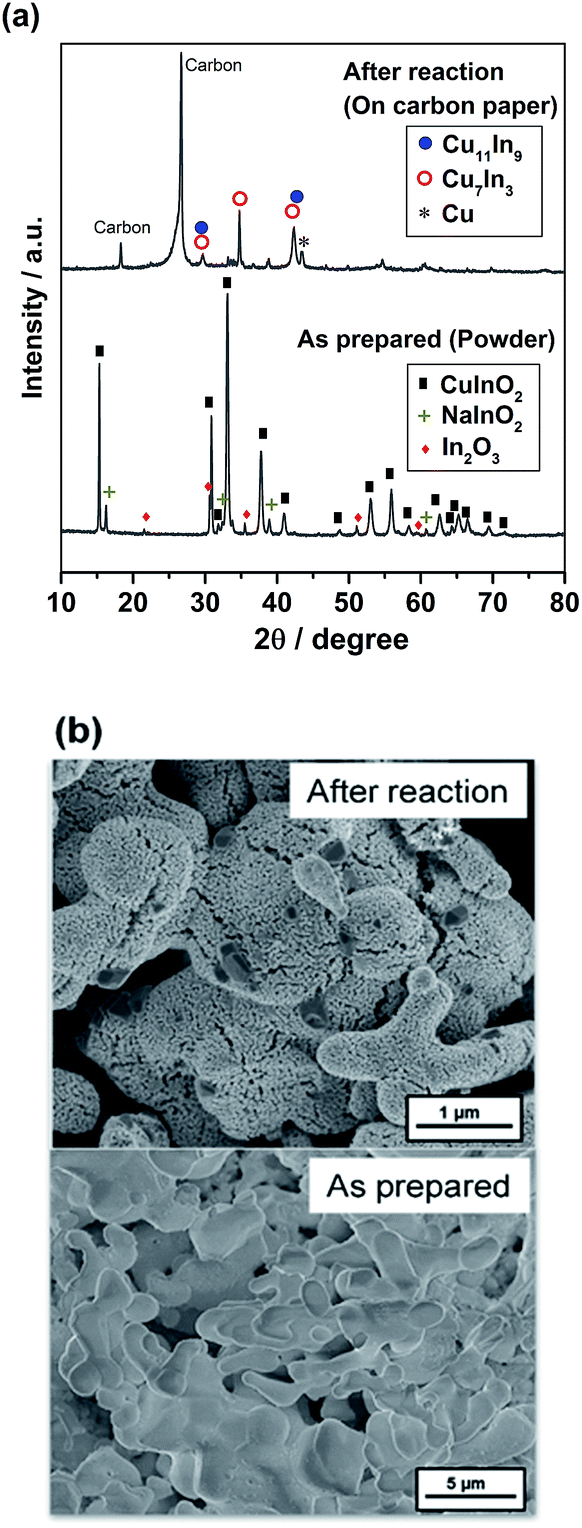 | ||
| Fig. 4 (a) XRD profiles and (b) SEM images of the as-prepared and after-electrolysis CuIn electrodes. | ||
The surface states of the CuInO2 and CuIn electrodes were investigated by XPS, as shown in Fig. 5. In the case of the XPS spectra of the Cu 2p core level of CuInO2, the broad Cu 2p3/2 and Cu 2p1/2 peaks at 934.8 and 954.6 eV were attributed to Cu(II) surface oxide. The Cu(II) oxide species exhibit satellite peaks at 942.3 and 944.9 eV because of the partially filled Cu 3d9 shells.44 In the case of In, the peaks positioned at 445.1 and 452.8 eV could be assigned to In 3d5/2 and In 3d3/2, respectively.45 Upon the reduction of CuInO2, a shift towards lower binding energies in both the Cu 2p and In 3d peaks was observed, exhibiting the Cu0 and In0 states, consistent with the XRD profile (Fig. 4a).
 | ||
| Fig. 5 XPS spectra of (a) Cu 2p and (b) In 3d for the as-prepared and after-electrolysis CuIn samples. | ||
Noticeably, the synthesis of mixed oxide powder precursors is easily scalable. Thus, we believe that multi-metallic functional catalysts can be further tailored to reduce CO2 to obtain higher hydrocarbons, which is still a challenge in realizing efficient electrochemical CO2 conversion. It is worth mentioning that the electrodeposition of In on flat Cu sheets improved only minimal Faradaic efficiency of CO2 reduction.17 The CuIn alloy originating from oxidized surfaces seems more effective, leaving the possibility that some unique facets generated from rough surfaces are specifically effective for CO2 reduction (or H2 evolution). The results discussed above raise a very important question about the influence of the environment on the nature of the active species when the second metal center is present along with Cu. Especially in the case of CuIn, the atomic radius of In is larger than that of Cu, and In prefers to be located on the edges compared to the corners or the bulk.17
Electronic structure of Cu–In alloys
In our previous communication,17 we briefly compared the density of states (DOS) of pure Cu and Cu11In9. In this part, we discuss the details of the DOS effects of In incorporation on Cu. For Cu–In alloy, a well-defined Cu11In9 structure was used for the DOS calculations. This structure has a metallic behavior, even if the DOS is low (0.25 states eV−1 atom−1) at the Fermi level (0 eV in the curve). The projections of the s, p and d-orbitals of Cu and In were demonstrated with respect to the total DOS of Cu11In9 in Fig. 6. Inspection of Fig. 6 indicates that the total DOS is formed mainly by the d-orbitals of Cu, with basically no contribution from In orbitals. Because the d-band in Cu is completely filled and its center is placed well below the Fermi-level, the center of the d-band is not affected by In incorporation, with a minimal variation from −3.34 eV in pure Cu to only −3.28 eV in Cu11In9.46,47 Compared to pure Cu, the edge of the band in the alloy, corresponding to the Cu-d states, is shifted to lower energy and becomes narrower by approximately 1 eV. This behavior is due to the reduction in the number of Cu–Cu bonds. | ||
| Fig. 6 Density of states of Cu, Cu11In9, and In for respective orbitals. | ||
Analysis of the DOS in the special-quasi-random (SQS) binary alloy structures proposed in the literature17 indicates that the SQS-alloy with an In content of 50% basically replicates the DOS in the Cu11In9 (45% In), while the DOS of the SQS structure with an In content of 25%, as expected, are even closer to that of pure Cu.
This observation leads to the conclusion that the presence of In in the alloy has a minor impact on the electronic structure of pure Cu, with the relevant implication that the different experimental behavior of Cu–In alloys from that of pure Cu could be the consequence of local modification of the active site on the different surfaces. This impact could be either in terms of preventing the formation of non-selective active sites or in terms of the geometrical or electronic modifications of non-selective sites, rendering them selective.
Cu (hkl) surfaces presenting an In atom
In this section, the geometrical and electronic impact due to the presence of an In atom on Cu surfaces is discussed. In addition to considering the In atom on the top of the Cu surface (1 ML),17 we extended the study to the second layer (2 ML) of the (100), (111) and (211) Cu facets. The first two facets are flat, while the last facet is stepped. The (111) facet has a higher atom density than the (100) facet, and it is characterized by 4-fold binding sites versus the 3-fold binding sites of the (100) facets. The (211) facet presents 3 different types of Cu atoms: highly saturated at the bottom of the step, highly unsaturated at the ridge of the step and moderately saturated in between. While we are aware that alloys presenting high In concentrations on the surface will result in surfaces that cannot be represented by a model consisting of a single In atom on a pure Cu surface, we still believe that this simple model can offer insights on local situations, i.e., whether the In prefers to sit on flat surfaces or to substitute Cu atoms in bulk layers below the surface, and in the case that it prefers to stay on the surfaces, whether it prefers to stay on top of the flat (100) and (111) surfaces or on the stepped (211) surface. The energy of substitution, ESub, was calculated as the energy of the substitution reaction:| Cun (hkl) + In = Cun−1 In (hkl) + Cu |
The values of ESub calculated for the different facets are reported in Fig. 7. Using the lowest ESub, which corresponds to the replacement of a Cu atom on the ridge of the (211) facet, the geometry indicated as ‘position 1’ in Fig. 7c, the relative stability of the different facets presenting an In atom can be calculated as follows:
| ΔESub (hkl) = ESub (hkl) − ESub (Cu (211) ridge) |
 | ||
| Fig. 7 Side views of (a) Cu (100), (b) Cu (111) and (c) Cu (211) with one In atom replacing a Cu atom for the first layer (1 ML) and the second layer (2 ML). The energies relative to the most stable structure (left) are presented. (d) Top view of bulk Cu11In9. | ||
Fig. 7 shows the energies of substitution of In in the positions. For all the surfaces, the calculations clearly show that In prefers to be on the top layer, rather than being embedded in a sublayer, with a difference in the energies of substitution of more than 1 eV for all the surfaces considered. Focusing on the substitution of atoms at the surface, the lowest substitution energy refers to In replacing a Cu atom on the ridge of the Cu (211) surface (position 1–1 ML), with ESub = 0.37 eV, while replacement of the middle and bottom Cu atoms on the top layer of the (211) facet requires increasingly more energy. Regarding the (100) and (111) facets, replacement of a Cu on the more densely packed (111) facet requires somewhat more energy than the replacement of a Cu on the (100) facet. Overall, this analysis consistently indicates that In prefers to replace less densely packed Cu atoms, which can be obviously related to the larger radius of In (1.56 Å), compared to that of Cu (1.45 Å).
H and CO adsorption on the Cu (100) flat surfaces and (211) step surfaces presenting an In atom
Considering that our calculations indicated that In prefers to substitute poorly coordinated Cu atoms, such as on the top of the ridge on the (211) surface or, by extension, on defects on the flat (100) and (111) surfaces, the impact of the presence of an In atom on H adsorption was investigated on such sites. For simplicity, we focused on the perfectly flat (100) surface and, consistently with the literature,27 on the stepped (211) surface as a model of poorly coordinated Cu as it can occur in steps and defects, and we compared the binding energy of a H atom on various positions on the (211) facet of Cu with the binding energy on the (100) facet. The results are compiled in Fig. 8. For the Cu (100) surface, H-adsorption shows slightly positive values for all the H-positions investigated (4-fold, 2 fold and on-top). Regarding the Cu (211) facet of pure Cu, our calculations show that H adsorption is preferred on a hollow of a 3-fold site (Eads = −0.18 eV; Fig. 8b), involving the edged Cu atom. This may imply that hydrogen evolution is in principle preferred on poorly coordinated sites as in edges, kinks, and defects. Analysis of the geometries corresponding to H adsorption on the same positions, when one of the Cu atoms is replaced by an In atom, indicates that the H atom basically avoids interaction with the In atom, and finds another 3-fold Cu site (Eads = −0.12 eV; Fig. 8a). On In atom, H adsorption is not preferred (Eads = +0.55 eV), consistent with low H adsorption energy and resulting low H2 evolution activity on In surfaces.39–41 | ||
| Fig. 8 Optimized geometries and relative energy of H adsorbed on the pure Cu (100) and Cu (211), and the In modified (211) Cu facet. The values shown in the figure represents ΔE, the electronic energy of the state minus the electronic energy of the clean slab associated with that state, with the H atom referenced to 1/2 H2 (ΔE (H) = E (slab + H) − E (slab) − E (H2)/2). | ||
Next, the CO adsorption energy on pure Cu (100) and Cu (211) surfaces was compared with that on the In-modified Cu (211) surface with the In atom in the top ridge position. The results are shown in Fig. 9. In the framework that CO adsorption on Cu is energetically unfavored (CO does not adsorb on Cu),48 adsorption of CO on the stepped Cu (211) surface is slightly less unfavored (+0.91 to +0.99 eV) compared to that on the flat Cu (100) surface (+1.03 to +1.07 eV). The adsorption energy of CO on the Cu (211) surface is not significantly affected by the presence of In atom (+0.89 to +1.02 eV), while adsorption of CO on In is highly disfavored (+1.74 eV).
 | ||
| Fig. 9 Optimized geometries and relative energy of CO adsorbed on the pure Cu (100) and Cu (211), and the In modified (211) Cu facet. The values shown in the figure represents ΔE, the electronic energy of the state minus the electronic energy of the clean slab associated with that state, with the C atom referenced to graphene and the O atom to (H2O–H2) (ΔE (CO) = E (slab + CO) − E (slab) − E (C)/4 − [E (H2O) − E (H2)]. | ||
In summary, our analysis suggests that In could replace poorly coordinated Cu atoms, either on the top of the ridge of the (211) surface, as well as on defects on the more stable (100) and (111) surfaces, thus acting as a poison, assuming that non-selective active sites correspond to these poorly coordinated Cu atoms. This specific geometry results in a distinctive situation where the adsorption energy of key intermediates, including H and CO, is slightly weakened. Thus, when key intermediates, such as H and CO, are weakly adsorbed on the surface, H2 generation is hindered, improving CO2 reduction selectivity, and notably CO is not further hydrogenated and so is produced as a major product.
Conclusions
Mixed bimetallic CuInO2 was successfully used as a precursor to generate CuIn alloy electrocatalysts for the reduction of CO2. The sample was found to remarkably improve the selectivity of the CO2 reduction to form CO and formic acid, with a total FE of 94% for CO2 conversion. The CuIn electrode shows excellent stability under CO2 reduction conditions, which is highly desired in the electrochemical recycling of CO2. Structural characterization identified the CuIn alloy phase. DFT calculation indicated that In site occupation occurs on Cu step sites, and the In sites hinder the adsorption of H and CO. These synergistic effects of the presence of both Cu and In account for the selectivity of electrocatalytic CO2 reduction. The generation of bimetallic sites from mixed oxide reduction has diversity in the choice of metals; thus, the resulting selectivity for CO2 electrocatalytic reduction can further be improved using this strategy.Acknowledgements
The research reported herein was supported by the King Abdullah University of Science and Technology (KAUST). L. C. and A. J. are grateful to the KAUST Supercomputing Laboratory for the resources provided under project k199.Notes and references
- T. A. Faunce, W. Lubitz, A. W. Rutherford, D. MacFarlane, G. F. Moore, P. Yang, D. G. Nocera, T. A. Moore, D. H. Gregory, S. Fukuzumi, K. B. Yoon, F. A. Armstrong, M. R. Wasielewski and S. Styring, Energy Environ. Sci., 2013, 6, 695–698 Search PubMed.
- N. S. Lewis and D. G. Nocera, Proc. Natl. Acad. Sci. U. S. A., 2006, 103, 15729–15735 CrossRef CAS PubMed.
- K. J. P. Schouten, F. Calle-Vallejo and M. T. M. Koper, Angew. Chem., Int. Ed., 2014, 53, 10858–10860 CrossRef CAS PubMed.
- Y. Hori, in Modern aspects of electrochemistry, ed. C. Vayenas, Springer, New York, 2008 Search PubMed.
- Y. Hori, H. Wakebe, T. Tsukamoto and O. Koga, Electrochim. Acta, 1994, 39, 1833–1839 CrossRef CAS.
- E. E. Barton, D. M. Rampulla and A. B. Bocarsly, J. Am. Chem. Soc., 2008, 130, 6342–6344 CrossRef CAS PubMed.
- K. P. Kuhl, E. R. Cave, D. N. Abram and T. F. Jaramillo, Energy Environ. Sci., 2012, 5, 7050–7059 CAS.
- Y. Yan, E. L. Zeitler, J. Gu, Y. Hu and A. B. Bocarsly, J. Am. Chem. Soc., 2013, 135, 14020–14023 CrossRef CAS PubMed.
- J. L. DiMeglio and J. Rosenthal, J. Am. Chem. Soc., 2013, 135, 8798–8801 CrossRef CAS PubMed.
- B. A. Rosen, A. Salehi-Khojin, M. R. Thorson, W. Zhu, D. T. Whipple, P. J. A. Kenis and R. I. Masel, Science, 2011, 334, 643–644 CrossRef CAS PubMed.
- C. Costentin, M. Robert and J.-M. Saveant, Chem. Soc. Rev., 2013, 42, 2423–2436 RSC.
- H. A. Hansen, J. B. Varley, A. A. Peterson and J. K. Nørskov, J. Phys. Chem. Lett., 2013, 4, 388–392 CrossRef CAS PubMed.
- H.-K. Lim, H. Shin, W. A. Goddard, Y. J. Hwang, B. K. Min and H. Kim, J. Am. Chem. Soc., 2014, 136, 11355–11361 CrossRef CAS PubMed.
- A. A. Peterson and J. K. Nørskov, J. Phys. Chem. Lett., 2012, 3, 251–258 CrossRef CAS.
- J. Christophe, T. Doneux and C. Buess-Herman, Electrocatalysis, 2012, 3, 139–146 CrossRef CAS.
- D. Kim, J. Resasco, Y. Yu, A. M. Asiri and P. Yang, Nat. Commun., 2014, 5, 4948 CrossRef CAS PubMed.
- S. Rasul, D. H. Anjum, A. Jedidi, Y. Minenkov, L. Cavallo and K. Takanabe, Angew. Chem., Int. Ed., 2015, 54, 2146–2150 CrossRef CAS PubMed.
- A. S. Varela, C. Schlaup, Z. P. Jovanov, P. Malacrida, S. Horch, I. E. L. Stephens and I. Chorkendorff, J. Phys. Chem. C, 2013, 117, 20500–20508 CAS.
- Y. Chen, C. W. Li and M. W. Kanan, J. Am. Chem. Soc., 2012, 134, 19969–19972 CrossRef CAS PubMed.
- A. T. Garcia-Esparza, K. Limkrailassiri, F. Leroy, S. Rasul, W. Yu, L. Lin and K. Takanabe, J. Mater. Chem. A, 2014, 2, 7389–7401 CAS.
- C. W. Li, J. Ciston and M. W. Kanan, Nature, 2014, 508, 504–507 CrossRef CAS PubMed.
- K. P. Kuhl, T. Hatsukade, E. R. Cave, D. N. Abram, J. Kibsgaard and T. F. Jaramillo, J. Am. Chem. Soc., 2014, 136, 14107–14113 CrossRef CAS PubMed.
- W. Zhu, R. Michalsky, Ö. Metin, H. Lv, S. Guo, C. J. Wright, X. Sun, A. A. Peterson and S. Sun, J. Am. Chem. Soc., 2013, 135, 16833–16836 CrossRef CAS PubMed.
- Q. Lu, J. Rosen, Y. Zhou, G. S. Hutchings, Y. C. Kimmel, J. G. Chen and F. Jiao, Nat. Commun., 2014, 5, 3242 Search PubMed.
- X. Nie, M. R. Esopi, M. J. Janik and A. Asthagiri, Angew. Chem., Int. Ed., 2013, 52, 2459–2462 CrossRef CAS PubMed.
- R. Reske, H. Mistry, F. Behafarid, B. Roldan Cuenya and P. Strasser, J. Am. Chem. Soc., 2014, 136, 6978–6986 CrossRef CAS PubMed.
- W. Tang, A. A. Peterson, A. S. Varela, Z. P. Jovanov, L. Bech, W. J. Durand, S. Dahl, J. K. Norskov and I. Chorkendorff, Phys. Chem. Chem. Phys., 2012, 14, 76–81 RSC.
- Y. H. M. Shimode, M. Sasaki and K. Mukaida, Mater. Trans., JIM, 2000, 41, 1111–1113 CrossRef.
- R. Abe, M. Higashi and K. Domen, J. Am. Chem. Soc., 2010, 132, 11828–11829 CrossRef CAS PubMed.
- G. Kresse and J. Furthmüller, Phys. Rev. B: Condens. Matter Mater. Phys., 1996, 54, 11169–11186 CrossRef CAS.
- G. Kresse and J. Hafner, Phys. Rev. B: Condens. Matter Mater. Phys., 1993, 47, 558–561 CrossRef CAS.
- G. Kresse and J. Hafner, Phys. Rev. B: Condens. Matter Mater. Phys., 1994, 49, 14251–14269 CrossRef CAS.
- G. Kresse and J. Hafner, J. Mater. Sci., 1996, 6, 15–50 CAS.
- A. A. Peterson, F. Abild-Pedersen, F. Studt, J. Rossmeisl and J. K. Norskov, Energy Environ. Sci., 2010, 3, 1311–1315 CAS.
- P. E. Blöchl, Phys. Rev. B: Condens. Matter Mater. Phys., 1994, 50, 17953–17979 CrossRef.
- G. Kresse and D. Joubert, Phys. Rev. B: Condens. Matter Mater. Phys., 1999, 59, 1758–1775 CrossRef CAS.
- N. Orbey, R. Birkmire, T. W. F. Russell and G. Jones, J. Phase Equilib., 2000, 21, 509–513 CrossRef CAS.
- P. V. P. Villars, Pearson's handbook: crystallographic data for intermetallic phases, ASM International, Materials Park, OH, 1997 Search PubMed.
- Z. M. Detweiler, J. L. White, S. L. Bernasek and A. B. Bocarsly, Langmuir, 2014, 30, 7593–7600 CrossRef CAS PubMed.
- J. Guo, S. Ouyang, T. Kako and J. Ye, Appl. Surf. Sci., 2013, 280, 418–423 CrossRef CAS PubMed.
- S. Kapusta and N. Hackerman, J. Electrochem. Soc., 1983, 130, 607–613 CrossRef CAS PubMed.
- C. W. Li and M. W. Kanan, J. Am. Chem. Soc., 2012, 134, 7231–7234 CrossRef CAS PubMed.
- L. Baqué, D. Torrado, G. Aurelio, D. G. Lamas, S. F. Aricó, A. F. Craievich and S. Sommadossi, J. Phase Equilib. Diffus., 2014, 35, 2–10 CrossRef.
- S. Yamamoto, H. Bluhm, K. Andersson, G. Ketteler, H. Ogasawara, M. Salmeron and A. Nilsson, J. Phys.: Condens. Matter, 2008, 20, 184025 CrossRef.
- R. W. Hewitt and N. Winograd, J. Appl. Phys., 1980, 51, 2620–2624 CrossRef CAS PubMed.
- B. Hammer and J. K. Nørskov, Surf. Sci., 1995, 343, 211–220 CrossRef CAS.
- B. Hammer and J. K. Nørskov, in Advances in Catalysis, ed. H. K. Bruce and C. Gates, Academic Press, 2000, vol. 45, pp. 71–129 Search PubMed.
- W. J. Durand, A. A. Peterson, F. Studt, F. Abild-Pedersen and J. K. Nørskov, Surf. Sci., 2011, 605, 1354–1359 CrossRef CAS PubMed.
| This journal is © The Royal Society of Chemistry 2015 |