 Open Access Article
Creative Commons Attribution 3.0 Unported Licence
Surface chemistry of La0.6Sr0.4CoO3−δ thin films and its impact on the oxygen surface exchange resistance
Ghislain M.
Rupp
*a,
Helena
Téllez
b,
John
Druce
b,
Andreas
Limbeck
a,
Tatsumi
Ishihara
b,
John
Kilner
bc and
Jürgen
Fleig
a
aInstitute of Chemical Technologies and Analytics, Vienna University of Technology, Getreidemarkt 9, Vienna, A-1060, Austria. E-mail: ghislain.rupp@tuwien.ac.at
bInternational Institute for Carbon-Neutral Energy Research, Kyushu University, 744 Motooka Nishi-ku, Fukuoka, 819-0395, Japan
cDepartment of Materials, Imperial College London, South Kensington Campus, London, SW7 2AZ, UK
First published on 5th October 2015
Abstract
The surface composition of dense La0.6Sr0.4CoO3−δ (LSC) thin film model electrodes, deposited by pulsed laser deposition at 600 °C on yttria-stabilized zirconia (100) electrolytes, was investigated by low-energy ion scattering (LEIS) and time resolved inductively coupled plasma mass spectrometry (ICP-MS). Results obtained by both methods agree qualitatively and quantitatively and provide a comprehensive picture of the surface composition and cation diffusion kinetics of LSC. The measurements revealed that freshly prepared LSC thin films already show a Sr-rich and Co-poor termination layer (80% Sr surface coverage). This Sr-rich surface layer was proven to be an equilibrium property of LSC as it forms again at elevated temperatures after removal. The kinetics of this surface reconstruction is surprisingly fast (<1 h at 550 °C) and indicates high Sr mobility in LSC. Electrochemical Impedance Spectroscopy (EIS) measurements at 400 °C revealed the detrimental effect of this surface layer on the oxygen surface exchange and suggest that higher Co concentrations in the termination layer facilitate the oxygen exchange reaction.
1. Introduction
Mixed ionic and electronic conducting (MIEC) perovskite-type oxides are of considerable technological interest for numerous applications including solid oxide fuel cells (SOFCs),1,2 solid oxide electrolysis cells (SOECs)3,4 or gas sensors.5,6 Among the perovskite-type solid solutions, (La,Sr)CoO3−δ (LSC) is one of the most promising cathode materials for intermediate temperature (500–600 °C) SOFCs due to its high catalytic activity for the oxygen surface exchange7 and high oxygen diffusivity.8 For LSC thin films under SOFC operating conditions, it is generally agreed that the oxygen surface exchange determines the oxygen reduction kinetics.9 Hence, the chemical composition and structure of the surface are considered important key factors for the cathode performance.Primarily, surface sensitive analytical techniques such as X-ray photoelectron spectroscopy (XPS),10–14 secondary ion mass spectrometry (SIMS)15,16 and low energy ion scattering (LEIS)17 have been employed to investigate the surface region of perovskite-type oxides and its influence on the oxygen exchange kinetics. Many of these studies connected degradation of the electrochemical kinetics to a Sr enrichment in this surface region in various perovskite-type materials such as (La,Sr)MnO3−δ,18,19 (La,Sr)(Co,Fe)O3−δ,11,12,15 Sr(Ti,Fe)O3−δ (ref. 20 and 21) and (Ba,Sr)(Co,Fe)O3−δ (ref. 22) upon elevated temperatures or polarization. A variety of poisons, such as SO2, CO2 (ref. 10, 23 and 24) and Si or Cr sources25,26 in the vicinity of a perovskite sample in wet atmosphere, were already shown to enhance the Sr segregation and degradation. On the one hand, thin film electrodes may exhibit excellent electrochemical performance with low polarization resistance.15,27–30 On the other hand, even on a short time scale (hours, days) stable measurements of the surface exchange rate of thin film electrodes are difficult to achieve, which not only impedes the commercialization of such thin film electrodes in devices but also hinders research to deconvolute the complex mechanism of surface exchange in perovskite-type oxide electrodes.
LEIS offers the possibility to quantitatively measure the cation occupation of the termination layer. Different LEIS studies on perovskite-type oxides with alkaline earth substituted A-sites confirmed a strong preference for termination by A cations with enrichment of Sr and Ba in the termination layers upon annealing at temperatures between 400 and 1000 °C.31–33 A further very surface sensitive tool is slow wet chemical etching and time resolved analysis of the eluate by inductively coupled plasma (ICP) spectrometry.15,27
In this contribution, composition changes of the surface and bulk (first 20 nm) of La0.6Sr0.4CoO3−δ thin films were analyzed by LEIS and time resolved inductively coupled plasma-mass spectrometry (ICP-MS). Effects of annealing and chemical etching on surface properties were determined. The cation occupation of the termination layer as well as the semi-quantitative composition of the sub surface layers were obtained by LEIS, while time resolved ICP-MS was able to measure the quantitative cation composition of the first 3–4 atomic layers of the LSC thin film. The combination of both methods allows to separate measurement artifacts and simplifies the interpretation. This gives us the possibility to directly correlate cation changes with the kinetics of the oxygen surface exchange reaction measured by electrochemical impedance spectroscopy (EIS).
2. Experimental
2.1 Thin film preparation
Targets for deposition of LSC thin films by pulsed laser deposition (PLD) were synthesized from powders prepared by Pechini synthesis.34 La2O3, SrCO3 and Co powders (all Sigma Aldrich, 99.995%) were individually dissolved in nitric acid, mixed in appropriate ratios and citric acid (TraceSELECT®, 99.9998%) was added for chelation. A calcination step was performed at 1000 °C, followed by isostatically pressing (∼150 MPa) of the powder to a pellet and a sintering procedure at 1200 °C for 12 hours in air, thus yielding a LSC target for PLD. The target composition was determined from a deposited film, which was completely dissolved in 0.12 mol l−1 hydrochloric acid and analyzed by conventional ICP-OES. The target composition was determined to be La0.62±0.02Sr0.41±0.02Co0.97±0.04O3−δ.The LSC thin films were deposited onto (100) oriented yttria stabilized zirconia (YSZ, 9.5 mol% Y2O3, Crystec GmbH, Germany) single crystals with a thickness of 0.5 mm and a size of 5 × 5 mm2. Epitaxy-ready polished substrates were used to prepare symmetrical samples with LSC thin films on both sides of the YSZ for impedance measurements, while LSC was simply deposited on one side of the substrate for the analytical measurements. Ablation of the target material was carried out by a KrF (λ = 248 nm) excimer laser (Lambda COMPexPro 201F) operated at a pulse repetition rate of 5 Hz, a pulse duration of 50 ns and a laser fluence of approximately 1.5 J cm−2 at the target. The atmosphere was set to 4 × 10⁻² mbar oxygen partial pressure and the substrate was heated to a surface temperature of 550 °C. By applying 6750 laser pulses to the LSC target, an LSC film of approx. 200 nm thickness was grown on the substrate (substrate to target distance = 6 cm). After deposition the sample was cooled in the deposition atmosphere at a cooling rate of 12 °C min−1. The substrate was flipped and the PLD procedure was repeated on the back side for the symmetrical samples. It is noteworthy that the sample surface was never exposed to “cleaning” treatments after deposition in order to avoid any reactions and contamination from solvents.
2.2 Microstructural characterization
The PLD target material was analyzed in Bragg Brentano geometry with a X'Pert Powder (PANalytical) diffractometer. A thin film diffraction pattern was obtained using a D8-Discover instrument (Bruker AXS) in parallel beam geometry equipped with a general area detector diffraction system (GADDS) at an accelerating voltage of 45 kV and measuring time of 200 seconds per frame and a step size of 0.2° 2θ per frame. Secondary electron microscopy was performed on a FEI Quanta 200 field emission gun scanning electron microscope equipped with an Everhart–Thornley detector. The microstructure of thin film cross-sections was analyzed by transmission electron microscopy (TEM) using an FEI Tecnai F20 equipped with a field emission gun at acceleration voltages of 200 kV.2.3 Electrical characterization and annealing
All annealing and impedance experiments were performed in a cleaned quartz tube which was evacuated and refilled several times with the desired high purity N2 (ALPHAGAZ™ 1 > 99.999 mol% nitrogen)/O2 (ALPHAGAZ™ 1 > 99.998 mol% oxygen) mixture (210 or 1 mbar O2) before the sample was heated. LSC thin films deposited on one side of the electrolyte for surface analytical characterizations were simply placed inside the quartz tube while symmetrical samples (LSC–YSZ–LSC) were sandwiched between two platinum foils for impedance measurements. The electronic connection in the sample holder consisted of Pt wires and a non-encapsulated type S thermoelement was used for temperature measurement. No materials other than Pt, quartz and the sample itself were heated during impedance measurement and annealing. All these precautions were taken in order to obtain electrochemical and compositional measurements that do not suffer from any cathode poisoning. It took approximately 1 hour to heat the sample to the desired temperature (thermal equilibration), then the impedance measurements were started. The impedance was measured by a Novocontrol Alpha A High Performance Frequency Analyzer in the frequency range from 106 to 10−2 Hz with a resolution of five points per decade and an alternating voltage of 10 mV (rms) applied between the two LSC thin films.2.4 Low-energy ion scattering (LEIS)
Surface and near-surface analysis of the samples was performed by LEIS using a Qtac100 spectrometer (ION-TOF GmbH, Germany) fitted with a high brightness ion source to provide the primary beam (Hyperion, Oregon Physics, USA). Several noble gas ion beams can be used for the analysis depending on the spectral range to be analysed. Typically, a 3 keV He+ beam is used to check the presence of organic contamination on the surface, indicated by a characteristic surface peak at ∼846 eV. The cation composition of the surface is analysed using a 6 keV Ne+ beam, which provides a better mass resolution for heavy elements. The primary ion beam is directed normal to the surface and the kinetic energy distribution of the backscattered ions at 145° (collected over the entire azimuth) is analysed to obtain the elemental composition of the first monoatomic layer. Depth profiling analysis was performed in a dual beam mode using a 1 keV Ar+ sputtering beam at a sputtering angle of 59 degrees. The sputtered area was 1.3 × 1.3 mm2 whereas a central region of 1 × 1 mm2 was analysed by the primary beam. The sputter rate for the depth calibration of the profiles was estimated by measuring the depth of a 300 × 300 μm2 crater using laser interferometry, assuming that the rate was uniform for the LSC thin film (the sputtered crater used for this calibration was terminated before reaching the YSZ substrate).For the quantification of the cation surface coverage, the plateau signals at the end of the depth profiles were used as the reference value for the bulk stoichiometry, as described in ref. 31.
Due to the extreme surface sensitivity of the technique, any adventitious contamination from the exposure to air is detrimental for the analysis. The LEIS instrument is fitted with a cleaning stage such that the samples could be cleaned by oxidation of the surface at room temperature prior to the analysis to remove the adsorbates (e.g. H2) or organic contaminants on the surface. In this process, the surface is cleaned by (chemical) oxidation using a reactive atomic oxygen flux once the sample is introduced at the instrument's load-lock chamber (base pressure around 10−8 mbar), without further exposure to the atmosphere. The neutral atomic oxygen with almost no kinetic energy is extracted from an RF plasma source (higher energy ionized species from the plasma are not extracted). This beam of oxygen atoms reacts with the hydrocarbons on the surface to form volatile H2O, CO and CO2 that are pumped away by the vacuum system. This procedure was proven to be very effective to clean oxide surfaces, like YSZ.35 The oxidation cleaning was performed in several 15 minutes cycles until the surface was free of organic contamination. The effectiveness of the cleaning process was checked by the analysis of the surface with 3 keV He+ ions until no carbon peak was detected (peak position at 846 eV) and similar intensities of the rest of the constituent cations for two consecutive spectra were obtained after a cleaning step (e.g. the La surface peak remained the same intensity before and after the cleaning cycle).
2.5 Time resolved inductively coupled plasma-mass spectrometry (ICP-MS)
The near surface composition of the LSC films as well as their bulk composition was determined by time-resolved analysis of the eluate resulting from chemical etching. The samples were installed into a custom-made polytetrafluoroethylene etching compartment with a volume of 289 μl. The LSC layers were then slowly dissolved in a continuous flow of ultrapure water (produced by Barnstead™ Easypure™ II (18.2 MΩ cm−1)) which was switched to 0.012 mol l−1 hydrochloric acid (EMSURE® for analysis) after 360 seconds during the time resolved measurement. A second liquid flow of an internal standard, 10 ppb Mn (prepared from Mn-standard, Titrisol®) spiked 0.24 mol l−1 hydrochloric acid was merged with the eluate (eluent + dissolved cations) of the sample for correction of instrumental drifts. An external peristaltic pump (Spetec GmbH, Perimax 12) directed the eluent flow through the etching compartment and the total liquid flow towards the iCAP™ Q (ThermoFisher Scientific, Bremen, Germany) ICP-MS spectrometer introduction system, consisting of a Peltier cooled spray chamber (PFA nebulizer and cyclone) and a quartz torch. The liquid flow was set to ∼1 ml min−1 and the nebulizer gas flow to 1 l Ar min−1. The RF-power was set to 1550 W, and a 0.8 l Ar min−1 auxiliary and a 14 l Ar min−1 cooling gas flow were applied. Before starting the first measurements the setup was optimized with a tuning solution to yield maximum intensity for 110In and a low CeO+/Ce+ ratio (<1.9%). For the measurements of LSC thin films, each isotope (55Mn, 59Co, 86Sr and 139La) was measured using a dwell time of 10 μs. A mixed solution of La (ICP-Multi-Element Standard, Aristar®), Co and Sr (both Plasma Emission Standard, Prolabor®) was used for standard calibration.3. Results
3.1 Structural characterization
The surface morphology of a 210 nm thin LSC film on top of YSZ was investigated by FESEM, see Fig. 1. Closely packed grains with a size of 40–70 nm are found together with cracks on the surface of the thin film. Crack formation cannot be avoided and is caused by the difference of thermal expansion coefficients between thin film (LSC64 (ref. 36) = 20.5 × 10⁻⁶ K−1) and substrate (YSZ37 = 10.8 × 10⁻⁶ K−1). It takes place during cooling to room temperature after thin film deposition. TEM cross-sections, Fig. 1, confirm the dense packing of columnar grains without any voids in between the grains as expected for the PLD growth conditions27,38 used here.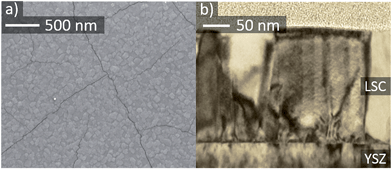 | ||
| Fig. 1 SEM image of a LSC thin film surface (a) and TEM cross-section of a ∼210 nm thin LSC film (b). | ||
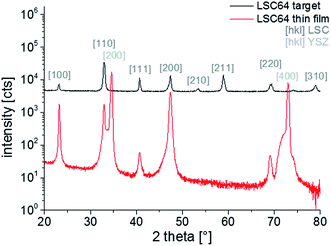
In Fig. 2, patterns over the measured 2θ range are shown for the LSC64 target and the thin film diffraction. All visible peaks of the polycrystalline target diffraction pattern could be assigned to the LSC64 perovskite phase and no sign of impurities was found. The peaks were indexed with respect to the pseudo-cubic structure of the material since the rather small rhombohedral distortion (rhombohedral angle αr = 60.36° (ref. 5)) of the crystal lattices could not be measured with the given resolution. The pseudo cubic lattice parameter of LSC (apc = 3.842 ± 0.003 Å) derived from the polycrystalline target diffraction patterns in good agreement with literature values.5 The thin film pattern shows the actual thin film growth relative to the (100) YSZ plane. Therefore, the pattern overlaps with the intense (200) and (400) peaks of the substrate. Only YSZ and LSC thin film peaks are found, indicating a phase-pure deposition. Furthermore, it can be seen that the textured film grows preferentially in (100) and (110) direction. Grains grown in (111) direction are also observed. Due to the small size of thin film peaks the out-of-plane lattice parameters of LSC (apc = 3.83 ± 0.01 Å) can only be deduced with limited accuracy.
3.2 Surface cation chemistry and performance of as-deposited LSC thin films
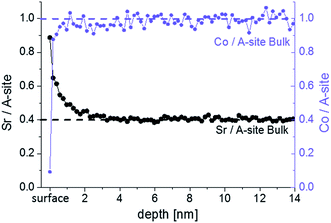
LEIS and ICP-MS were first used to investigate the cation composition of freshly deposited samples. Fig. 3 shows the “Sr/A-site” and “Co/A-site” ratio as a function of depth for an as-deposited sample measured by LEIS. A sputter dose of about 1.5–2 × 10¹⁵ ions per cm2 was used so it can be assumed that between each analysis cycle (measurement point) approximately 1 atomic layer was removed. However, the sputter process can cause cation intermixing, thus hindering an exact interpretation in terms of atomic layer composition for all layers except the surface layer (i.e. for the first analysis cycle, the analysis beam dose was kept below the static limit, assuring that less than 1% of the surface is bombarded and minimizing the surface damage). The cation composition of the target is highlighted by the dotted lines. It can be seen that in the first 3 nm the cation stoichiometry does not fit to the bulk stoichiometry. A Sr enrichment close to the surface together with a Co depletion is found. Sr segregation may occur during the PLD process (at 600 °C) or the subsequent slow cooling phase since cations are sufficiently mobile at these temperatures as reported in ref. 39. Cai et al. also found a Sr-rich and Co-depleted region close to the surface of LSC on as-deposited samples by XPS measurements.12 Other authors also reported cation rearrangements at the surface of perovskites during thin film growth.40,41The surface layer, represented by the very first measurement point in Fig. 3, shows the highest Sr occupancy. 81% of the surface cation sites are occupied by Sr ions. Furthermore, almost no cobalt is found in the termination layer, while the next measurement points indicate a Co/A-site ratio close to the bulk values of one. The very Sr-rich termination layer is not necessarily a true part of the LSC perovskite lattice. A SrO termination layer on top of the LSC film could also correspond to an AO layer of the so called Ruddlesden–popper structure (ABO4 = ABO3·AO). A rocksalt AO termination layer was also assumed for other single perovskites (La0.6Sr0.4Co0.2Fe0.8O3−δ (ref. 32)) and double perovskites (PrBaCo2O5+δ, GdBaCo2O5+δ (ref. 33)) with the transition metal of the double perovskites being buried below the surface layer. Further interaction of this layer with CO2 and H2O (i.e. SrCO3, Sr(OH)2) might be possible.42,43
Additionally, ICP-MS measurements were conducted on as-deposited thin films, see Fig. 4. Different eluents continuously dissolved parts of the LSC films and in Fig. 4a the cation concentration of the eluate, as detected by the mass spectrometer, is plotted against the measurement time. The eluent used for the extraction of the LSC cations was switched from ultrapure H2O to diluted 0.012 mol l−1 hydrochloric acid after 360 seconds, which is also highlighted in the graph. In the beginning of the experiment, when H2O is used as eluent, a sharp peak of the cation signals is observed. This indicates that only a limited amount of water-soluble cations exists on top of the thin films. The amount of water-soluble cations can be determined by standard calibration and integration over the H2O peak (0.65 nmol Sr, 0.46 nmol Co and 0.16 nmol La). From the lattice parameter it can be calculated that 0.33 nmol Sr would be needed to form one atomic layer of SrO covering the entire 5 × 5 mm2 surface of the thin film. This means that the etching procedure does not only dissolve the very Sr-rich surface layer found in LEIS. In the given example, the additionally dissolved cations would correspond to about two elementary cells of LSC covering the projected area of 5 × 5 mm2. Effects of the enhanced surface area e.g. due to cracks are discussed in Section 3.4. As soon as the eluent is switched to dilute HCl, without interrupting the continuous eluent flux, a small La peak is observed and indicates that the ultrapure water possibly preferentially dissolved Sr and Co. During the course of the HCl etching the cation concentration again increases and reaches a rather constant level after 120 seconds.
The composition changes detected in the course of the etching procedure and thus over the thin film depth can be much better understood when plotting the molar ratio of the cations versus the sum of all cations detected by the mass spectrometer, Fig. 4b. Assuming that the thin film is etched homogenously, the total cation amount can be directly translated into a depth. In the case of LSC64, 1 nmol of cations corresponds to 0.78 nm LSC. In this plot we again see that the ultrapure water primarily dissolves Sr and Co. After switching to diluted HCl a sharp peak of La is observed. The expected bulk stoichiometry is found after extraction of 7.5 nmol cations. In this work, however, we will mainly focus on the water soluble part detected by the ICP-MS as it gives most information on the surface and near-surface cation composition of our thin films.
3.3 Annealing of as-deposited thin films
A decrease of the electrochemical performance of LSC thin films and related materials with annealing time was often reported and mostly connected to stoichiometry changes at or close to the surface. It is known that Sr surface segregation can be chemically driven by atmospheric trace gases such as SO2, CO2 or H2O.10,23,24 Furthermore, the presence of a Si or Cr source in the vicinity of a perovskite sample together with a wet atmosphere were also shown to lead to strontium precipitation on the surface.25,26 Therefore, special care was attributed to avoidance of any contamination of the atmosphere during the annealing procedure, see Section 2.2.An as-deposited sample with two symmetrical LSC electrodes was annealed at 600 °C for 15 h in synthetic air and impedance spectra were continuously taken. Representative Nyquist plots normalized to the projected electrode surface area shown in Fig. 5. The high-frequency (>50 kHz) intercept can be attributed to the oxide ion conduction of the electrolyte. Small differences of the intercept between the spectra most probably originate from temperature fluctuations (±1 °C) during the measurement. At medium frequencies (50–1 kHz) a shoulder appears next to a low frequency semicircle (1 kHz to 0.1 Hz). The shoulder was already reported in earlier studies,44 where it could be attributed to electrochemical processes at the electrode/electrolyte interface. The low frequency semicircle is the only part of the spectra that changes its shape or size with annealing time. It could be fitted to a parallel R-CPE element (CPE = constant phase element with exponential fitting parameter n ∼ 0.9). The capacitive element can be assigned to the chemical capacitance Cchem of the thin film according to the model of Jamnik–Maier.45 The values of Cchem are approx. 984 ± 96 F cm−3 and thus in the typical range found for LSC thin film electrodes. The resistance can be attributed to the oxygen surface exchange reaction, Rsurface exchange.44 Despite all precautions taken to avoid any cathode poisoning, Rsurface exchange continuously increases from 0.6 to 4.6 Ω cm−2 within 15 hours of annealing time. One may suppose that still strong Sr segregation was caused by an unknown poisoning process. Therefore the surface chemistry of the annealed thin films was investigated by LEIS and ICP-MS.
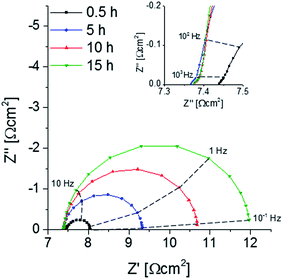 | ||
| Fig. 5 Nyquist plot displaying the impedance change of a symmetrical deposited sample upon annealing at 600 °C, the inset shows the middle-frequency (50–1 kHz) range in detail. | ||
LEIS and ICP-MS measurements were performed on LSC thin films that were annealed for 1, 4 and 16 hours in the same experimental setup, results are given in Fig. 6 and 7. Interestingly, the LEIS depth profiles do not show any significant changes of the cation stoichiometry. The depth profiles of the annealed thin films are almost identical to those of the as-deposited thin film. Only an even smaller Co coverage is found on the surface for the 16 h annealed thin film. Fig. 7 summarizes the amount of water soluble cations for the differently annealed thin films measured by the ICP-MS. For each annealing time three samples were investigated and the error bars are obtained from the standard deviation. Again, no significant changes are found, except for a slight increase of the Sr amount during the first hour of annealing. Overall, none of the chemical analysis methods indicated substantial surface composition changes that reveal a simple correlation to the strong decrease of the oxygen surface exchange kinetics. From a compositional point of view, the thin film surface layer seems to be in a frozen-in state or already close to an equilibrium state without much driving force to change the surface structure.
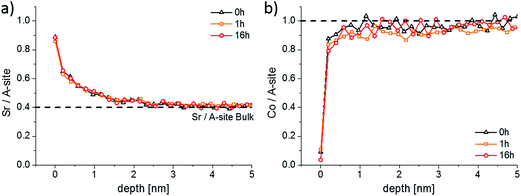 | ||
| Fig. 6 LEIS depth profiles showing the Sr/A-site (a) and the Co/A-site (b) ratio of an as-deposited sample and of two samples that were annealed at 600 °C for 1 and 16 h. | ||
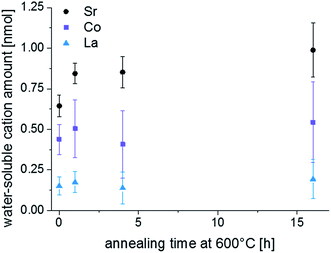 | ||
| Fig. 7 H2O soluble amount of cations detected by ICP-MS on a freshly deposited sample and on samples that were annealed for 1, 4 and 16 h at 600 °C. | ||
3.4 Surface treatment of as-deposited thin films
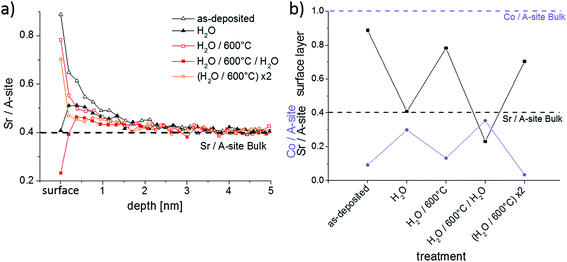
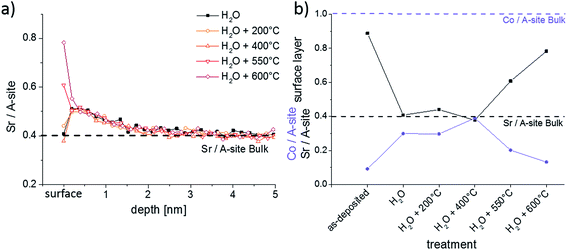
In Section 3.2 it was shown that Sr-rich layers of the LSC thin film could be removed by water during the ICP-MS measurements. This process of surface modification and its reversibility by short heat treatments was further investigated by LEIS and ICP-MS. First, several as-deposited samples were stirred ex situ for 10 min in ultrapure H2O in order to remove the water soluble layers. The samples were subsequently dried in a pure nitrogen gas stream. Two samples were then analyzed by LEIS and ICP-MS. The other samples were annealed for 1 h at 600 °C in syn. air and also chemically analyzed. These steps were repeated with chemical analysis by LEIS. All cation compositions measured by LEIS are shown in Fig. 8.Fig. 8a displays the LEIS depth profiles of the Sr cation composition, while Fig. 8b focusses on the Co/A-site and Sr/A-site ratio of the surface termination layer, i.e. the very first measurement points in Fig. 8a. After the first H2O treatment the Sr level of the termination layer is strongly reduced. Simultaneously, a substantially higher amount of Co is measured in the termination layer. However, the Co amount is still far from bulk stoichiometry. The remaining part of the termination layer consists of La. The Sr enrichment in the near-surface layers is reduced but still present. This nominal decrease of Sr content in subsurface layers by the ex situ H2O etching can be partly attributed to the fact that H2O removes more than the surface termination layer, similar to the results observed by time resolved ICP-MS using H2O as eluent (cf. Section 3.2). During the annealing of a H2O treated sample for 1 h at 600 °C, Sr segregates back to the top of LSC leading to about 70% Sr ions with respect to the total cation amount in the termination layer. Except from the termination layer the Sr depth profiles of the H2O treated and the H2O treated + 600 °C annealed samples are almost identical. The absence of any Sr depletion in the first 5 nm of the annealed thin film raises the question from where the Sr segregates back to surface. This will be addressed in Section 3.5.
After a renewed exposition of an annealed thin film to ultrapure water for 10 min, the Sr depletion at the surface is again found. This time the Sr surface coverage even drops lower and the Co coverage is once more increased compared to the annealed sample. Another annealing step at 600 °C for 1 h brings the Sr-rich and Co-poor termination layer back. Again, no Sr depletion could be detected in the first few nm. These experiments confirm that formation of a Sr-rich surface layer is an equilibrium property of LSC. This layer is water soluble and cation diffusion kinetics is sufficiently fast to reestablish the termination at 600 °C in less than one hour.
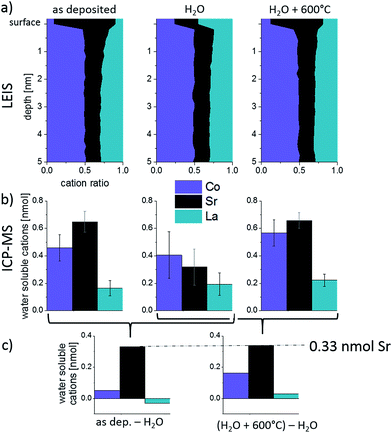
The effect of H2O treatment and annealing was also investigated by ICP-MS in order to obtain information on the layer composition and on the true cation amounts that were removed and resegregated to the top of the thin films. The results are shown in Fig. 9a, together with the LEIS depth profiles plotted in a different manner. The LEIS depth profiles indicate the measured cation stoichiometry in the first 5 nm for three different surface treatments. Fig. 9b displays the amounts of each cation in the “water peak” of the ICP-MS measurements (cf. Section 3.2). Three samples were investigated for each sample treatment to ensure reproducibility, as reflected by the error bars.
For the as-deposited sample, mainly Sr and Co are dissolved in ultrapure H2O, cf. first data points in Fig. 7. Qualitatively, the composition measured by ICP-MS (high Sr, low La) corresponds to that of the top layer analyzed by LEIS. Quantitatively, there are differences due to the fact that the “water peak” dissolves more than only the termination layer, see Section 3.2. Also after the ex situ H2O treatment of the as-deposited sample cations are dissolved during the time resolved ICP-MS etching using H2O (see Fig. 9 center). This is surprising since not only ex situ H2O treatment but also time resolved etching are performed using ultrapure water and should not dissolve further ions. Both, the dissolution of ions in addition to the Sr-rich termination layer of the as-deposited film and the dissolution of LSC after ex situ H2O treatment may be explained by the following: trace gases, e.g. CO2, adsorb at sample surface before ICP-MS analysis. Those can form acids in combination with the eluent (H2O) used during the ICP-MS measurement. This can then lead to an additional dissolution of cations from the LSC lattice, which comes to an end as soon as all adsorbates are consumed. These trace gases from ambient air are expected to desorb at higher temperatures and are therefore irrelevant for the electrochemical measurements performed in a constant flow of high purity gases. For the H2O treated sample a decreased amount of soluble Sr is found within the ICP-MS eluate compared to the as-deposited sample while for the other cations no relevant changes were observed. This strongly suggests that the main difference between surface composition of an as-deposited and a H2O treated layer is the absence of a very Sr-rich layer in the latter case.
After the H2O treated sample is annealed at 600 °C for 1 h in synthetic air, again a Sr-rich eluate is measured by the ICP-MS in accordance with the high Sr surface coverage found by LEIS. The different amounts of water-soluble cations obtained for the H2O treated + annealed sample corresponds well to the amounts found for the as-deposited sample. Since the “water peaks” in ICP-MS also include cations of sub-surface layers, it is most interesting not to focus on the absolute cation amounts but on the differences between the surface treatments (Fig. 9c). Significant differences (confidence interval of ∼90%) are only found for Sr and, as highlighted in Fig. 9, this difference amounts to ca. 0.33 nmol Sr that is removed during H2O treatment and segregated back to the surface after annealing. As already mentioned above, 0.33 nmol of Sr is exactly the amount needed to form one layer of (100) SrO on top of the 5 × 5 mm2 thin film.
LEIS results, however, show that the surface layer is Sr-rich but does not entirely consist of Sr. The difference can be at least partially explained by the different surfaces investigated by the two techniques. While LEIS results reflect the cation composition of the projected surface, the eluent used in the water treatment and analysis during ICP-MS dissolves cations from the true surface. The true surface area is enlarged i.e. by the cracks shown in Fig. 1 and an area increase of about 30% compared to the projected surface area would already explain the measured difference. This comparatively small enhancement of the surface area by cracks is also in accordance with earlier studies on the thickness dependency of the surface exchange resistance and water soluble Sr amount found on the surface of similar thin films.27 Furthermore, H2O does not necessarily dissolve the thin film homogenously. A preferential cation dissolution at grain boundaries may further affect the data. Nonetheless, both analytical techniques present a very similar picture of the cation composition at and close to the surface.
The quick reappearance of a Sr-rich surface termination at 600 °C after its removal in H2O raises the question of the kinetics of Sr diffusion and segregation. Annealing of H2O treated samples was therefore performed at different temperatures for 1 h. The LEIS results of Fig. 10 show that thin films annealed up to 400 °C for 1 h do not show any significant differences in the composition of the surface. Neither the surface composition (Fig. 10b) nor the depth profile (Fig. 10a) is modified by annealing up to 400 °C. The depth profiles of these thin films also underpin the reproducibility of the H2O treatment since all measurements were performed on different thin films. The thin film annealed at 550 °C, on the other hand, again exhibits a Sr-rich and Co-poor termination layer. This is even more pronounced after annealing at 600 °C: then 69% of surface cations are Sr, compared to 51% after annealing at 550 °C. At 550 °C Sr resegregation was most probably not completed yet after 1 hour.
The exact mechanism and the rate limiting step of Sr segregation is not clear yet. The substantial amount of Sr needed for the measured Sr-rich surface termination has to lead to some Sr depletion in the film. However, such a depletion was not observed within the first 5 nm of any annealed LSC thin films (Fig. 10a) and thus fast Sr diffusion with only slight depletion in larger parts of the film are concluded. Significant Sr tracer diffusion profiles were already reported at 650 °C in ref. 39 and quantitative data on fast diffusion along grain boundaries and bulk were deduced. Since ambipolar diffusion coefficients are expected to be much larger than the tracer diffusion coefficients,39 this is in accordance with our results.
3.5 Influence of the termination layer on the oxygen exchange kinetics
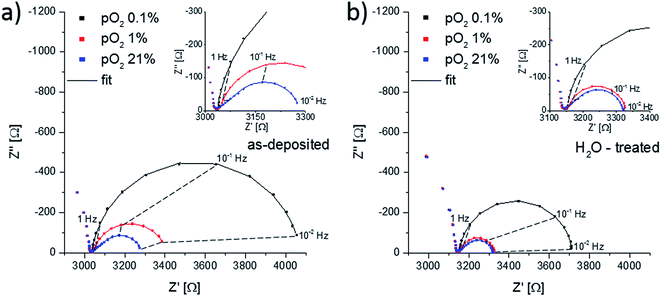
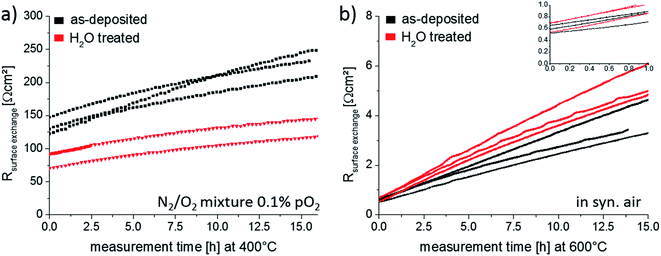
To investigate whether the Sr-rich termination layer promotes or inhibits the oxygen surface exchange reaction, impedance measurements were performed on as-deposited thin films and thin films after H2O treatment at 400 °C, Fig. 11. Both Nyquist plots show the electrode impedance dependency on the oxygen partial pressure. For all partial pressures, two main features in the impedance spectra can be distinguished. At high frequencies (>1 kHz) the onset of a semicircle is observed, which represents the ionic conductivity of the YSZ electrolyte. This part of the spectra was not visible in Fig. 5, because of the higher measurement temperature and thus a higher bulk relaxation frequency which is proportional to the ionic conductivity. It can also be seen that the ionic resistance of the electrolyte does not change upon oxygen partial pressure variations. The second feature at lower frequencies (<1 kHz) originates from the electrode.At oxygen partial pressures of 210 mbar (21% O2 = syn. air) the electrode impedance part has a semi-tear drop shape and for both samples it can be fitted to a finite Warburg element. For mixed conducting electrodes this is often an indication that transport of a charge carrier is rate-limiting. LSC is believed to show a metal-like electronic conductivity, therefore only the oxygen conductivity could be responsible for transport limitation. Additional effects including an ionic charge transfer resistance into YSZ or sample inhomogeneities may affect the spectrum shape and we do not necessarily conclude pure transport limitation, see also the interpretation of the impedance spectra of LSC thin films measured at such low temperatures in ref. 46. However, most probably the surface exchange resistance does not dominate the entire electrode resistance under these conditions. In order to truly investigate the influence of the LSC termination layers on the oxygen surface exchange kinetics, other oxygen partial pressures are therefore more adequate. A reduction of the oxygen partial pressure accelerates the oxygen transport through the LSC thin film, due to an increase of the oxygen vacancy concentration, and it simultaneously slows down the oxygen exchange kinetics. This can be observed in Fig. 11a and b, as the electrode part of the impedance spectra changes its shape to a semicircle for lower oxygen partial pressures. At an oxygen content of 0.1% it can be safely assumed that the surface exchange resistance dominates the overall electrode reaction and further investigation were done in this atmosphere. The impedance spectra at a normalized oxygen partial pressure (pO2) of 0.1% were again fitted to a parallel RC-element with R being the oxygen surface exchange resistance. Multiple samples were investigated for statistics. The obtained surface exchange resistances for differently treated samples annealed at 400 °C and 600 °C for 16 h are plotted in Fig. 12.
For the thin films annealed at 400 °C, Fig. 12a, a clear difference between the surface exchange resistance of as-deposited and H2O treated thin films is visible. In the beginning the oxygen exchange kinetics, represented by 1/Rsurface exchange, is promoted by ∼60% when removing the Sr-rich and Co-poor termination layer. On the contrary, the initial values of the thin films annealed at 600 °C, inset of Fig. 12b, do not indicate any difference between the films. The latter can be easily understood since prior to the start of the impedance measurements each sample was thermally equilibrated for 1 h in the corresponding atmosphere. Hence, the removed Sr-rich termination layer already reappeared before the impedance measurement started, cf. Section 3.4 and Fig. 13. These measurements are also an indication of the excellent reproducibility of our film surfaces with Rsurface exchange ≈ 0.6 Ω cm2 at 600 °C. At 400 °C, on the other hand, cations are considered to be immobile on the time scale of an hour as shown in Section 3.4. We can therefore measure the influence of a non-equilibrated termination layer on the surface exchange resistance.
 | ||
| Fig. 13 Cation composition of the termination layer measured by LEIS for as-deposited LSC and after different thermal and chemical treatments. | ||
The enhanced oxygen exchange kinetics observed for the non-equilibrated termination layer can have multiple reasons and is discussed based on the surface composition shown in Fig. 13. The SrO (or Sr(OH)2) termination layer that forms on top of the LSC could simply block the oxygen from approaching active sites that are important for the oxygen reduction reaction. Assuming active sites being proportional to the surface parts without Sr termination suggest an increase from 19% to 72% and this is even more than the 1.6 factor found for the enhancement of the oxygen exchange kinetics. This argumentation does not consider details of the mechanism. Active sites may be either related to the accessibility to oxygen vacancies for adsorption, dissociation and diffusion of oxygen47 or the possibility to approach B-site cations. Instead of the Sr decrease we may therefore consider the concentration increase of the other two cations, i.e. La and Co. Lanthanum is assumed to play only a role as a host atom that is substituted by Sr and does not take part in the oxygen reduction reaction. Cobalt, on the other hand, is known to facilitate the electronic conduction in LSC by constituting a conduction band via its 3d and oxygen 2p orbitals.48–50 Thus the importance of surface Co atoms for charge transfer is therefore very realistic.51 If any charge transfer from the Co to an oxygen surface species is rate determining for the oxygen reduction reaction, the increased Co content after H2O treatment could explain the improved surface exchange kinetics. Moreover, the kinetics change might also be not only stoichiometry related. Z. Cai and co-workers12 found a change of the Co oxidation state from Co2+ to Co3+ close to the Sr-rich surface of LSC using XPS and suggested a detrimental role of this valence change on the oxygen exchange kinetics.
Finally, the time dependence of the surface exchange resistance in Fig. 12 is discussed. At 600 °C, the degradation phenomenon was already shown for an as-deposited thin film in Section 3.3. Here we find on average a resistance increase by a factor of 6.7 after 15 hours of annealing. The degradation of the H2O treated thin film is very similar with a surface exchange resistances changed by a factor of 8.3 after 15 hours of annealing. These strong changes without much variation of the Sr coverage further question the existence of a simple relation between oxygen exchange kinetics and Sr surface coverage under very clean atmospheric conditions. The resistance increase at 400 °C is much less pronounced and amounts to a factor of 1.7 and 1.6 for as-deposited and H2O treated films. The slower degradation may simply be an effect of temperature but could also be influenced by the atmosphere. In some earlier unpublished work we observed that a lower oxygen partial pressure during annealing led to less degradation at the same annealing temperatures. For a clear mechanistic explanation of the degradation much further measurements are needed. However, one may speculate that the remaining Co concentration at the surface is most decisive. Degradation would then be caused by covering substantial parts of the still remaining small amounts of surface Co (cf.Fig. 6b). Hence, the most beneficial effect of the water treatment would be exposing more Co to the gas phase.
4. Conclusion
Surface sensitive measurements were performed by LEIS and time resolved ICP-MS to analyze the cation composition of La0.6Sr0.4CoO3−δ thin film electrodes. Results obtained by both methods agree qualitatively and quantitatively and provide a consistent picture of the surface termination composition and cation diffusion kinetics. For as-deposited LSC thin films a water-soluble Sr-rich and Co-poor termination layer was found. While the Co depletion is only observed in the termination layer, the Sr is enriched in the first 3 nm of LSC. The surface layer is removed by treating the sample in ultrapure water, but ca. 1 monolayer of SrO repeatedly forms again whenever the sample is annealed at or above 550 °C for 1 h. A Sr depletion in subsurface regions was not found, thus very fast Sr diffusion with only slight depletion in larger parts of the film are concluded. These experiments confirm that formation of the Sr-rich surface layer is an equilibrium property of LSC and that Sr diffusion does not limit its formation under these conditions. Impedance measurements at 400 °C revealed the detrimental effect of this surface layer on the oxygen surface exchange and suggest that higher Co concentration in the termination layer facilitate the oxygen exchange reaction. Further annealing of thin films with Sr-rich termination layer in poison-free atmosphere at 600 °C did not lead to any significant cation composition changes although the oxygen surface exchange kinetics continuously decreased.Acknowledgements
The authors gratefully acknowledge funding by Austrian Science Fund (FWF) projects P21960-N17 and W1243. JAK, TI, HT and JD also acknowledge support from the International Institute for Carbon Neutral Energy Research (wpi-I2CNER), funded by the World Premier Research Center Initiative of the Ministry of Education, Culture, Sports, Science and Technology. HT thanks the financial support from the Japanese Society for Promotion of Science (JSPS postdoctoral fellowship and Kakenhi Grant-in-Aid P13770).References
- S. J. Skinner, Int. J. Inorg. Mater., 2001, 3, 113–121 CrossRef CAS.
- S. Y. Istomin and E. V. Antipov, Russ. Chem. Rev., 2013, 82, 686 CrossRef PubMed.
- Q. Liu, C. Yang, X. Dong and F. Chen, Int. J. Hydrogen Energy, 2010, 35, 10039–10044 CrossRef CAS PubMed.
- G. Tsekouras, D. Neagu and J. T. S. Irvine, Energy Environ. Sci., 2013, 6, 256–266 CAS.
- J. W. Fergus, Sens. Actuators, B, 2007, 123, 1169–1179 CrossRef CAS PubMed.
- A. Rothschild, S. J. Litzelman, H. L. Tuller, W. Menesklou, T. Schneider and E. Ivers-Tiffée, Sens. Actuators, B, 2005, 108, 223–230 CrossRef CAS PubMed.
- F. S. Baumann, J. Fleig, G. Cristiani, B. Stuhlhofer, H.-U. Habermeier and J. Maier, J. Electrochem. Soc., 2007, 154, B931–B941 CrossRef CAS PubMed.
- C. Sun, R. Hui and J. Roller, J. Solid State Electrochem., 2010, 14, 1125–1144 CrossRef CAS.
- H. J. M. Bouwmeester, H. Kruidhof and A. J. Burggraaf, Solid State Ionics, 1994, 72, 185–194 CrossRef CAS.
- E. Bucher, W. Sitte, F. Klauser and E. Bertel, Solid State Ionics, 2012, 208, 43–51 CrossRef CAS PubMed.
- F. S. Baumann, J. Fleig, M. Konuma, U. Starke, H. Habermeier and J. Maier, J. Electrochem. Soc., 2005, 152, A2074–A2079 CrossRef CAS PubMed.
- Z. Cai, M. Kubicek, J. Fleig and B. Yildiz, Chem. Mater., 2012, 24, 1116–1127 CrossRef CAS.
- E. Mutoro, E. J. Crumlin, M. D. Biegalski, H. M. Christen and Y. Shao-Horn, Energy Environ. Sci., 2011, 4, 3689–3696 CAS.
- P. A. W. van der Heide, Surf. Interface Anal., 2002, 33, 414–425 CrossRef CAS PubMed.
- M. Kubicek, A. Limbeck, T. Fromling, H. Hutter and J. Fleig, J. Electrochem. Soc., 2011, 158, B727–B734 CrossRef CAS PubMed.
- C. R. Kreller, T. J. McDonald, S. B. Adler, E. J. Crumlin, E. Mutoro, S. J. Ahn, G. J. la O', Y. Shao-Horn, M. D. Biegalski, H. M. Christen, R. R. Chater and J. A. Kilner, J. Electrochem. Soc., 2013, 160, F931–F942 CrossRef CAS PubMed.
- J. Druce, H. Téllez, T. Ishihara and J. Kilner, Faraday Discuss., 2015 10.1039/c5fd00028a , accepted.
- A.-K. Huber, M. Falk, M. Rohnke, B. Luerssen, M. Amati, L. Gregoratti, D. Hesse and J. Janek, J. Catal., 2012, 294, 79–88 CrossRef CAS PubMed.
- W. Wang and S. P. Jiang, Solid State Ionics, 2006, 177, 1361–1369 CrossRef CAS PubMed.
- Y. Chen, W. Jung, Z. Cai, J. J. Kim, H. L. Tuller and B. Yildiz, Energy Environ. Sci., 2012, 5, 7979–7988 CAS.
- W. Jung and H. L. Tuller, Energy Environ. Sci., 2012, 5, 5370–5378 CAS.
- Y.-M. Kim, X. Chen, S. P. Jiang and J. Bae, J. Electrochem. Soc., 2011, 159, B185–B194 CrossRef PubMed.
- E. Bucher, C. Gspan, F. Hofer and W. Sitte, Solid State Ionics, 2013, 238, 15–23 CrossRef CAS PubMed.
- Y. Yu, H. Luo, D. Cetin, X. Lin, K. Ludwig, U. Pal, S. Gopalan and S. Basu, Appl. Surf. Sci., 2014, 323, 71–77 CrossRef CAS PubMed.
- E. Bucher, C. Gspan, F. Hofer and W. Sitte, Solid State Ionics, 2013, 230, 7–11 CrossRef CAS PubMed.
- E. Bucher, M. Yang and W. Sitte, J. Electrochem. Soc., 2012, 159, B592–B596 CrossRef CAS PubMed.
- G. M. Rupp, A. Limbeck, M. Kubicek, A. Penn, M. Stoger-Pollach, G. Friedbacher and J. Fleig, J. Mater. Chem. A, 2014, 2, 7099–7108 CAS.
- J. Januschewsky, M. Ahrens, A. K. Opitz, F. Kubel and J. Fleig, Adv. Funct. Mater., 2009, 19, 3151–3156 CrossRef CAS PubMed.
- F. S. Baumann, J. Maier and J. Fleig, Solid State Ionics, 2008, 179, 1198–1204 CrossRef CAS PubMed.
- H. Fukunaga, M. Koyama, N. Takahashi, C. Wen and K. Yamada, Solid State Ionics, 2000, 132, 279–285 CrossRef CAS.
- J. Druce, H. Tellez, M. Burriel, M. D. Sharp, L. J. Fawcett, S. N. Cook, D. S. McPhail, T. Ishihara, H. H. Brongersma and J. A. Kilner, Energy Environ. Sci., 2014, 7, 3593–3599 CAS.
- J. Druce, T. Ishihara and J. Kilner, Solid State Ionics, 2014, 262, 893–896 CrossRef CAS PubMed.
- H. Téllez, J. Druce, Y.-W. Ju, J. Kilner and T. Ishihara, Int. J. Hydrogen Energy, 2014, 39, 20856–20863 CrossRef PubMed.
- M. P. Pechini, Method of preparing lead and alkaline earth titanates and niobates and coating method using the same to form a capacitor, Patent No.: US 3330697 A, S. E. Co, USA, 1967 Search PubMed.
- M. de Ridder, R. G. van Welzenis and H. H. Brongersma, Surf. Interface Anal., 2002, 33, 309–317 CrossRef CAS PubMed.
- H. Ullmann, N. Trofimenko, F. Tietz, D. Stöver and A. Ahmad-Khanlou, Solid State Ionics, 2000, 138, 79–90 CrossRef CAS.
- A. J. Jacobson, Chem. Mater., 2009, 22, 660–674 CrossRef.
- P. Plonczak, A. Bieberle-Hütter, M. Søgaard, T. Ryll, J. Martynczuk, P. V. Hendriksen and L. J. Gauckler, Adv. Funct. Mater., 2011, 21, 2764–2775 CrossRef CAS PubMed.
- M. Kubicek, G. M. Rupp, S. Huber, A. Penn, A. K. Opitz, J. Bernardi, M. Stoger-Pollach, H. Hutter and J. Fleig, Phys. Chem. Chem. Phys., 2014, 16, 2715–2726 RSC.
- J. H. Lee, G. Luo, I. C. Tung, S. H. Chang, Z. Luo, M. Malshe, M. Gadre, A. Bhattacharya, S. M. Nakhmanson, J. A. Eastman, H. Hong, J. Jellinek, D. Morgan, D. D. Fong and J. W. Freeland, Nat. Mater., 2014, 13, 879–883 CrossRef CAS PubMed.
- D. E. E. Deacon-Smith, D. O. Scanlon, C. R. A. Catlow, A. A. Sokol and S. M. Woodley, Adv. Mater., 2014, 26, 7252–7256 CrossRef CAS PubMed.
- E. Bucher, A. Egger, G. B. Caraman and W. Sitte, J. Electrochem. Soc., 2008, 155, B1218–B1224 CrossRef CAS PubMed.
- A. Berenov, A. Atkinson, J. Kilner, M. Ananyev, V. Eremin, N. Porotnikova, A. Farlenkov, E. Kurumchin, H. J. M. Bouwmeester, E. Bucher and W. Sitte, Solid State Ionics, 2014, 268, 102–109 CrossRef CAS PubMed.
- F. S. Baumann, J. Fleig, H. Habermeier and J. Maier, Solid State Ionics, 2006, 177, 1071–1081 CrossRef CAS PubMed.
- J. Jamnik and J. Maier, Phys. Chem. Chem. Phys., 2001, 3, 1668–1678 RSC.
- M. Kubicek, T. M. Huber, A. Welzl, A. Penn, G. M. Rupp, J. Bernardi, M. Stöger-Pollach, H. Hutter and J. Fleig, Solid State Ionics, 2014, 256, 38–44 CrossRef CAS PubMed.
- L. Wang, R. Merkle, Y. A. Mastrikov, E. A. Kotomin and J. Maier, J. Mater. Res., 2012, 27, 2000–2008 CrossRef CAS.
- P. M. Raccah and J. B. Goodenough, Phys. Rev., 1967, 155, 932–943 CrossRef CAS.
- M. Søgaard, P. V. Hendriksen, M. Mogensen, F. W. Poulsen and E. Skou, Solid State Ionics, 2006, 177, 3285–3296 CrossRef PubMed.
- M. Lankhorst and J. Ten Elshof, J. Solid State Chem., 1997, 130, 302–310 CrossRef CAS.
- W. Jung and H. L. Tuller, ECS Trans., 2011, 35, 2129–2136 CAS.
| This journal is © The Royal Society of Chemistry 2015 |

