 Open Access Article
Creative Commons Attribution 3.0 Unported Licence
Boosting the oxygen reduction reaction mechanisms in IT-SOFC cathodes by catalytic functionalization†
L.
Navarrete
,
C.
Solís
and
J. M.
Serra
*
Instituto de Teconología Química, Avda/ Los Naranjos s/n, 46022, Valencia, Spain. E-mail: jmserra@itq.upv.es; Fax: +34 963877809; Tel: +34 963879448
First published on 14th July 2015
Abstract
A robust LSM-GDC composite was used as a backbone electrode for the infiltration of different catalysts, dispersed as oxide nanoparticles after firing. Catalyst candidates were screened using symmetric cells supported on the GDC electrolyte. Among the tested catalysts, praseodymium infiltration exhibited an outstanding and highly stable promotion effect of the oxygen reduction reaction. Impedance spectroscopy modelling provided insight into the nature of the distinct mechanisms limiting the cathode performance. The Pr-promotion in cathodes resulted in a fivefold rise in the power density peak when tested on a fully assembled anode-supported fuel cell.
The reduction of the operation temperature of conventional SOFCs (Solid Oxide Fuel Cells) is very challenging but will be very beneficial to avoid the use of expensive building materials and to enlarge the stack lifetime. LSM (La0.8Sr0.2MnO3−δ) is still the material of choice due to its stability, electronic conductivity and compatibility with different materials such as yttria stabilized zirconia (YSZ), doped ceria or perovskites. However, the optimal operation of this cathode is reached at high temperatures (above 800 °C).1 In order to reduce the operation temperature, it is necessary to enlarge the three phase boundary (TPB) length, since LSM is an electronic conductor and the TPB is limited to the electrode–electrolyte region exposed to the gas.2 For this purpose, YSZ is industrially preferred at high temperature. GDC (Ce0.8Gd0.2O2−δ) is a superior ionic conductor at intermediate temperatures (<700 °C), compatible with LSM and mixed with LSM can favour the presence of percolative pathways for both electrons and ions.3–5 This strategy will increase the TPB to the whole electrode thickness and improve the cathode performance at lower temperatures. However, the performance of these composite cathodes is limited by surface related processes, such as oxygen dissociation and adsorption O2(g) → 2Oad and Oad + e− → O−ad.3,6,7 Thus, the use of a suitable catalyst is decisive for an efficient SOFC cathode development. In this work, Pr, Sm, Ce, Zr, Ba and Co oxides are brought onto the cathode and act as oxygen reduction catalysts due to their redox character and particular adsorption properties. In order to preserve the nanoscale size of the catalysts and good dispersion,8 the infiltration was performed on sintered and well-consolidated LSM-GDC electrodes, instead of incorporating them into the LSM-GDC cathode inks prior to electrode firing.9,10 Different 2 M solutions (ethanol–water) with adjusted surface tension were prepared with the different Co, Ba, Ce, Pr, Sm and Zr precursors. The solution was dropped onto the electrode, and infiltration was carried out by capillarity.
Symmetrical cells were prepared by using cathodes based on LSM-GDC composite backbones. A 50/50 % wt ratio was selected since it has been reported as the optimum for SOFC LSM-based cathode purposes.11 GDC powder was synthesized by a co-precipitation method, whereas LSM powder was purchased from Fuel Cell Materials (USA). Screen printing inks made of LSM-GDC composite cathodes were prepared by three roll milling LSM powder, GDC and a 6wt% ethylcellulose–terpineol solution in a 1![[thin space (1/6-em)]](https://www.rsc.org/images/entities/char_2009.gif) :
:![[thin space (1/6-em)]](https://www.rsc.org/images/entities/char_2009.gif) 1
1![[thin space (1/6-em)]](https://www.rsc.org/images/entities/char_2009.gif) :
:![[thin space (1/6-em)]](https://www.rsc.org/images/entities/char_2009.gif) 2 weight ratio.
2 weight ratio.
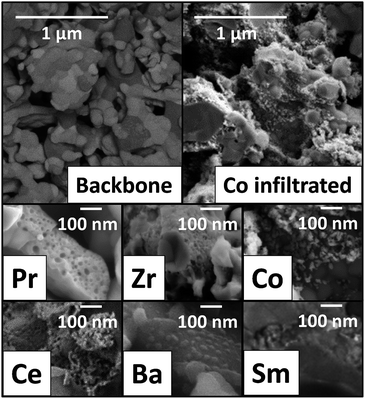
This ink was applied on both sides of fully dense GDC electrolytes. GDC electrolyte powder was provided by Treibacher Industrie AG. The final thickness of the electrolytes was ≈650 μm and the disc diameter was 15 mm. Porous electrodes (9 mm of diameter) were obtained after calcining screen-printed layers at 1150 °C for 2 h. A top screen-printed gold mesh was further applied on the LSM-GDC electrode in order to ensure proper current collection. Field Emission Scanning Electron Microscopy (FESEM) images of the symmetrical cells cross-section after electrochemical impedance spectroscopy (EIS) testing are shown in Fig. 1. FESEM images reveal that the electrode porosity appears to be adequate for gas diffusion. Furthermore, the whole electrode surface was covered (Fig. 1) with different infiltrated oxide catalysts, as inferred from XRD analysis (ESI Fig. S1†), and the particle sizes range from 20 to 40 nm. The infiltrated particles are spherical, except for Pr which presents a needle-like morphology. The nanocatalyst size and morphology are retained after the EIS test (ESI Fig. S2 and S7†) and no coarsening is visible, which is an important factor in the stability of the electrode operation.
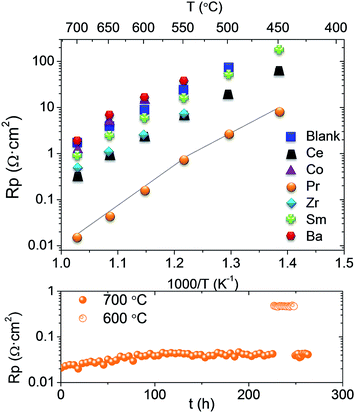
The electrochemical performance of the different promoted electrodes was studied by means of EIS on the corresponding infiltrated symmetrical cells, which was compared with that of the LSM-GDC pristine electrode. As can be inferred from Fig. 2, every nanocatalyst enhances the cell performance of the pristine sample, except Co and Ba. Pr exhibits exceptional promotion behaviour, i.e., the electrode polarization resistance (Rp) diminishes by two orders of magnitude with regard to that of the pristine electrode. Other metal oxides show beneficial effects, namely, Ce, Zr and Sm infiltration leads to 10, 5 and 2 times smaller Rp values, respectively. The derived activation energy (Ea) for all samples (Table 1) is very similar [1.14–1.22 eV], except for Co, which exhibits significantly higher Ea. Besides, the Pr electrode shows a two-fold Arrhenius behaviour: a higher Ea value was obtained at high temperatures (700–550 °C); and at low temperature (550–450 °C) an Ea value within the quoted range observed for most infiltrated electrodes was obtained. Assuming that the backbone is identical for all samples, the changes in Rp are uniquely ascribed to the catalytic promotion. The particular Ea observed for the Pr electrode at higher temperatures evidences a change in its rate limiting step. Due to the high catalytic activity, the nature of the limiting step is presumably not related to the surface oxygen reduction process. In addition, the controlled phase transition of this oxide has been widely investigated.12,13 Pr oxide undergoes a phase transition from the ordered PrO1.833 at room temperature to disordered PrO1.83 at increasing temperatures, which is reflected in the electrical conductivity behaviour.14–16 It seems that the variation of Ea in the Rp coincides with this phase transition.
 | ||
| Fig. 2 Top; Arrhenius plot of the Rp obtained from the impedance measurements for the symmetrical cells in air and bottom; polarization resistance of LSM_GDC infiltrated by Pr in the stability test. | ||
| Infiltrated | E a (eV) | Degradation rate 700 °C (Ω cm−2 h−1) |
|---|---|---|
| Blank | 1.18 | 5.87 × 10⁻⁴ |
| Ce | 1.14 | 2.00 × 10⁻³ |
| Co | 1.79 | 7.68 × 10⁻³ |
| Pr | 1.86 | 1.95 × 10⁻⁴ (0–100 h) |
| 1.20 | −5.29 × 10⁻⁶ (100–270 h) | |
| Zr | 1.20 | −3.42 × 10⁻⁴ |
| Sm | 1.22 | 1.41 × 10⁻³ |
| Ba | 1.14 | 1.38 × 10⁻² |
The stability of the infiltrated cathodes was tested at 700 °C for 1200 minutes, and the degradation rate is listed in Table 1. A very slight change in the Rp value is obtained for all samples, which corroborates the stability of the infiltrated catalyst in the measured time. Exceptionally, Zr improves the cell performance with time, i.e. Rp decreases, which is assigned to transient activation or equilibration of the catalyst. A longer stability test was performed for the Pr electrode and it is also shown in Table 1. Two different behaviours can be distinguished (Fig. 2 bottom). First, there is an initial degradation or equilibration, but after 100 h of operation it disappears, as can be deduced from the almost constant Rp up to 275 h. In general, as concluded from the degradation rate values, all the catalysts show a first equilibration (activation and/or degradation) period until they reach their final state under the operation conditions, after which Rp remains constant. Furthermore, the reproducibility of the results obtained was assessed by measuring three different cells infiltrated with Pr, obtaining practically the same electrochemical results (ESI Fig. S3†).
In order to discern the different contributions of the resistance and the associated processes affected by the infiltration, the EIS measurements were fitted to a double R||CPE equivalent circuit, except for Ba that required a three R||CPE circuit (Table 2). The pristine (blank) electrode shows two contributions, i.e., the highest one at medium frequencies (MF, 0.7–7 kHz), which limits the performance, and another one at high frequencies (HF, 8–220 kHz). MF contribution has been associated with the coupled dissociative adsorption, transfer of species at TPB and surface diffusion processes.6,17,18 MF contributions are diminished through the infiltration with Pr, Ce, Zr and Sm catalysts, in this order from the highest to the lowest reached Rp magnitude. This effect is unambiguously assigned to the enhancement of the aforementioned surface related processes. On the other hand, HF processes become limited in the electrode performance as the MF processes are progressively ameliorated thanks to the catalytic promotion. However, Ba and Co-infiltrated electrodes present higher MF contributions than that of the blank electrode which is directly attributed to the inhibition of surface related processes.
| Infiltration oxide | t | RHF (Ω cm2) | RMF (Ω cm2) | RLF (Ω cm2) | fHF (Hz) | fMF (Hz) | fLF (Hz) |
|---|---|---|---|---|---|---|---|
| Blank | 1 | 0.91 | 1.07 | — | 8.40 × 10³ | 742 | |
| 2 | 0.90 | 1.08 | — | 8.61 × 10³ | 740 | ||
| Ce | 1 | 0.36 | 0.12 | — | 3.23 × 10⁴ | 1814 | |
| 2 | 0.41 | 0.16 | — | 2.82 × 10⁴ | 1307 | ||
| Co | 1 | 0.53 | 1.05 | — | 1.44 × 10⁵ | 266 | |
| 2 | 0.56 | 1.37 | — | 1.31 × 10⁵ | 185 | ||
| Pr | 1 | 0.05 | — | 4.45 × 10⁻³ | 3.84 × 10⁴ | 2 | |
| 2 | 0.07 | — | 5.58 × 10⁻³ | 3.07 × 10⁴ | 2 | ||
| Zr | 1 | 0.41 | 0.31 | — | 2.61 × 10⁴ | 1050 | |
| 2 | 0.40 | 0.28 | — | 2.21 × 10⁴ | 1011 | ||
| Sm | 1 | 0.75 | 0.35 | — | 9.69 × 10³ | 1623 | |
| 2 | 0.70 | 0.46 | — | 9.64 × 10³ | 1230 | ||
| Ba | 1 | 0.43 | 1.43 | 3.38 × 10⁻¹ | 1.78 × 10⁵ | 6494 | 17 |
| 2 | 0.60 | 1.54 | 7.80 × 10⁻¹ | 2.21 × 10⁵ | 5857 | 15 |
In addition, the stability of the different contributions was checked (Table 2). The MF resistance increases with operation time (t2 = 1200 min), except for Zr that diminishes. Moreover, the frequency range associated with these surface processes is shifted towards lower values whereas the HF range remains more or less unaltered for all samples. Finally, after 1200 min, the dominant mechanism is still associated with HF processes, for Pr, Ce, Zr and Sm, which agrees with the absence of catalytic surface deterioration (catalyst coarsening) revealed by SEM (Fig. S2†).
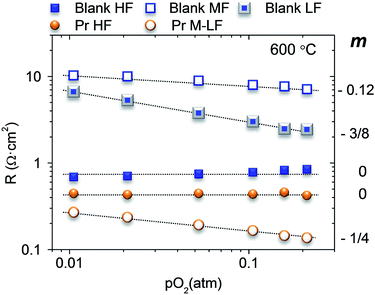
To shed further light into the nature of the limiting steps in the oxygen reduction reaction (ORR), the best electrode (Pr infiltrated) and the blank sample were tested at different pO2. The blank sample presents three arc contributions at 600 °C, HF, MF and LF, while the Pr sample has only two contributions, HF and M–LF (medium–low frequency, 300–1500 Hz). Each contribution can be related to the oxygen partial pressure by the equation R ∝ PO2−mi and m clarifies the limiting step in the ORR:19,20Fig. 3 depicts the modelled resistances for the different contributions.
 | ||
| Fig. 3 Fitting results of the polarization resistances for high (HF), medium (MF), medium–low (M–LF) and low frequencies (LF) at 600 °C for different pO2 and m values for the different frequencies. | ||
The non-infiltrated electrode shows a pO2 independent (m = 0) HF contribution, which can be assigned to the ionic transport of the composite. The limiting processes associated with MF and LF slightly increases when decreasing the pO2 with m = 0.12 and 3/8, respectively. The value of 3/8 is related to the partial reduction of the atomic oxygen (Oad + e− → Oad−). However, the m value 0.12 observed for MF processes origins from the combination of two different mechanisms, the transport of the partially reduced atomic oxygen to the TPB (Oad− → OTPB−) m = 1/4, and the total reduction of oxygen (OTPB− + e− → OTPB2−) with m = 0.
The Pr infiltration decreases mainly the resistance at L–M frequencies and slightly the HF associated resistance, which in this case limits cathode performance. This HF contribution is also pO2 independent as it corresponds to the limiting ionic conductivity. The slight decrease of the resistance can be assigned to Pr oxide properties that favour the surface diffusion of oxygen species to be transported in contrast to the blank sample. Furthermore, LF processes can be assigned to the transport of partially reduced atomic oxygen to the TPB (m = 1/4).20,21
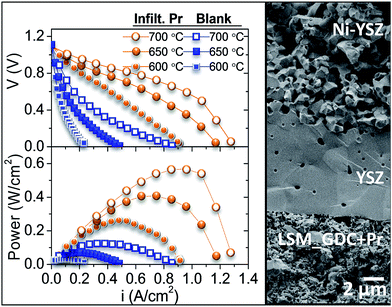
Finally, to confirm the results obtained by using symmetrical cells, the best cathode and the blank were tested as a fully assembled fuel cell. For this purpose, an anode-supported cell based on the Ni-YSZ anode and 8 μm-thick YSZ electrolyte was used (Fig. 4). The maximum power density obtained at 700 °C, by using air as oxidant feed and wet hydrogen as fuel, is five times higher for the Pr-infiltrated cathode, reaching a peak value of 567 W cm−2 at 700 °C (Fig. 4).
As both samples were identical, except for the infiltration, an EIS measurement was performed in complete fuel cell mode near the OCV at 700 °C. Table 3 shows the results of the fitting with the equivalent circuit mentioned above (three R||CPE elements). All resistances decrease with the Pr infiltration; all processes increase the capacitance and change the characteristic frequency to slower contributions. Assuming that the contributions related to the electrolyte and electrode remained constant for both measurements, the cell improvement due to the Pr infiltration can only be related to the enhancement of the ORR. As explained for the symmetrical cell measurements, the blank cell is limited by MF surface related processes, and this behaviour is maintained for the fully assembled fuel cell. MF resistance decreases by more than 80% with Pr infiltration, where dissociation and oxygen adsorption processes are improved. This reduction of the different contributions is responsible for the enhancement of the power density reached for the infiltrated SOFC.
| Frequency range | LSM-GDC/YSZ/Ni-YSZ | LSM-GDC + Pr/YSZ/Ni-YSZ | ||||
|---|---|---|---|---|---|---|
| R (Ω cm2) | C (F cm−2) | f (Hz) | R (Ω cm2) | C (F cm−2) | f (Hz) | |
| HF | 0.17 | 2.24 × 10⁻⁵ | 4.31 × 10⁴ | 0.07 | 2.89 × 10⁻⁴ | 7.59 × 10³ |
| MF | 2.57 | 3.10 × 10⁻⁵ | 2005 | 0.47 | 8.75 × 10⁻⁴ | 384 |
| LF | 0.57 | 1.09 × 10⁻³ | 256 | 0.07 | 3.75 × 10⁻¹ | 6 |
Conclusions
Different infiltrations in a robust LSM-GDC backbone electrode were performed, some catalysts such as Sm, Zr, Ce and Pr improve the electrode performance by the reduction of the resistance at medium frequency, associated with surface processes. In contrast, Co and Ba catalysts worsen the cell performance by increasing the resistance at medium frequencies in the temperature operation range.The stability of the operation with time for different activated cathodes was systematically studied. At first, there is a slight increase in the polarization resistance with time until reaching a constant value. The Zr catalyst is a particular case, since the polarization resistance decreases with time. The modelling results as a function of pO2 revealed that the rate-limiting mechanism in the ORR is the surface transport of oxygen species towards the TPB.
Finally, the best cathode was tested in a fully assembled anode-supported fuel cell achieving a 5-fold improvement of the power density. These results demonstrate the applicability of the infiltration for the cathode performance with the resulting improvement of the power density in the fully assembled fuel cell.
Acknowledgements
This work was financially supported by Spanish Government; ENE2011-24761 and SEV-2012-0267. Electron Microscopy Service of the UPV is also acknowledged and anode supported cells were kindly supplied by Forschungszentrum Jülich.References
- S. P. Jiang, J. Mater. Sci., 2008, 43, 6799–6833 CrossRef CAS.
- S. B. Adler, Chem. Rev., 2004, 104, 4791–4843 CrossRef CAS.
- E. P. Murray, T. Tsai and S. A. Barnett, Solid State Ionics, 1998, 110, 235–243 CrossRef CAS.
- M. J. Jorgensen, S. Primdahl, C. Bagger and M. Mogensen, Solid State Ionics, 2001, 139, 1–11 CrossRef CAS.
- M. Balaguer, V. B. Vert, L. Navarrete and J. M. Serra, J. Power Sources, 2013, 223, 214–220 CrossRef CAS PubMed.
- M. J. Jorgensen and M. Mogensen, J. Electrochem. Soc., 2001, 148, A433–A442 CrossRef CAS PubMed.
- E. P. Murray and S. A. Barnett, Solid State Ionics, 2001, 143, 265–273 CrossRef.
- C. Solis, M. Balaguer, F. Bozza, N. Bonanos and J. M. Serra, Appl. Catal., B, 2014, 147, 203–207 CrossRef CAS PubMed.
- S. P. Jiang, Mater. Sci. Eng., A, 2006, 418, 199–210 CrossRef PubMed.
- T. Z. Sholklapper, C. P. Jacobson, S. J. Visco and L. C. Dejonghe, Fuel Cells, 2008, 8, 303–312 CrossRef CAS PubMed.
- S. P. Jiang and W. Wang, Solid State Ionics, 2005, 176, 1351–1357 CrossRef CAS PubMed.
- B. G. Hyde, D. J. M. Bevan and L. Eyring, Philos. Trans. R. Soc., A, 1964, 2, 227 Search PubMed.
- Rare Earth Research, ed. B. G. Hyde, D. J. M. Bevan and L. Eyring, New York, 1966 Search PubMed.
- L. Eyring and N. C. Baenziger, J. Appl. Phys., 1962, 33, 209 CrossRef PubMed.
- G. V. Chandrashekhar, P. N. Mehrotra, G. V. Subba Rao, E. C. Subbarao and C. N. R. Rao, Trans. Faraday Soc., 1967, 63, 1295–1301 Search PubMed.
- R. G. Biswas, M. Rajendran, G. S. Walker, E. Williams and A. K. Bhattacharya, J. Mater. Sci., 1998, 33, 3001–3007 CrossRef CAS.
- S. Z. Wang, Y. Jiang, Y. H. Zhang, J. W. Yan and W. Z. Li, Solid State Ionics, 1998, 113, 291–303 CrossRef.
- F. H. vanHeuveln and H. J. M. Bouwmeester, J. Electrochem. Soc., 1997, 144, 134–140 CrossRef CAS PubMed.
- M. J. Escudero, A. Aguadero, J. A. Alonso and L. Daza, J. Electroanal. Chem., 2007, 611, 107–116 CrossRef CAS PubMed.
- R. R. Peng, T. Z. Wu, W. Liu, X. Q. Liu and G. Y. Meng, J. Mater. Chem., 2010, 20, 6218–6225 RSC.
- Y. Takeda, R. Kanno, M. Noda, Y. Tomida and O. Yamamoto, J. Electrochem. Soc., 1987, 134, 2656–2661 CrossRef CAS PubMed.
Footnote |
| † Electronic supplementary information (ESI) available. See DOI: 10.1039/c5ta05187h |
| This journal is © The Royal Society of Chemistry 2015 |


