 Open Access Article
Creative Commons Attribution 3.0 Unported Licence
3D Si/C particulate nanocomposites internally wired with graphene networks for high energy and stable batteries†
Jaegyeong
Kim
a,
Changil
Oh
a,
Changju
Chae
ab,
Dae-Hoon
Yeom
a,
Jaeho
Choi
a,
Nahyeon
Kim
a,
Eun-Suok
Oh
c and
Jung Kyoo
Lee
*a
aDepartment of Chemical Engineering, Dong-A University, Busan 604-714, Republic of Korea. E-mail: jklee88@dau.ac.kr; Fax: +82-51-200-7728; Tel: +82-51-200-7718
bDivision of Advanced Materials, Korea Research Institute of Chemical Technology (KRICT), Daejeon 305-600, Republic of Korea
cSchool of Chemical Engineering & Bioengineering, University of Ulsan, Ulsan 680-749, Republic of Korea
First published on 3rd August 2015
Abstract
It is challenging to design silicon anodes exhibiting stable cycling behavior, high volumetric and specific capacity, and low volume expansion for Li-based batteries. Herein, we designed Si/C-IWGN composites (Si/C composites internally wired with graphene networks). For this purpose, we used simple aqueous sol–gel systems consisting of varying amounts of silicon nanoparticles, resorcinol–formaldehyde, and graphene oxide. We found that a small amount of graphene (1–10 wt%) in Si/C-IWGNs efficiently stabilized their cycling behavior. The enhanced cycling stability of Si/C-IWGNs could be ascribed to the following facts: (1) ideally dispersed graphene networks were formed in the composites, (2) these graphene networks also created enough void spaces for silicon to expand and contract with the electrode thickness increase comparable to that of graphite. Furthermore, properly designed Si/C-IWGNs exhibited a high volumetric capacity of ∼141% greater than that of commercial graphite. Finally, a hybrid sample, Si–Gr, consisting of a high capacity Si/C-IWGN and graphite was prepared to demonstrate a hybrid strategy for a reliable and cost-effective anode with a capacity level required for high-energy Li-ion cells. The Si–Gr hybrid exhibited not only high capacity (800–900 mA h g−1 at 100 mA g−1) but also a high electrode volumetric capacity of 161% greater than that of graphite.
1. Introduction
Energy storage devices with high energy density are in great demand as they have widespread industrial applications.1–4 Silicon is an attractive anode material not only for boosting the energy density of current Li-ion batteries but for the replacement of Li metal anodes in the newly emerging battery systems such as Li–air and Li–S. This is because silicon has the highest lithium storage capacity among known elements, its capacity is closest to that of metallic lithium, and it has low voltage for charging.5–13However, it is quite challenging to devise a non-conducting silicon anode having stable cycling behavior at a practical level of electrode loading. In this silicon anode, electrode pulverization is caused by huge volume expansions (∼300%).6,7 Moreover, the instability of the solid electrolyte interface (SEI) layer leads to poor coulombic efficiency repeatedly triggered by lithium alloying and de-alloying reactions.5,14–18 Apart from the life cycle issue, volume expansion of the electrode is one of the critical factors considered while designing commercial batteries to avoid cell failure. Nevertheless, it is quite challenging to design high capacity silicon-based composites, whose volume expansion level is more or less similar to that of the latest graphitic carbon anode. In addition, the design and synthetic process should be scalable with low-cost materials for silicon-based composites to become an alternative to graphitic carbon.
Recently, researchers have made remarkable progress in addressing the above issues associated with silicon. They have devised strategic material designs, which are effective in accommodating mechanical stresses in such a manner that the electrical integrity of the electrode is well maintained to deliver hundreds of stable cycles.16,17,19–27 For mitigating the volume expansion problems, Si-based composites have been designed by two representative synthetic approaches. In the first approach, researchers have introduced an empty space of nano-scale between silicon and the conducting carbon matrix16,19–22 using sacrificial templates. The second approach involves the use of porous silicon structures.23,24,26,28,29 Although these pioneering approaches are highly inspiring, they are also associated with different issues: the reduced electrode packing density leads to low volumetric energy density in the battery. Moreover, these approaches involve expensive processes, such as chemical vapor deposition of silicon or carbon, which cannot be transformed into commercially viable strategies. Furthermore, these complicated multi-step approaches involve the use of toxic chemicals for generating porous structures in either silicon or carbon matrix, thereby limiting their commercial use.
To tackle the above issues associated with silicon, graphene, which is a single-atom-thick layer of sp2 hybridized carbon in a two-dimensional (2D) format, has been effectively used as an attractive supporting material in devising high-storage capacity composites of silicon.30–38 Graphene has many appealing properties such as excellent electrical conductivity, superior mechanical and chemical properties, and extremely high aspect ratio.39–44 Many other examples of advanced graphene-based composites have also been reported in the literature. For example, a small amount of graphene sheets is extremely effective as conductive fillers in polystyrene–graphene composites, because they have the lowest percolation value (0.1 vol%).41,42 Furthermore, the graphene–silica composite film (2–4 wt% of graphene) is a transparent conductor with enhanced conductivity.39 This is because graphene sheets are well-dispersed in these composites. However, for using graphene-based composites for lithium-ion batteries, we need to produce highly condensed composites of micro-sized particle-like materials for these composites to be easily compatible with the process of commercial electrode fabrication at high packing density. Moreover, the synthetic process should be easily scalable.
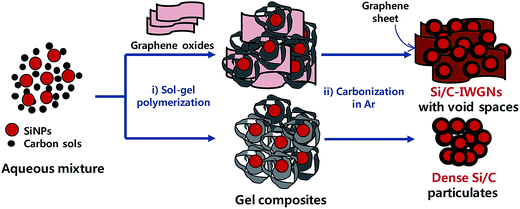
In this study, we have proposed that a sol–gel process can serve as a facile platform for composite materials of high lithium storage capacity. These composite materials consist of silicon nanoparticles (SiNPs) coated with carbon, a small graphene network interconnecting these nanoparticles to form condensed micro-sized particles, and a large fraction of void spaces between nanoparticles and graphene networks in these composites. Since, Si/C composites are internally wired with graphene networks, they are denoted as Si/C-IWGNs hereafter. The Si/C-IWGN samples were simply prepared by carbonizing the composite gels formed in aqueous mixtures consisting of SiNPs and resorcinol (R)–formaldehyde (F) as the carbon precursor and a small amount of graphene oxide (GO) in one-pot reactions as shown in Scheme 1. Various Si/C-IWGN samples were prepared with different contents of SiNPs (40 or 50 wt%) and graphene (1, 5 and 10 wt%). Two types of gelation catalysts (C), Na2CO3 or NH4OH, with different concentrations (R/C ratio = 100–500 in molar) were used for forming composite gels. Various electrochemical responses of Si/C-IWGNs, such as cycling stability, volumetric as well as specific capacity, coulombic efficiency, and electrode thickness increase, are thoroughly compared with those of the following reference samples: (1) control composites, Si/C composites, which were prepared without GO addition in the gel formation process in Scheme 1 and (2) commercial graphite. Finally, we have demonstrated a hybrid strategy to develop a reliable and low-cost anode material consisting of mixtures of high capacity Si/C-IWGNs and commercial graphite.
2. Experimental
2.1. Preparation of Si/C-IWGN and Si/C electrode materials
To prepare Si/C-IWGN samples, GO was prepared by a modified Hummers method32,45 using commercial flakes of graphite provided by Asbury Carbons (230U Grade, High Carbon Natural Graphite 99+). Then, GO was diluted and an aqueous dispersion (0.6 wt%) was prepared in deionized (DI) water through ultra-sonication. In Table 1, we have summarized the details of the compositions used in the preparation of Si/C-IWGN and reference Si/C composites.| Samples | Gel compositions, g | Gelation cat., mL | Composite contentsc, wt% | ||||||
|---|---|---|---|---|---|---|---|---|---|
| SiNPs | R/Fa | GOb | H2O | 0.2 M Na2CO3 (R/C molar) | 0.5 wt% NH4OH (R/C molar) | Si | C | GSd | |
| a Resorcinol/formaldehyde. b Graphene oxide. c Contents of Si and C (including GS) were determined from TGA profiles in Fig. 4 and S4. d Graphene sheets. | |||||||||
| Si/C-1 | 0.28 | 0.66/0.40 | — | 22.3 | 0.6 (50) | — | 46.3 | 56.0 | 0.0 |
| Si/C-IWGN-1 | 0.28 | 0.65/0.39 | 0.02 | 23.2 | 0.6 (50) | — | 45.9 | 53.1 | 1.0 |
| Si/C-IWGN-2 | 0.35 | 0.76/0.47 | 0.10 | 27.1 | 0.7 (50) | — | 46.5 | 48.5 | 5.0 |
| Si/C-IWGN-3 | 0.40 | 0.79/0.51 | 0.25 | 28.4 | 0.7 (50) | — | 47.1 | 42.9 | 10.0 |
| Si/C-2 | 0.35 | 0.82/0.50 | — | 21.0 | — | 0.03 (500) | 45.7 | 54.0 | 0.0 |
| Si/C-3 | 0.35 | 0.55/0.33 | — | 14.1 | — | 0.02 (500) | 52.2 | 47.8 | 0.0 |
| Si/C-IWGN-4 | 0.35 | 0.81/0.49 | 0.02 | 20.8 | — | 0.16 (100) | 44.4 | 54.6 | 1.0 |
| Si/C-IWGN-5 | 0.35 | 0.81/0.49 | 0.02 | 20.6 | — | 0.03 (500) | 35.0 | 64.0 | 1.0 |
| Si/C-IWGN-6 | 0.35 | 0.54/0.32 | 0.02 | 20.3 | — | 0.10 (100) | 52.9 | 46.1 | 1.0 |
To prepare Si/C-IWGN samples, we dispersed SiNPs (50–100 nm in diameter, KCC Corp. Ltd, Korea) in DI water in a vial through sonication. To this dispersion, we added a specific amount of GO solution. Then, this mixture was again subjected to sonication to obtain a homogeneous dispersion. To the mixture, we added resorcinol (R) and formaldehyde (F), which were used as carbon precursors.46 Finally, a gelation catalyst (C) (Na2CO3 or NH4OH) was added to the dispersion and it was stirred vigorously. The resorcinol/catalyst (R/C) molar ratio was varied in the range of 50–500. The mixture was stirred for 1 h at room temperature. Then, it was heated to 80 °C in a sealed vial under continuous stirring until the whole mixture formed a gel. The composite gel was further aged overnight at 90 °C to facilitate the cross-linking of the gel clusters. The composite gels obtained with the Na2CO3 catalyst were thoroughly washed and filtered thrice with DI water to remove the catalyst. The washing step was not required for composite gels obtained with the NH4OH catalyst because NH4 ions can be completely decomposed by the carbonization process. Subsequently, we carried out three solvent exchanges with isopropanol. After filtering, the gel was dried overnight in air at 80 °C. The dried composite gels were heated to 850 °C in a tube furnace under 100 mL min−1 of Ar flow; the ramp rate was kept at 5 °C min−1. To obtain Si/C-IWGN-1–6 composites, the temperature of the composites was maintained at 850 °C for 2 h. The control samples, Si/C-1–3 composites, were prepared by following the same procedure used to prepare Si/C-IWGNs. But GO was not added to the gel solution in this process.
2.2. Characterization
![[thin space (1/6-em)]](https://www.rsc.org/images/entities/char_2009.gif) :
:![[thin space (1/6-em)]](https://www.rsc.org/images/entities/char_2009.gif) 1
1![[thin space (1/6-em)]](https://www.rsc.org/images/entities/char_2009.gif) :
:![[thin space (1/6-em)]](https://www.rsc.org/images/entities/char_2009.gif) 1 onto a copper foil current collector using a Meyer-Bar coating device (Kipae E&T, Korea). A hybrid sample, Si–Gr, was prepared by mixing Si/C-IWGN-6 with commercial graphite with a mass ratio of 4
1 onto a copper foil current collector using a Meyer-Bar coating device (Kipae E&T, Korea). A hybrid sample, Si–Gr, was prepared by mixing Si/C-IWGN-6 with commercial graphite with a mass ratio of 4![[thin space (1/6-em)]](https://www.rsc.org/images/entities/char_2009.gif) :
:![[thin space (1/6-em)]](https://www.rsc.org/images/entities/char_2009.gif) 6. The working electrode of commercial graphite was prepared similarly except for the different binder (PVdF). The coated electrodes were roll-pressed under a constant compression ratio (=target thickness after pressing/coating thickness of a paste) and then vacuum dried at 80 °C for 12 h. The resulting electrode thickness was about 20–40 μm with a total mass loading of 1.5–2.0 mg cm−2 (3.43 mg cm−2 for graphite). A Celgard 2400 polypropylene membrane was used as the separator. 1.0 M LiPF6 in ethylene carbonate (EC)/ethyl methyl carbonate (EMC)/diethylcarbonate (DEC) with a volume ratio of 3
6. The working electrode of commercial graphite was prepared similarly except for the different binder (PVdF). The coated electrodes were roll-pressed under a constant compression ratio (=target thickness after pressing/coating thickness of a paste) and then vacuum dried at 80 °C for 12 h. The resulting electrode thickness was about 20–40 μm with a total mass loading of 1.5–2.0 mg cm−2 (3.43 mg cm−2 for graphite). A Celgard 2400 polypropylene membrane was used as the separator. 1.0 M LiPF6 in ethylene carbonate (EC)/ethyl methyl carbonate (EMC)/diethylcarbonate (DEC) with a volume ratio of 3![[thin space (1/6-em)]](https://www.rsc.org/images/entities/char_2009.gif) :
:![[thin space (1/6-em)]](https://www.rsc.org/images/entities/char_2009.gif) 4
4![[thin space (1/6-em)]](https://www.rsc.org/images/entities/char_2009.gif) :
:![[thin space (1/6-em)]](https://www.rsc.org/images/entities/char_2009.gif) 3 (PANAX ETEC Co., Ltd, Korea) containing 10 vol% fluoroethylene carbonate (FEC) was used as the electrolyte for silicon-containing composites. 1.0 M LiPF6 in an EC/EMC/DEC with a volume ratio of 3
3 (PANAX ETEC Co., Ltd, Korea) containing 10 vol% fluoroethylene carbonate (FEC) was used as the electrolyte for silicon-containing composites. 1.0 M LiPF6 in an EC/EMC/DEC with a volume ratio of 3![[thin space (1/6-em)]](https://www.rsc.org/images/entities/char_2009.gif) :
:![[thin space (1/6-em)]](https://www.rsc.org/images/entities/char_2009.gif) 4
4![[thin space (1/6-em)]](https://www.rsc.org/images/entities/char_2009.gif) :
:![[thin space (1/6-em)]](https://www.rsc.org/images/entities/char_2009.gif) 3 was used as the electrolyte for graphite. Electrochemical cycling and rate tests were conducted in a cut-off voltage range of 1.5–0.02 V (2.0–0.005 V for graphite) vs. Li/Li+ and cyclic voltammetry (CV) tests were carried out at a scan rate of 0.1 mV s−1 on a galvanostat/potentiostat system (WonATech Co., Ltd, Korea). The electrode thickness changes were measured by SEM of electrode cross-sections before and after the cycling test.
3 was used as the electrolyte for graphite. Electrochemical cycling and rate tests were conducted in a cut-off voltage range of 1.5–0.02 V (2.0–0.005 V for graphite) vs. Li/Li+ and cyclic voltammetry (CV) tests were carried out at a scan rate of 0.1 mV s−1 on a galvanostat/potentiostat system (WonATech Co., Ltd, Korea). The electrode thickness changes were measured by SEM of electrode cross-sections before and after the cycling test.
3. Results and discussion
3.1. Structures of Si/C and Si/C-IWGN composites
In Fig. 1, SEM and TEM images of Si/C-IWGN-3 and Si/C-IWGN-6 are presented. All the Si/C-IWGN samples had the shape of a thick disc, which contained the condensed particles (also see Fig. S1 in the ESI†). At high magnification, the SEM images of particle edges reveal that graphene sheets/stacks and carbon-coated SiNPs are aligned and densely packed in an alternating fashion. On the other hand, the SEM images of Si/C composites without graphene networks show spherical carbon-coated silicon particulates (Fig. S2†). TEM images of SiNPs, Si/C-1 and Si/C-IWGN samples are also shown in Fig. 1 and Fig. S1.† SiNPs, having diameters in the range of 50–100 nm (Fig. S1e†), are evenly coated with carbon in Si/C composites (Fig. S1f and S3†). As seen in the TEM images of Si/C-IWGN samples, spherical Si/C particles are distributed in between graphene sheets. Furthermore, a large fraction of void spaces are not only present between Si/C particles but they are also present between Si/C particles and graphene sheets. However, most of these Si/C particles are in intimate contact with graphene electrical wires in Si/C particles. These structural features of the Si/C-IWGN are highly conducive in achieving cycling stability, despite the huge volume changes in silicon-based composites.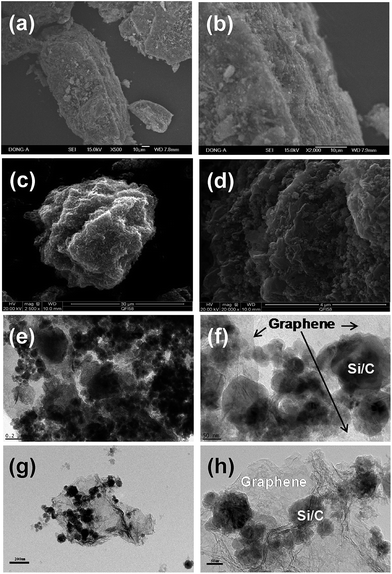 | ||
| Fig. 1 SEM images of (a and b) Si/C-IWGN-3 and (c and d) Si/C-IWGN-6, and TEM images of (e and f) Si/C-IWGN-3 and (g and h) Si/C-IWGN-6. | ||
In order to comprehensively investigate the microstructure of inside particles, we observed the cross-sections by SEM. In Fig. 2a and b, the cross-section images of Si/C-2 particles are displayed. The spherical Si/C particles are densely packed as there are tiny void spaces between these particles. The SiNPs in Si/C-2 are evenly coated with carbon layers (Fig. 2b). As shown in the SEM image of Si/C-IWGN-3 particles in Fig. 2c, white spots are surrounded by thin layers that are dark-gray in color. Fig. 2d is a highly magnified SEM image of Si/C-IWGN-3 particles. In Fig. 2d, the white spots are Si/C aggregates surrounded and/or covered by thin layers of graphene sheets, which are further elucidated by energy-dispersive X-ray spectroscopy (EDS) mapping of Si and C (Fig. 3). In Fig. 2e, we have presented the SEM image of the cross-section of Si/C-IWGN-6 particles, which was prepared using NH4OH as the gelation catalyst. In this figure, we observe several composite particles having a size of 15 μm. Fig. 2f displays a single particle of this composite material under high magnification. As shown in Fig. 2f, relatively thick graphene stacks are randomly distributed around Si/C particles, which are characterized by a large fraction of void spaces. The particle density of Si/C-IWGN-3 prepared using Na2CO3 as the gelation catalyst must be greater than that of Si/C-IWGN-6 prepared with NH4OH. Thus, with this novel sol–gel based synthetic strategy, we dispersed graphene sheets to form electrical networks and graphene-induced void spaces in the composites.
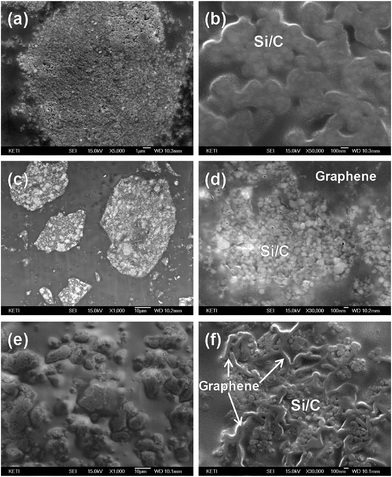 | ||
| Fig. 2 SEM images of particle cross-sections; (a and b) Si/C-2, (c and d) Si/C-IWGN-3 and (e and f) Si/C-IWGN-6. | ||
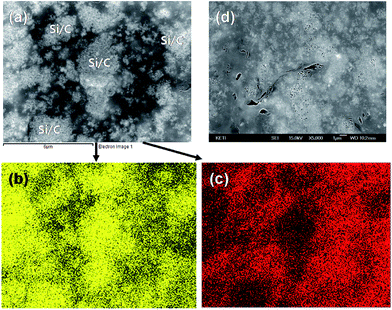 | ||
| Fig. 3 SEM images of (a and d) Si/C-IWGN-3 and EDS mapping of image (a) for (b) silicon and (c) carbon. | ||
In Table 1, we have presented the Si contents determined by TGA of samples (see Fig. 4a and Fig. S4†). The Si contents have been divided into two different ranges of 35.0–46.0 wt% and 50.0–52.2 wt%, and the Si content was controlled by the mass ratio of SiNPs/R used in the gelation mixtures. As shown in Fig. 4, the GS contents of samples in Table 1 were calculated by applying the mass loss (i.e., 45 wt% at 150–800 °C) of dried GO in TGA to the mass of GO initially present in the gelation mixture. TGA was performed up to a temperature of 800 °C under N2. The GS contents in the samples were varied by the amount of GO added in the gelation mixture. They were estimated to be in the range of 1–10 wt%. In the XRD patterns of samples (see Fig. S5†), we observed only crystalline Si diffraction peaks at 2θ = 28.6°, 47.5°, and 56.3° corresponding to the (111), (220), and (311) planes, respectively. These diffraction peaks were observed without any graphitic carbon phase at around 2θ = 26.4° even when the GS content in the Si/C-IWGN-3 composite was as high as 10 wt%. This indicates that GS sheets are highly dispersed in composites that do not form a thick crystalline graphitic phase, which is usually observed in Si–graphene composites annealed at high temperature.32–34
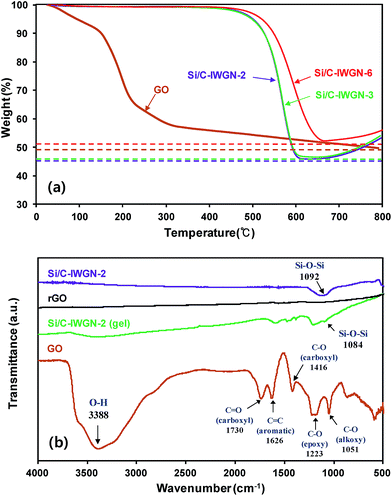 | ||
| Fig. 4 (a) TGA profiles of Si/C-IWGN samples (run in air flow) and GO (run in N2 flow) and (b) FTIR spectra of samples. | ||
The structural change associated with the formation of the Si/C-IWGN was further investigated using FTIR and Raman spectroscopy. FTIR spectra in Fig. 4b indicated that various bands of oxygen functional groups present in GO were substantially decreased in intensity in the Si/C-IWGN-2 (gel) and they were not detected in rGO (GO reduced in Ar flow at 850 °C for 2 h) and in Si/C-IWGN-2. This suggests that GO was partially reduced during the sol–gel reaction and it was further reduced to graphene after carbonization at high temperature.32 Raman spectra showed intense peaks at about 1350 and 1590 cm−1, corresponding to the well-defined D and G bands, respectively (Fig. S6†). The ID/IG ratio of rGO (1.04) was higher than that of GO (0.99), suggesting that the disordering portion of the two-dimensional carbon backbone was increased. The same trend was also observed from the conversion of Si/C-IWGN-2 (gel) to Si/C-IWGN by carbonization due to the partially disordered crystal structure of graphene sheets.
The surface compositions of SiNPs in composites were investigated by XPS, and the Si 2p spectra are presented in Fig. S7.† The parent SiNPs showed a strong Si 2p peak at 99.8 eV, which was associated with bulk Si0, while a small peak at 103.4 eV was attributed to a thin native SiOx layer.47 In the Si/C-IWGN samples, the peak intensity at 99.8 eV, which was associated with Si0, substantially decreased. On the other hand, there was an increase in the intensity at 104.0 eV, which is associated with SiOx. This is because during the sol–gel reaction, the surface of SiNPs is partially oxidized to SiOx (mainly SiO2) under slightly alkaline conditions. The relative intensity of the SiOx peak to the Si0 peak is more prominent in samples prepared at a higher R/C ratio. Thus the surface oxide layer on Si/C-IWGN-3, which was prepared at an R/C molar ratio of 50 using Na2CO3 as the gelation catalyst, was thicker than that on Si/C-IWGN-4 and Si/C-IWGN-5, which were prepared with NH4OH as the gelation catalyst at an R/C molar ratio of 100 and 500, respectively.
3.2. Electrochemical responses of Si/C and Si/C-IWGN composites
In Fig. 5, we have compared the galvanostatic charge/discharge voltage profiles of Si/C and Si/C-IWGN samples for the first cycle. In all the composites, the voltage slopes between 1.5 and 0.2 V appeared at the first discharge. These voltage slopes were attributed to the formation of an irreversible solid-electrolyte interface (SEI) film and the decomposition of the surface oxide layer (SiOx).47,48 This was followed by the appearance of long voltage plateaus between 0.2 and 0.02 V, which was attributed to the alloying reaction between Li+ and Si.6 At the first charge, the de-alloying reaction appeared at a sloping voltage plateau of 0.2 to 0.6 V. At a current of 100 mA g−1, the reference samples, Si/C-1, Si/C-2, and Si/C-3, showed the first discharge/charge capacities of 1284/813, 1567/1131 and 1725/1411 mA h g−1, respectively. The corresponding coulombic efficiencies (CEs) were 63.3, 72.2, and 81.8%, respectively. At a current of 100 mA g−1, the composites, Si/C-IWGN-1, Si/C-IWGN-2, and Si/C-IWGN-3, exhibited the first discharge/charge capacities of 1106/680, 1358/769 and 1447/894 mA h g−1, with the corresponding CEs being 61.5, 56.6, and 61.8%, respectively. The composites, Si/C-IWGN-4, Si/C-IWGN-5, and Si/C-IWGN-6, exhibited the first discharge/charge capacities of 1190/787, 1542/1240, and 1825/1336 mA h g−1, with the corresponding CEs being 66.1, 80.4, and 73.2%, respectively.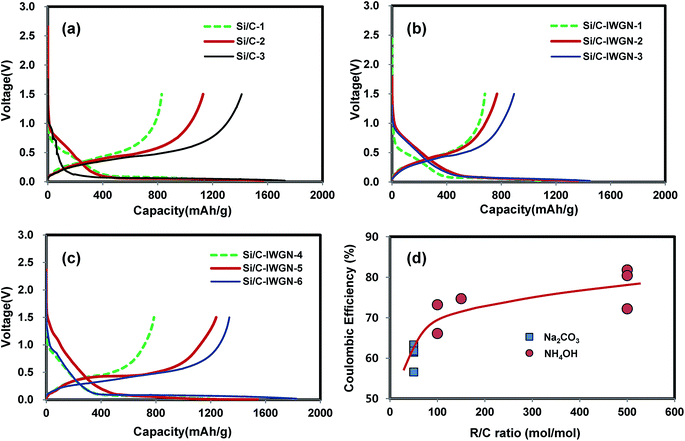 | ||
| Fig. 5 Voltage profiles of (a) Si/C-1–3, (b) Si/C-IWGN-1–3, (c) Si/C-IWGN-4–6 and the first cycle coulombic efficiencies of samples as a function of R/C ratio. | ||
As seen in Fig. 5d, the composites, Si/C-1 and Si/C-IWGN-1–3, which were prepared with the Na2CO3 catalyst at an R/C ratio of 50, exhibited relatively low CEs in the range of 56.6–63.3% in the first cycle. On the other hand, Si/C-2, Si/C-3, and Si/C-IWGN-5, which were prepared using the NH4OH catalyst at an R/C ratio of 500, showed CEs in a higher range of 72.2–81.8%. Si/C-IWGN-4 and Si/C-IWGN-6, which were prepared using the NH4OH catalyst at an R/C ratio of 100, exhibited CEs in an intermediate range of 66.1–73.2%. Fig. 5d represents the plot of CEs against R/C molar ratio. From this plot, we deduce that a larger R/C ratio can be used to gain higher CEs in the first cycle provided the gelation rate is not affected significantly. Under hydrothermal conditions, the surface of SiNPs in the composites is oxidized38 to SiOx as the level of oxidation is dependent on the R/C ratio, as evinced in the Si 2p XPS spectra shown in Fig. S7.† The formation of the SEI layer is known to cause irreversible capacity loss in the first cycle. In addition, the surface oxide layer is subjected to irreversible lithiation reactions,47,48 which are also responsible for irreversible capacity loss to some extent in the first cycle.
Fig. 6a and b display the cycling performances (in terms of discharge, i.e., lithiation, capacities) and CEs, respectively, of the reference Si/C samples. The samples were exposed initially to either three or five cycles at a current of 100 mA g−1. Thereafter, they were subjected to 100 cycles at a current of 500 mA g−1. The Si/C-3 (Si content = 52.2 wt%) exhibited the first charge/discharge capacities of 1725/1411 mA h g−1 at an applied current of 100 mA g−1. At an applied current of 500 mA g−1, we observed that the capacity of the composite was in the range of 1100–1150 mA h g−1 until the completion of 30 cycles. However, the capacity of the composite started fading rapidly after the 30th cycle. The Si/C-2 (Si content = 46.3 wt%) composite exhibited the first charge/discharge capacities of 1567/1131 mA h g−1 at a current of 100 mA g−1. By further cycling of Si/C-2 at a current of 500 mA g−1, a stable cycling performance was achieved at a reversible capacity of 825–840 mA h g−1 for up to 45 cycles. But the capacity of Si/C-2 also faded to 332 mA h g−1 after 100 cycles. The cycling behavior of Si/C-1 was similar to those of Si/C-2 and Si/C-3. However, compared with Si/C-2, Si/C-1 (Si content = 45.7 wt%), whose Si content was similar to that of Si/C-2, showed much lower reversible capacity (875 mA h g−1 at 100 mA g−1) and much lower CE (63.3%) in the first cycle. This was because the SiNPs in Si/C-1 (R/C ratio = 50 with C = Na2CO3) underwent more severe surface oxidation than those in Si/C-2 (R/C ratio = 500 with C = NH4OH).
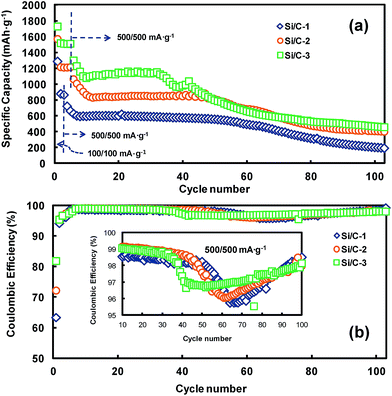 | ||
| Fig. 6 (a) Cycling performances and (b) coulombic efficiencies of Si/C-1–3 cycled in the cut-off range of 0.02–1.5 V. | ||
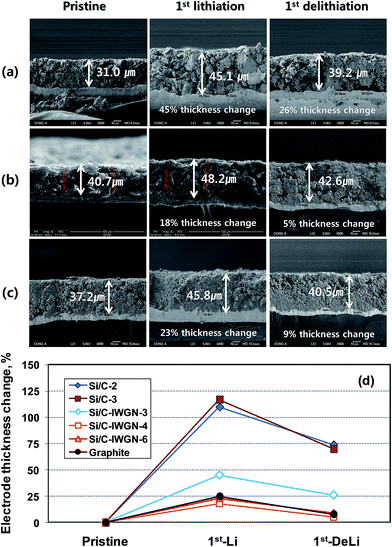
As shown in Fig. 6b and its inset, at a current of 500 mA g−1, the CEs of Si/C samples decreased from the cycle in which their capacity started fading. This indicates that abrupt irreversible events, such as electrochemical and structural changes occurred in Si/C electrodes. To support this, electrode thickness changes were measured by SEM on the Si/C-2 and Si/C-3 electrodes in their pristine, first-lithiated, and first-delithiated forms. As shown in Fig. 7, after the first lithiation, the thickness of Si/C-2 and Si/C-3 electrodes increased by 110% and 117%, respectively, while after the first delithiation, the thickness of these electrodes increased by 74 and 70%, respectively, over the pristine one. The sharp increase in the thickness of Si/C-2 and Si/C-3 electrodes with the progression of cycles was ascribed to the cause of capacity fading, as they underwent electrode pulverization, leading to the loss of electrical contacts between active materials as well as between active materials and current collector. In summary, the Si/C samples in which SiNPs are quite evenly coated with carbon layers (see Fig. S1–S3†) still suffer from capacity fading, which is accompanied by a sharp increase in electrode thickness. Hence, it is certain that a simple carbon coating, which is mostly done to enhance the electrical conductivity of silicon, is not enough to achieve long-term cycling stability of silicon-based composites.
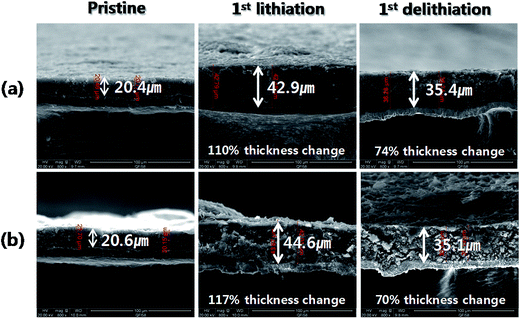 | ||
| Fig. 7 SEM images of electrode cross-sections of (a) Si/C-2 and (b) Si/C-3 for their pristine and after the first lithiation and delithiation. | ||
Fig. 8a and b show the cycling performances and CEs of Si/C-IWGN-1–3 series samples, respectively. The samples were exposed to the initial three cycles at an applied current of 100 mA g−1. Then, they were cycled to additional 100 cycles at 500 mA g−1. The reversible discharge capacities in the second cycle of Si/C-IWGN-1, Si/C-IWGN-2, and Si/C-IWGN-3 were, 738, 879, and 994 mA h g−1, respectively. On further cycling at 500 mA g−1, the corresponding discharge capacities were stabilized in the tenth cycle at 470, 667 and 749 mA h g−1. At the end of the 100th cycle at 500 mA g−1, the composites showed capacity retentions of 90.2, 84.6 and 85.2%, respectively. As seen in Fig. 6, the reference sample, Si/C-1, showed the corresponding capacity retention of only 32.1%. At 500 mA g−1, the CEs of Si/C-IWGN-1–3 increased from 98.1–98.8% in the 10th cycle to above 99% in the 100th cycle as shown in Fig. 8b and its inset. Thus, the Si/C-IWGN-1–3 composites with graphene networks showed much better cycling stability than Si/C-1. Since the series samples of Si/C-1 and Si/C-IWGN-1–3 were prepared under identical conditions using the same amount of Si contents, the enhanced cycling stabilities of Si/C-IWGN-1–3 could be ascribed to the presence of graphene networks in those composites. For the series of Si/C-1 and Si/C-IWGN-1–3, the sheet resistances and conductivities of pristine electrodes are presented in Table S1 and Fig. S8.† The sheet resistance increased with increasing graphene content in the samples. The sheet resistances of Si/C-IWGN-2 and Si/C-IWGN-3, whose graphene contents were 5 and 10 wt%, respectively, were significantly higher than those of other samples. Therefore, the conductivities of Si/C-IWGN-2 and Si/C-IWGN-3 were less than about two fold when compared with those of Si/C-1 and Si/C-IWGN-1 composites, whose graphene contents were 0 and 1 wt%, respectively. Since the same electrode formulations were applied to the entire series of samples, the difference in electrode resistance can be attributed to the difference in active material properties. These results are more or less expected when one peruses through the apparent electrode densities in Fig. 1–3 (TEM images and SEM images of the cross-section of a particle). Owing to the presence of graphene networks in composites, a large fraction of void spaces are observed between Si/C particles and graphene sheets as seen in the TEM images in Fig. 1. As shown in Fig. 2 and 3, the void spaces are more clearly visible in the SEM images of particle cross-sections. On the other hand, Si/C particles are more densely packed in Si/C-1 (Fig. 2a). Furthermore, although the aggregates of small sized Si/C are distributed over the bulk particles, they are connected by graphene sheets in the micrometer-sized particles of Si/C-IWGN-3 (Fig. 2 and 3). Hence, when compared with Si/C-1, the presence of graphene networks in the Si/C-IWGN decreases particle density and electrical conductivity. However, under the circumstances of huge volume expansions of silicon through repeated cycling, the void spaces in Si/C-IWGNs accommodate volume variations, and graphene networks maintain electrical networks in composites. To support this hypothesis, we measured the changes in the thickness of Si/C-1 and Si/C-IWGN-2 electrodes before and after cycling. As shown in Fig. S9,† the thickness of Si/C-1 increased by 62.2–77.5% over the pristine sample, while that of Si/C-IWGN-2 increased by only 21% after being subjected to 100 cycles at 500 mA g−1. It is interesting to note that the increase in the thicknesses of cycled Si/C-1 and Si/C-IWGN-2 is comparable to those of first-delithiated Si/C-2 and Si/C-IWGN-3 (see Fig. 10 below), respectively. Therefore, the graphene networks present in Si/C-IWGN-1–3 were found to be quite effective in enhancing the cycling stability of silicon-based composites.
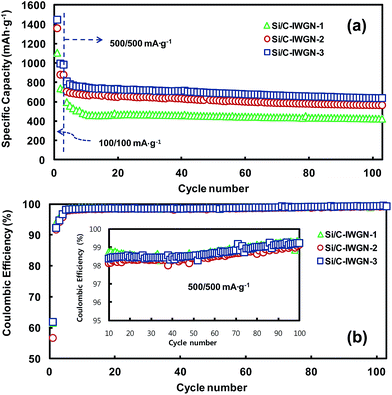 | ||
| Fig. 8 (a) Cycling performances and (b) coulombic efficiencies of Si/C-IWGN-1–3 cycled in the cut-off range of 0.02–1.5 V. | ||
In Si/C-IWGN-1, a small amount of graphene as low as 1 wt% was sufficient to effectively stabilize the cycling performance (Fig. 8a). Therefore, Si/C-IWGN-4–6 composites were prepared to contain about 1 wt% of graphene but different amounts of silicon with NH4OH as the gelation catalyst (see Table 1) at two different R/C ratios. Fig. 9a and b show the cycling performances and CEs of the Si/C-IWGN-4–6 samples, respectively. At a current of 100 mA g−1, the composites, Si/C-IWGN-4, Si/C-IWGN-5, and Si/C-IWGN-6 exhibited reversible discharge capacities in the range of 1530–1560, 1330–1360, and 870–896 mA h g−1, respectively. On further cycling at 500 mA g−1, Si/C-IWGN-4, Si/C-IWGN-5, and Si/C-IWGN-6 showed stabilized discharge capacities of 656, 784, and 855 mA h g−1, respectively, at the 15th cycle; the capacity retentions of Si/C-IWGN-4, Si/C-IWGN-5, and Si/C-IWGN-6 were 84.8, 87.0, and 83.4%, respectively, at the 100th cycle. On the other hand, the corresponding capacity retentions of reference Si/C-2 and Si/C-3 were only 47.5 and 41.3%, respectively (Fig. 6). The CEs of Si/C-IWGN-4–6 increased to approach 99.2–99.4% at the end of the cycle. However, when the current density was increased from 100 to 500 mA g−1, Si/C-IWGN-5 and Si/C-IWGN-6 showed a steep drop in capacity compared to other Si/C-IWGN samples. This drop in capacity at high current could be attributed to low electrode conductivities due to low material densities, which are apparent in Fig. 2. In general, an active material of higher density has to be used to obtain electrodes with higher volumetric capacity.49 On the other hand, the void space in the composite, which inherently decreases its density, is advantageous in maintaining the cycling stability of silicon, which undergoes a large volume expansion in the electrode.16,17,19,20,29,50–52 Hence, the material density has to be optimized to achieve the cycling stability and high volumetric capacity at the same time. As shown in Fig. 10, the electrode thicknesses increased by 18 and 5% over that of the pristine sample, after the first lithiation and de-lithiation of Si/C-IWGN-4, respectively. The corresponding increases in the thickness of Si/C-IWGN-6, which has higher silicon content than Si/C-IWGN-4, were 23 and 9%, respectively. The changes in the electrode thickness of Si/C-IWGN-4 and Si/C-IWGN-6 are either comparable to or lower than those (25 and 8%, respectively) obtained from a commercial graphite (Fig. 10b and S10†). This indicates that we were able to restrict the increase in the electrode thickness of Si/C-IWGNs to a level that is comparable to that obtained from commercial graphite because of the void spaces rendered by graphene networks in the composites. However, the electrode resistance has to be further optimized to reduce capacity drop at high currents.
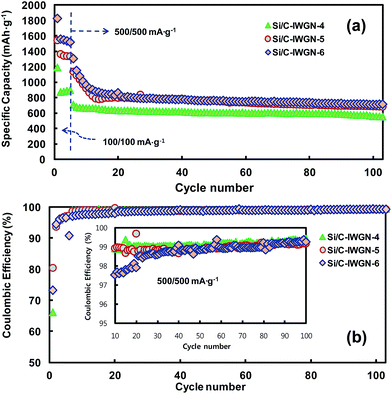 | ||
| Fig. 9 (a) Cycling performances and (b) coulombic efficiencies of Si/C-IWGN-4–6 cycled in the cut-off range of 0.02–1.5 V. | ||
3.3. Volumetric capacities of Si/C-IWGN composites and graphite
For alloys such as silicon characterized by a large volume expansion, it is desirable to evaluate their corresponding volumetric capacity and compare it with that of graphite.49 As shown in Fig. 11, we have calculated the volumetric capacities of few Si/C-IWGN composites and compared them with that of commercial graphite. For this purpose, the capacities were calculated based on the total amount (weight or volume) of the coated material, which included the active material, the binder, and the conductive additive (see Table S2†). At a current of 100 mA g−1, the specific capacities of Si/C-IWGN-3 and Si/C-IWGN-6 were 2.7–4.2 times higher than that of graphite. The volumetric capacities of Si/C-IWGN-3 and Si/C-IWGN-6 were 484 and 682 mA h cm−3, respectively. Thus, these values were either comparable to or 1.4 times higher than that of graphite (483 mA h cm−3), respectively. The volumetric capacity of graphite was found to be lower than the theoretically estimated value of 818 mA h cm−3 (=372 mA h g−1 × 2.2 g cm−3).49,53 This is because the total electrode volume included the active material, binder and conductive additive. In summary, we have achieved the remarkable feat of designing Si/C-IWGNs, whose specific capacity is greater than graphite by a factor of up to 2–4. This novel composite possesses excellent cycling stability, and its volumetric capacity is also much higher than that of graphite.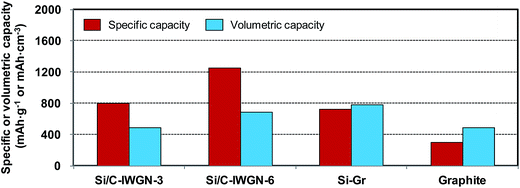 | ||
| Fig. 11 Comparison of the specific and volumetric capacities of electrodes based on the total electrode weight and volume inclusive of the active material, binder and conductive additive. | ||
3.4. Electrochemical responses of a hybrid, Si–Gr sample
Presently, the commercially available cathode material has a low capacity of about 200 mA h g−1,54–56 which could be possibly increased to 250–300 mA h g−1 in the near future.2 Therefore, to practically improve the cell energy of LIBs, we need to develop an anode having a capacity of around ∼1000 mA h g−1.7 For this purpose, we need to ideally develop novel silicon-based composites. In particular, a hybrid material consisting of high capacity Si-anodes and commercial graphite could be a practical solution for a reliable and cost-effective anode. Therefore, we prepared the Si–Gr hybrid, consisting of Si/C-IWGN-6 (reversible capacity of 1550 mA h g−1 at 100 mA g−1) and graphite with a weight ratio of 4![[thin space (1/6-em)]](https://www.rsc.org/images/entities/char_2009.gif) :
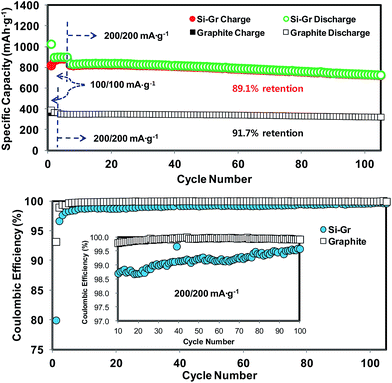
:![[thin space (1/6-em)]](https://www.rsc.org/images/entities/char_2009.gif) 6. Then, we evaluated the electrochemical response of this novel hybrid. The expected reversible capacity of the Si–Gr was estimated to be 843 mA h g−1 (=1550 mA h g−1 × 0.4 + 372 mA h g−1 × 0.6). Fig. 12a and b display the cycling performances and CEs of Si–Gr and graphite, respectively. The first charge and discharge capacities of the Si–Gr hybrid were 1025 and 820 mA h g−1, respectively, at the first CE of 80.0%. At the currents of 100 and 200 mA g−1, the reversible discharge capacities of this hybrid were about 898 and 830 mA h g−1, respectively. Furthermore, at 200 mA h g−1, the capacity retention of this hybrid was 89.1% for 100 cycles. Thus, the capacity retention of this hybrid was close to that of graphite (91.7%). The CE of Si–Gr increased to 96.6% in the second cycle and to 99.7% in the 105th cycle, thereby approaching the CE of graphite. Based on the electrode volume, the volumetric capacity of Si–Gr was 777 mA h cm−3 (Fig. 11), which is 161% higher than the volumetric capacity obtained from graphite (483 mA h cm−3). It is even higher than that of Si/C-IWGN-6 (682 mA h cm−3) since the coating density of Si–Gr (1.09 g cm−3) is greater than that of Si/C-IWGN-6 (0.55 g cm−3) (Table S2†). Thus, with this hybridization strategy demonstrated here, we have achieved the performance improvements in volumetric capacity (682 mA h cm−3 for Si/C-IWGN-6 → 777 mA h cm−3 for Si–Gr) and CE in the first cycle (73% for Si/C-IWGN-6 → 80% for Si/Gr). Furthermore, this novel hybrid could be a cost-effective material in comparison with the Si-based composite.
6. Then, we evaluated the electrochemical response of this novel hybrid. The expected reversible capacity of the Si–Gr was estimated to be 843 mA h g−1 (=1550 mA h g−1 × 0.4 + 372 mA h g−1 × 0.6). Fig. 12a and b display the cycling performances and CEs of Si–Gr and graphite, respectively. The first charge and discharge capacities of the Si–Gr hybrid were 1025 and 820 mA h g−1, respectively, at the first CE of 80.0%. At the currents of 100 and 200 mA g−1, the reversible discharge capacities of this hybrid were about 898 and 830 mA h g−1, respectively. Furthermore, at 200 mA h g−1, the capacity retention of this hybrid was 89.1% for 100 cycles. Thus, the capacity retention of this hybrid was close to that of graphite (91.7%). The CE of Si–Gr increased to 96.6% in the second cycle and to 99.7% in the 105th cycle, thereby approaching the CE of graphite. Based on the electrode volume, the volumetric capacity of Si–Gr was 777 mA h cm−3 (Fig. 11), which is 161% higher than the volumetric capacity obtained from graphite (483 mA h cm−3). It is even higher than that of Si/C-IWGN-6 (682 mA h cm−3) since the coating density of Si–Gr (1.09 g cm−3) is greater than that of Si/C-IWGN-6 (0.55 g cm−3) (Table S2†). Thus, with this hybridization strategy demonstrated here, we have achieved the performance improvements in volumetric capacity (682 mA h cm−3 for Si/C-IWGN-6 → 777 mA h cm−3 for Si–Gr) and CE in the first cycle (73% for Si/C-IWGN-6 → 80% for Si/Gr). Furthermore, this novel hybrid could be a cost-effective material in comparison with the Si-based composite.
Fig. 13a compares the first and fifth CV profiles of Si/C-IWGN-6, graphite and Si–Gr. The CV profile of Si–Gr seems to be a weight-averaged superposition of the profiles of Si/C-IWGN-6 and graphite. As shown in Fig. 13b, the voltage profile of Si–Gr also reflects the characteristics of those obtained from Si/C-IWGN-6 (Fig. 5) and graphite (Fig. S11†). As shown in Fig. 13c, the rate responses of Si/C-IWGN-6, Si–Gr and graphite were obtained by varying the discharge currents in the range of 100–2000 mA g−1 at a fixed charge at 100 mA g−1. In the C-rate range of 1.1–1.4 h−1, Si/C-IWGN-6, Si–Gr and graphite delivered 624, 398 and 78 mA h g−1. The corresponding capacity retentions were 44.2, 48.2 and 21.0% of their capacities obtained at 100 mA g−1, respectively. This indicates that the alloying/de-alloying kinetics of silicon are faster than the intercalation/de-intercalation of graphite.
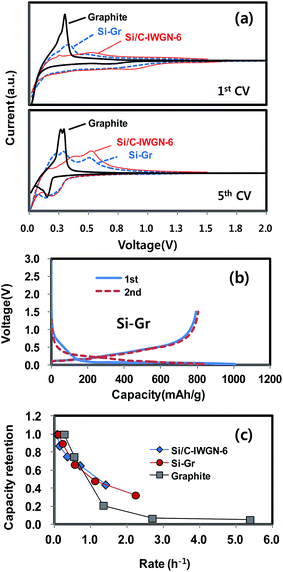 | ||
| Fig. 13 (a) CV profiles of graphite, Si/C-IWGN-6 and Si–Gr, (b) voltage profiles of Si–Gr and (c) rate responses of graphite, Si/C-IWGN-6 and Si–Gr. | ||
4. Conclusions
In summary, we devised a simple one-pot aqueous sol–gel system to prepare Si/C-IWGN, a novel composite material in which graphene networks were highly dispersed throughout Si/C composites; this novel composite was used for high performance LIB anodes. The Si/C-IWGN composites exhibited greater cycling stability compared to reference Si/C samples, which consisted of SiNPs that were simply coated with carbon. The characterization and electrochemical responses of this novel composite suggest that graphene networks in Si/C-IWGNs not only provide electrical networks but also generate void spaces, which are very effective in absorbing large volume expansions of Si to the level comparable to that of commercial graphite. Thereby, graphene networks effectively tackled the issue of common electrode pulverization and ensured the cycling stability of Si-based anodes. Compared to commercial graphite, a properly designed Si/C-IWGN composite material exhibited about ∼420% increase in specific capacity and about ∼141% increase in volumetric capacity, which was determined on the basis of electrode weight or volume. We devised a reliable and cost-effective hybrid anode using a mixture of Si/C-IWGN and commercial graphite. Si–Gr is a hybrid that offers the capacity level (800–1000 mA h g−1) required to improve the energy density of current LIB cells. Moreover, the volumetric capacity of the Si–Gr electrode is 161% higher than that obtained from commercial graphite. The Si–Gr hybrid also has excellent cycling stability. We conclude that the preparation of Si/C-IWGNs is a scalable process. Moreover, owing to the remarkable electrochemical responses of Si/C-IWGNs, it could be used in manufacturing energy storage devices of high energy density and long cycle life.Acknowledgements
This work was supported by grants from the National Research Foundation of Korea funded by the Korean Government (MEST) (NRF-2009-C1AAA001-0093307) and by the Human Resource Training Program for Regional Innovation and Creativity through the Ministry of Education and National Research Foundation of Korea (NRF-2014H1C1A1073093).References
- B. Scrosati and J. Garche, J. Power Sources, 2010, 195, 2419 CrossRef CAS PubMed.
- M. M. Thackeray, C. Wolverton and E. D. Isaacs, Energy Environ. Sci., 2012, 5, 7854 CAS.
- J. Hassoun, K. S. Lee, Y. K. Sun and B. Scrosati, J. Am. Chem. Soc., 2011, 133, 3139 CrossRef CAS PubMed.
- J. M. Tarascon, Philos. Trans. R. Soc., A, 2010, 368, 3227 CrossRef PubMed.
- H. Wu, G. Chan, J. W. Choi, I. Ryu, Y. Yao, M. T. McDowell, S. W. Lee, A. Jackson, Y. Yang, L. B. Hu and Y. Cui, Nat. Nanotechnol., 2012, 7, 309 Search PubMed.
- R. A. Huggins, J. Power Sources, 1999, 82, 13 CrossRef.
- S. D. Beattie, D. Larcher, M. Morcrette, B. Simon and J. M. Tarascon, J. Electrochem. Soc., 2008, 155, A158 CrossRef CAS PubMed.
- H. Kim, E. J. Lee and Y. K. Sun, Mater. Today, 2014, 17, 285 CrossRef CAS PubMed.
- J. Hassoun and B. Scrosati, Angew. Chem., Int. Ed., 2010, 49, 2371 CrossRef CAS PubMed.
- Y. Yang, M. T. McDowell, A. Jackson, J. J. Cha, S. S. Hong and Y. Cui, Nano Lett., 2012, 10, 1486 CrossRef PubMed.
- R. Elazari, G. Salitra, G. Gershinsky, A. Garsuch, A. Panchenko and D. Aurbach, Electrochem. Commun., 2012, 14, 21 CrossRef CAS PubMed.
- J. Hassoun, J. Kim, D. J. Lee, H. G. Jung, S. M. Lee, Y. K. Sun and B. Scrosati, J. Power Sources, 2012, 202, 308 CrossRef CAS PubMed.
- M. Agostini, J. Hassoun, J. Liu, M. Jeong, H. Nara, T. Momma, T. Osaka, Y. K. Sun and B. Scrosati, ACS Appl. Mater. Interfaces, 2014, 6, 10924 CAS.
- N. S. Choi, K. H. Yew, K. Y. Lee, M. Sung, H. Kim and S. S. Kim, J. Power Sources, 2006, 161, 1254 CrossRef CAS PubMed.
- H. Nakai, T. Kubota, A. Kita and A. Kawashima, J. Electrochem. Soc., 2011, 158, A798 CrossRef CAS PubMed.
- H. Wu, G. Y. Zheng, N. A. Liu, T. J. Carney, Y. Yang and Y. Cui, Nano Lett., 2012, 12, 904 CrossRef CAS PubMed.
- N. Liu, Z. D. Lu, J. Zhao, M. T. McDowell, H. W. Lee, W. T. Zhao and Y. Cui, Nat. Nanotechnol., 2014, 9, 187 CrossRef CAS PubMed.
- B. Philippe, R. Dedryvere, J. Allouche, F. Lindgren, M. Gorgoi, H. Rensmo, D. Gonbeau and K. Edstrom, Chem. Mater., 2012, 24, 1107 CrossRef CAS.
- N. Liu, H. Wu, M. T. McDowell, Y. Yao, C. M. Wang and Y. Cui, Nano Lett., 2012, 12, 3315 CrossRef CAS PubMed.
- A. Magasinski, P. Dixon, B. Hertzberg, A. Kvit, J. Ayala and G. Yushin, Nat. Mater., 2010, 9, 461 CrossRef CAS PubMed.
- S. R. Chen, M. L. Gordin, R. Yi, G. Howlett, H. Sohn and D. H. Wang, Phys. Chem. Chem. Phys., 2012, 14, 12741 RSC.
- B. Hertzberg, A. Alexeev and G. Yushin, J. Am. Chem. Soc., 2010, 132, 8548 CrossRef CAS PubMed.
- H. Kim, B. Han, J. Choo and J. Cho, Angew. Chem., Int. Ed., 2008, 47, 10151 CrossRef CAS PubMed.
- B. M. Bang, J. I. Lee, H. Kim, J. Cho and S. Park, Adv. Energy Mater., 2012, 2, 878 CrossRef CAS PubMed.
- M. Y. Ge, Y. H. Lu, P. Ercius, J. P. Rong, X. Fang, M. Mecklenburg and C. W. Zhou, Nano Lett., 2014, 14, 261 CrossRef CAS PubMed.
- R. Yi, F. Dai, M. L. Gordin, S. R. Chen and D. H. Wang, Adv. Energy Mater., 2013, 3, 295 CrossRef CAS PubMed.
- H. Wu and Y. Cui, Nano Today, 2012, 7, 414 CrossRef CAS PubMed.
- X. L. Li, M. Gu, S. Y. Hu, R. Kennard, P. F. Yan, X. L. Chen, C. M. Wang, M. J. Sailor, J. G. Zhang and J. Liu, Nat. Commun., 2014, 5, 7 Search PubMed.
- Z. D. Lu, N. Liu, H. W. Lee, J. Zhao, W. Y. Li, Y. Z. Li and Y. Cui, ACS Nano, 2015, 9, 2540 CrossRef CAS PubMed.
- B. Wang, X. L. Li, X. F. Zhang, B. Luo, M. H. Jin, M. H. Liang, S. A. Dayeh, S. T. Picraux and L. J. Zhi, ACS Nano, 2013, 7, 1437 CrossRef CAS PubMed.
- S. M. Paek, E. Yoo and I. Honma, Nano Lett., 2009, 9, 72 CrossRef CAS PubMed.
- J. K. Lee, K. B. Smith, C. M. Hayner and H. H. Kung, Chem. Commun., 2010, 46, 2025 RSC.
- T. Yoon, M. Cho, Y. W. Suh, E. S. Oh and J. K. Lee, J. Nanosci. Nanotechnol., 2011, 11, 10193 CrossRef CAS PubMed.
- X. Zhao, C. M. Hayner, M. C. Kung and H. H. Kung, Adv. Energy Mater., 2011, 1, 1079 CrossRef CAS PubMed.
- K. Evanoff, A. Magasinski, J. B. Yang and G. Yushin, Adv. Energy Mater., 2011, 1, 495 CrossRef CAS PubMed.
- J. Y. Luo, X. Zhao, J. S. Wu, H. D. Jang, H. H. Kung and J. X. Huang, J. Phys. Chem. Lett., 2012, 3, 1824 CrossRef CAS.
- J.-G. Ren, Q.-H. Wu, G. Hong, W.-J. Zhang, H. Wu, K. Amine, J. Yang and S.-T. Lee, Energy Technol., 2013, 1, 77 CrossRef CAS PubMed.
- C. Chae, H. J. Noh, J. K. Lee, B. Scrosati and Y. K. Sun, Adv. Funct. Mater., 2014, 24, 3036 CrossRef CAS PubMed.
- S. Watcharotone, D. A. Dikin, S. Stankovich, R. Piner, I. Jung, G. H. B. Dommett, G. Evmenenko, S. E. Wu, S. F. Chen, C. P. Liu, S. T. Nguyen and R. S. Ruoff, Nano Lett., 2007, 7, 1888 CrossRef CAS PubMed.
- K. S. Novoselov, A. K. Geim, S. V. Morozov, D. Jiang, Y. Zhang, S. V. Dubonos, I. V. Grigorieva and A. A. Firsov, Science, 2004, 306, 666 CrossRef CAS PubMed.
- S. Stankovich, D. A. Dikin, G. H. B. Dommett, K. M. Kohlhaas, E. J. Zimney, E. A. Stach, R. D. Piner, S. T. Nguyen and R. S. Ruoff, Nature, 2006, 442, 282 CrossRef CAS PubMed.
- J. R. Potts, D. R. Dreyer, C. W. Bielawski and R. S. Ruoff, Polymer, 2011, 52, 5 CrossRef CAS PubMed.
- R. Raccichini, A. Varzi, S. Passerini and B. Scrosati, Nat. Mater., 2014, 14, 271 CrossRef PubMed.
- B. Luo and L. Zhi, Energy Environ. Sci., 2015, 8, 456 CAS.
- N. I. Kovtyukhova, P. J. Ollivier, B. R. Martin, T. E. Mallouk, S. A. Chizhik, E. V. Buzaneva and A. D. Gorchinskiy, Chem. Mater., 1999, 11, 771 CrossRef CAS.
- D. W. S. R. W. Pekala, Macromolecules, 1993, 26, 5487 CrossRef.
- N. Yan, F. Wang, H. Zhong, Y. Li, Y. Wang, L. Hu and Q. W. Chen, Sci. Rep., 2013, 3, 6 Search PubMed.
- Z. Favors, W. Wang, H. H. Bay, A. George, M. Ozkan and C. S. Ozkan, Sci. Rep., 2014, 4, 7 Search PubMed.
- M. N. Obrovac, L. Christensen, D. B. Le and J. R. Dahnb, J. Electrochem. Soc., 2007, 154, A849 CrossRef CAS PubMed.
- X. Y. Zhou, J. J. Tang, J. Yang, J. Xie and L. L. Ma, Electrochim. Acta, 2013, 87, 663 CrossRef CAS PubMed.
- R. Y. Zhang, Y. J. Du, D. Li, D. K. Shen, J. P. Yang, Z. P. Guo, H. K. Liu, A. A. Elzatahry and D. Y. Zhao, Adv. Mater., 2014, 26, 6749 CrossRef CAS PubMed.
- Z. L. Zhang, Y. H. Wang, W. F. Ren, Q. Q. Tan, Y. F. Chen, H. Li, Z. Y. Zhong and F. B. Su, Angew. Chem., Int. Ed., 2014, 53, 5165 CAS.
- M. Hahn, H. Buqa, P. W. Ruch, D. Goers, M. E. Spahr, J. Ufheil, P. Novak and R. Kotz, Electrochem. Solid-State Lett., 2008, 11, A151 CrossRef CAS PubMed.
- Y. K. Sun, D. H. Kim, C. S. Yoon, S. T. Myung, J. Prakash and K. Amine, Adv. Funct. Mater., 2010, 20, 485 CrossRef CAS PubMed.
- Y. K. Sun, B. R. Lee, H. J. Noh, H. M. Wu, S. T. Myung and K. Amine, J. Mater. Chem., 2011, 21, 10108 RSC.
- Y. K. Sun, Z. H. Chen, H. J. Noh, D. J. Lee, H. G. Jung, Y. Ren, S. Wang, C. S. Yoon, S. T. Myung and K. Amine, Nat. Mater., 2012, 11, 942 CrossRef CAS PubMed.
Footnote |
| † Electronic supplementary information (ESI) available. See DOI: 10.1039/c5ta04681e |
| This journal is © The Royal Society of Chemistry 2015 |

