 Open Access Article
Under dark and visible light: fast degradation of methylene blue in the presence of Ag–In–Ni–S nanocomposites†
Aniruddha
Molla
,
Meenakshi
Sahu
and
Sahid
Hussain
*
Department of Chemistry, Indian Institute of Technology Patna, Patna 800 013, India. E-mail: sahid@iitp.ac.in; Fax: +91-612-227-7383; Tel: +91-612-255-2022
First published on 19th June 2015
Abstract
Ag–In–Ni–S nanocomposites of different shapes were productively achieved in water using thioacetamide at different temperatures in the presence of SDS with uniform size distributions. It was found that variation of the sodium dodecyl sulphate (SDS) concentration and the temperature had a significant influence on the morphology of Ag–In–Ni–S and the photocatalytic activity. The newly synthesized Ag–In–Ni–S nanocomposites were fully characterized by powder XRD, IR, UV-vis, DRS, FE-SEM, TEM, EDX, XPS, BET and TGA. The catalytic activities were measured by the degradation of methylene blue (MB) in the absence and presence of visible light (sunlight and 100 W tungsten lamp). The catalyst was found to be effective in degrading MB through the generation of reactive oxygen species (ROS) which was confirmed using terephthalic acid (TA), dihydrorhodamine 123 (DHR123) treatment and ESI mass spectroscopy. The removal efficiency of MB by the nanocomposites is very fast, nearly quantitative and repeatable up to five cycles.
1. Introduction
Many photocatalysts have been attracting a great deal of interest due to their potential applications in the areas of environmental and energy issues. TiO2 (anatase crystal structure) was the first semiconductor photocatalyst discovered in 1972 by Fujishima and Honda. This catalyst was only active under ultraviolet light for the splitting of water on TiO2 electrodes due to its wide band gap (3.0–3.2 eV).1 To improve the visible-light sensitivity (λ > 400 nm) of TiO2 photocatalysts, much work has been done.2 Most modified and doped photocatalysts have shown low activities, poor absorption of visible light and relatively poor stability during the photocatalytic process. To overcome such limitations, many composites, such as metal oxide/TiO2,3 metal oxide/metal oxide,4 metal/metal halides,5 chalcogenides6 and graphene-based7 composites with heterojunction structure, have been reported. Coupling of two or more chalcogenide materials with different band gaps has been demonstrated to be a practical approach for improving the photocatalytic activity.6Owing to their interesting physical and chemical properties, metal chalcogenides have found various potential technological applications in energy conversion, fuel cells,8 solar cells,9 sensors, light-emitting diodes,10 Li-ion batteries, photoelectrochemical water splitting,11 supercapacitors,12 thermoelectric and memory devices.6 Silver and silver-doped compounds have been of immense interest over the last few years due to their high photocatalytic activities.13 Of late, several photocatalysts have been reported, but only a few were active under visible light because of the catalysts’ low visible light utilization and the high recombination rate of photo-induced electron–hole pairs.14 Several painstaking strategies have been used to improve upon the light absorption efficiency through doping with non-metal anions and transition metal cations, surface modification with ligands, and noble metals or polymer supports. In terms of modification with noble metals, Ag is one of the most appropriate candidates for industrial applications because Ag nanoparticles have electron storage properties and they provide a suitable pathway for the transfer of photogenerated charges.15 Due to these interesting features, researchers have attempted to synthesize these mixed multinary chalcogenides in a facile, convenient, eco-friendly and cost-effective manner. Such mixed multinary chalcogenide composites with different shapes and sizes, can be effective in reducing the recombination probability of photogenerated electrons and holes and have been widely employed to improve the photocatalytic activity.
There are several liquid-phase synthesis methods available, e.g. liquid exfoliation, hot-injection, hydrothermal, solvothermal, microwave, sonochemical, template-directed and colloidal methods, for the production of this type of material. Recently, Huang et al. reported CuS caved superstructures16 and their application to the catalysis of organic dye degradation in the absence of light but in the presence of hydrogen peroxide. Some of the reported methods are creditable, but most suffer from drawbacks like the requirement for a special set-up for maintaining inert conditions, high temperatures and low dye removal efficiency with longer times. Herein we report a green synthesis of Ag–In–Ni–S nanocomposites in water using thioacetamide at different temperatures. Modification of the surface with variation of SDS concentration at different temperatures was also performed. The synthesized Ag–In–Ni–S nanocomposites have high catalytic activity and could be applicable for the management of dye polluted waste water purification in the presence and absence of light.13
2. Experimental
2.1 Material
Silver acetate dihydrate [Ag(OAc)·2H2O], indium acetate [In(OAc)3], nickel acetate tetrahydrate [Ni(OAc)2·4H2O], sodium dodecyl sulphate (SDS), thioacetamide (C2H5NS), ethanol (EtOH) and methylene blue were all analytical grade and used without further purification. Double distilled water was employed throughout the experiments.2.2 Catalyst preparation at different reaction conditions with variation of SDS concentration
In order to synthesize the Ag–In–Ni–S nanocomposites, silver acetate (1.0 mmol), indium acetate (1.0 mmol), nickel acetate tetrahydrate (1.0 mmol) and SDS (0.1–1.5 mmol) were dissolved in 10 mL water (solution A). In a separate flask, thioacetamide (3.5 mmol) was dissolved in 5 mL of water (solution B).2.3 Degradation of methylene blue
In order to evaluate the degradation activities of the prepared Ag–In–Ni–S nanocomposites, the decomposition of methylene blue (MB) in the absence and presence of visible light (sunlight and 100 W tungsten lamp) was investigated. 20 mg Ag–In–Ni–S was dispersed in 14 mL aqueous solution of ∼10−5 (M) MB. The suspensions were magnetically stirred in the dark. At given time intervals, 2 mL aliquots were taken and were centrifuged to remove the catalyst. UV-vis spectra were recorded with 1![[thin space (1/6-em)]](https://www.rsc.org/images/entities/char_2009.gif) :
:![[thin space (1/6-em)]](https://www.rsc.org/images/entities/char_2009.gif) 1 dilution of the experimental solution taken at certain intervals. Blank experiments were also performed under identical conditions.
1 dilution of the experimental solution taken at certain intervals. Blank experiments were also performed under identical conditions.
3. Characterization of catalysts
IR spectra were recorded in KBr on a Shimadzu IR Afinity1. SEM images were obtained from a Hitachi S-4800 microscope at an operating voltage of 15 kV. The sample was coated with platinum for effective imaging before being charged. TEM images were obtained from a JEOL instrument using a Cu grid. UV-vis + DRS and fluorescence data were recorded using a UV-vis spectrophotometer (Shimadzo UV-2550) using standard 1 cm quartz cuvettes and a Fluoromax-4 spectrofluorometer (Horiba Jobin YVON) respectively. X-ray powder diffraction study was carried out on a Rigaku X-ray diffractometer at a voltage of 10 kV using Cu Kα radiation (λ = 0.15418 nm) at a scanning rate of 0.50° per minute in the 2θ range 10–80°. Surface analysis by XPS is accomplished by irradiating a sample with monoenergetic soft X-rays, Mg Kα (1253.6 eV) using the ESCA probe TPD system in an ultra-high vacuum system. TGA experiments were carried out using a SDT Q600. BET measurements were performed using a Smart Instruments Smart Sorb 92/93.3.1 X-ray diffraction (XRD)
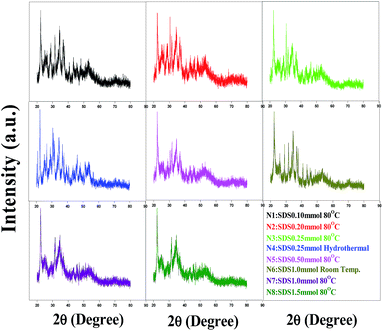
Powder XRD patterns of the Ag–In–Ni–S nanocomposites prepared at different temperatures with SDS concentration variation are shown in Fig. 1. The XRD patterns reveal that the samples are composites of binary and ternary chalcogenides. On comparison with the patterns of the individual metal sulphides, it can be seen that samples N1, N2, N3 and N4 are AgInS2-rich and In2S3-rich. When the synthesis was carried out at room temperature (N6), mostly individual metal sulphides were formed. Samples N5 and N7 show similar types of diffraction peaks. For N8, the weak and diffuse peaks at (2θ) 56–60° are mainly due to binary chalcogenides (Ag2S, NiS2 and In2S3) whereas the intense peaks located at 28.43, 43.9, 48.0 and 53.44° are due to the presence of a combination of binary and ternary chalcogenides. On comparison of the XRD patterns of all samples (ESI, Fig. S1†) it was found that the temperature had a significant influence on the formation of binary and ternary chalcogenides. At relatively low temperatures, binary chalcogenide formation is more favourable than multinary chalcogenides.17 Detailed quantitative analysis results (RIR) for N8 are reported in Table S2, ESI.† It is also understandable from the XRD patterns that the different concentrations of SDS help the formation of individual metal sulphides differently.3.2 Infrared spectroscopy (FT-IR)
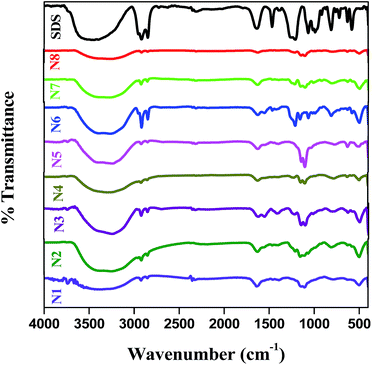
FT-IR spectra of all the produced Ag–In–Ni–S nanocomposites are shown in Fig. 2. All the samples show peaks at ∼3250–3350, 1640, 1200 and 800 cm−1. A weak metal–sulphur band can be seen in the spectrum in the range 550–400 cm−1 together with the surface bonded SDS characteristic peaks in the regions of 1500–1000 and 3200–3400 cm−1. A peak shift was observed for all the samples when compared to blank SDS. This might be due to surface interaction of SDS with the samples.3.3 The morphologies of Ag–In–Ni–S using FE-SEM
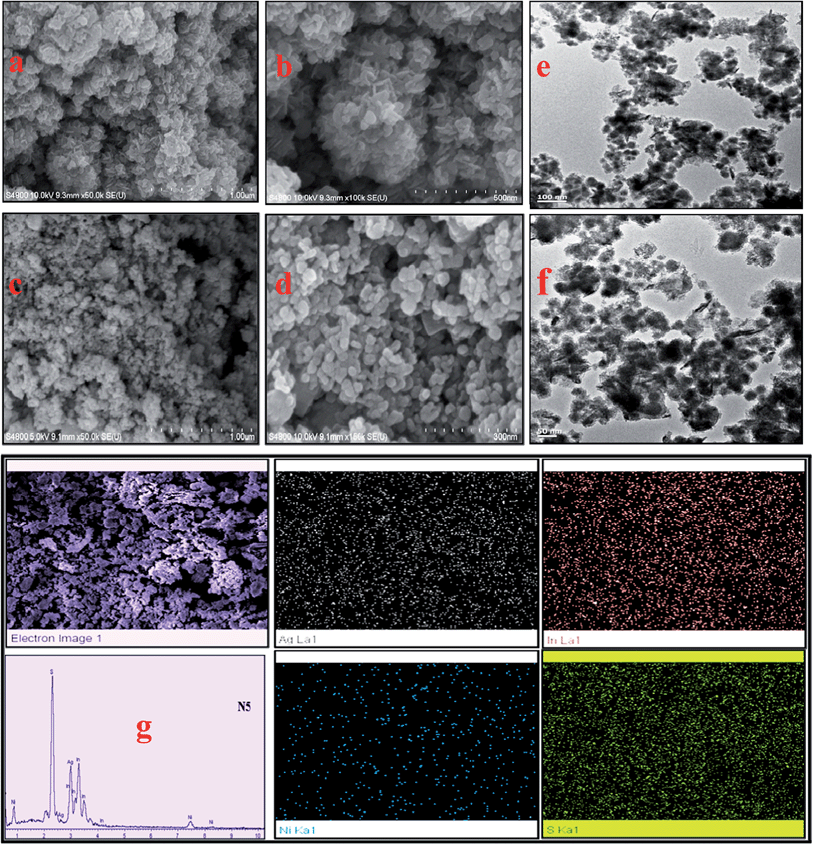
The morphologies of the Ag–In–Ni–S nanocomposites were then studied using FE-SEM. Samples N5 and N8 are used as examples to present the morphology. Both samples show uniform distributions of nanoclusters (Fig. 3a). At higher magnification, a large number of particles of nearly identical shape and size are observed (Fig. 3b–f). N1, N2 and N3, prepared at 80 °C using SDS ≤ 0.25 mmol, show uniform distributions of identical nanospheres (ESI, Fig. S2a–c†). These nanospheres are converted to a network type structure (N4) when synthesized under hydrothermal conditions at 130 °C (ESI, Fig. S2d and e†). Sample N6 prepared at room temperature shows mixed morphology (ESI, Fig. S2f and g†). Upon increasing the SDS concentration, the spheres are converted to flake-like structures (Fig. 3, N5 and N8). The EDX results of all the samples confirmed that Ag, In, Ni and S were present in the nanocomposites (Fig. S3, ESI†). To advance our study, the spatial regularity of the elemental distribution of N5 was measured and the composition was found to be AgIn1.05Ni0.53S2.66 (ESI, Table S3†). The EDX elemental mapping and line scanning further indicated the homogeneous distribution of Ag, In, Zn and S elements throughout the whole sample (Fig. 3g).3.4 X-ray photoelectron spectroscopy (XPS) study
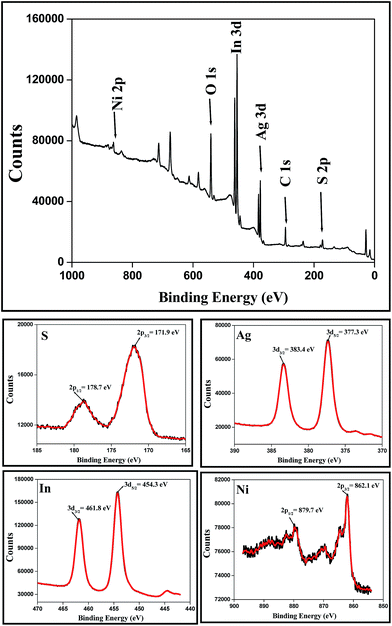
In order to determine the valence states of the constituent elements, sample N8 was examined by X-ray photoelectron spectroscopy (XPS). XPS spectra of Ag–In–Ni–S nanocomposites are shown in Fig. 4. The valence states of Ag, In and Ni were determined as Ag+, In3+ and Ni2+ respectively, according to their peak splitting values which were assigned as 377.3 (3d5/2) and 383.4 (3d3/2) for Ag; 454.3 (3d5/2) and 461.8 (3d3/2) for In; 862.1 (2p3/2) and 879.7 eV (2p1/2) for Ni from the fitting data. The two peak of S, 171.9 (2p3/2) and 178.7 (2p1/2), suggest that it has sulphide states. The wide range (172–179 eV) of sulphide clearly indicates that the nanocomposite is composed of both binary and ternary chalcogenides.3.5 Spectral study of Ag–In–Ni–S
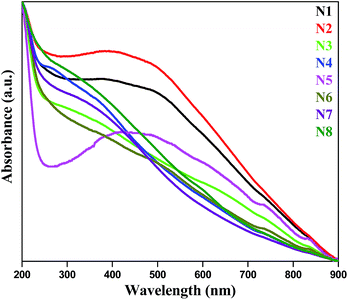
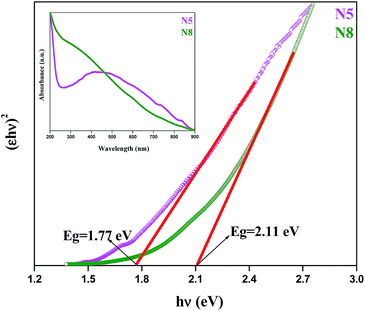
For UV-vis study, 1 mg of each prepared sample was dispersed in 10 mL water under sonication. All eight samples give similar spectra (Fig. 5). There is no characteristic peak observed. From the UV-vis spectra, the direct band gap was measured with the help of this power equation18versus photon energy (hν):| (εhν)n = kd(hν − Eg) |
Fig. 6 shows the (εhν)2versus hν curves of samples N5 and N8, where ε is the absorbance coefficient, h the Planck constant and ν the frequency. The direct band gaps (Eg) of N5 and N8 were found to be 1.77 eV and 2.11 eV respectively.
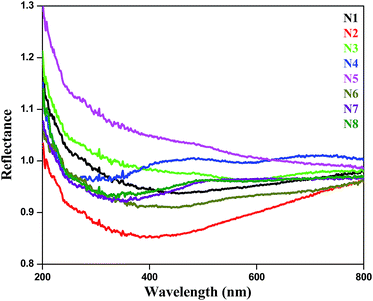
Diffuse reflectance spectroscopy (DRS) was carried out taking barium sulphate as reference (Fig. 7). Almost all the samples exhibit high absorption in the UV-visible region (200–800 nm). The absorption edges at 510 nm and 496 nm were found for samples N7 and N8 respectively. This result further confirmed our observation that these composites may be suitable candidates for photocatalysis under visible light.
3.6 BET measurement: surface area analysis
The nitrogen adsorption–desorption isotherms were measured using a Smart Instrument, Model no-Smart Sorb 92/93, to determine the surface area of the Ag–In–Ni–S nanocomposites. For this measurement samples were regenerated at 250 °C for two hours. Experiments were performed using a N2 (30%) and He (70%) mixture. N3, N5 and N8 show surface area values of 29.57, 43.58 and 60.97 m2 g−1 respectively. From these results, it is clear that with the increase in SDS concentration, the surface area of the nanocomposites increases. The increase in surface area is believed to increase the catalytic activity of the nanocomposites.3.7 Thermogravimetric analysis (TGA)
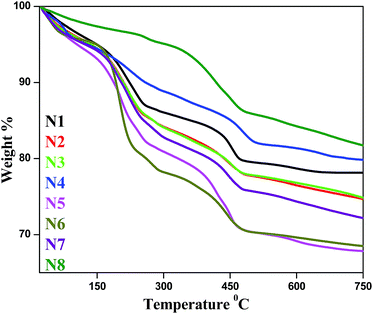
The thermal stability of the Ag–In–Ni–S nanocomposites was measured using TGA (Fig. 8). All samples were heated to 750 °C with a heating rate of 10 °C min−1. The initial weight loss below 200 °C is due to the loss of physisorbed moisture. The second weight loss step occurred between 210 °C and 220 °C and the third weight loss step occurred between 270 °C and 287 °C. The 2nd and 3rd step decay indicates the weight loss due to organics (surface bonded SDS) whereas the decay above 450 °C might be due to sublimation of metal sulphides. As evident from the TGA curves, N8 shows maximum stability while N5 is the least stable.3.8 Degradation of methylene blue
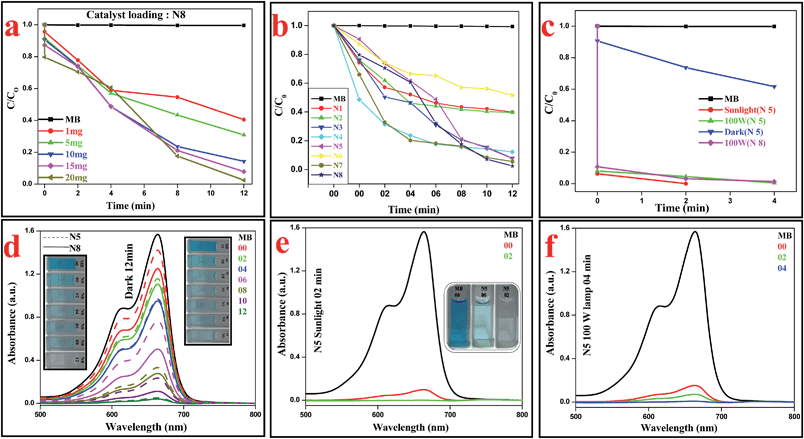
MB, a stable dye, has a characteristic absorption band at 663 nm, which is employed to assess the degradation of Ag–In–Ni–S nanocomposites. Optimization of catalyst loading in the presence of different amounts of N8 (1 mg, 5 mg, 10 mg, 15 mg and 20 mg) was performed (Fig. 9a) in dark conditions. During the initial stage of the study in the presence of 1 mg N8, only 60% degradation was achieved. 70% and 86% MB was consumed when the degradation was performed with 5 mg and 10 mg of N8. Upon increasing the catalyst loading to 15 mg, the decomposition rate increased to 92%. On further increase of the catalyst loading to 20 mg, almost quantitative degradation took place in 12 min in dark conditions. All the reactions were performed using the above optimized conditions. As shown in Fig. S4a (ESI),† the concentrations of MB remain almost constant (99.4%) throughout the experiment in the absence of catalyst. In order to check the efficacy, we started our experiment with N1–N7. N1 and N2 show slow decomposition of MB (ESI, Fig. S4b and c†) whereas N3, N4, N5 and N7 show moderate to good catalytic activities (ESI, Fig. S4d–h†). Among all of the samples, N6 is found to have the least decomposition ability (ESI, Fig. S4g†) whereas N8 has the highest catalytic activity and almost 98% MB is decomposed within 12 min of reaction in dark conditions (Fig. 9d). The colour changes from blue to colourless also confirm our observation (inset, Fig. 9d). N5 and N8 were also found to be equally effective for Nile blue under a 100 W lamp (ESI, Fig. S5a–c†).When the same set of reactions was performed under incandescent light and in sunlight in the presence of N5 and N8, very fast degradation of MB was observed. N5 and N8 under a 100 W lamp consumed MB almost quantitatively with a slightly longer time (4 min) compared to sunlight (2 min). The variations of methylene blue concentration (C/C0) with time over different catalysts are given in Fig. 9b, where C0 is the initial MB concentration before reaction and C is the MB concentration at time t. It is evident from Table 1 and Fig. S6a (ESI†) that the degradation of MB in the presence of catalysts is a pseudo-first order reaction and it follows the trend N8 > N7 > N5 ∼ N3 > N4 > N2 ∼ N1 > N6. A comparative study of decomposition activity for N5 and N8 (Fig. 9c) under various conditions confirmed that N5 and N8 are very active catalysts under visible light as well under dark conditions.
| Entry | Catalyst | C t=4 min | C t=10 min | C 0 | Rate constant (min−1) | |
|---|---|---|---|---|---|---|
| t = 4 min | t = 10 min | |||||
| 1 | N1 | 0.818 | 0.661 | 1.569 dark conditions | 0.16283 | 0.08644 |
| 2 | N2 | 0.722 | 0.633 | 0.19404 | 0.09077 | |
| 3 | N3 | 0.730 | 0.243 | 0.19128 | 0.18651 | |
| 4 | N4 | 0.371 | 0.225 | 0.36049 | 0.19420 | |
| 5 | N5 | 0.967 | 0.235 | 0.12099 | 0.18986 | |
| 6 | N6 | 1.043 | 0.882 | 0.10208 | 0.05760 | |
| 7 | N7 | 0.318 | 0.131 | 0.39903 | 0.24829 | |
| 8 | N8 | 0.951 | 0.112 | 0.12516 | 0.26396 | |
| 9 | N5 (100 W) | 0.071 (2 min) | 1.569 visible light | 1.547 | ||
| 10 | N8 (100 W) | 0.049 (2 min) | 1.733 | |||
3.9 Towards mechanistic study
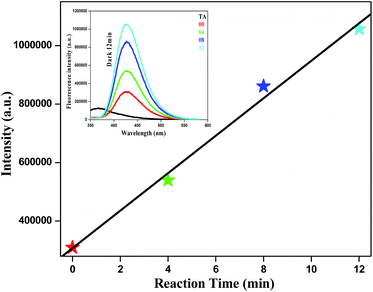
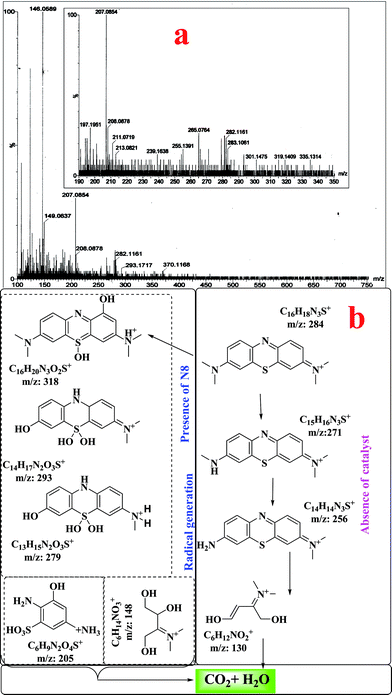
While designing the catalyst, it was thought that the degradation of organic dye would occur via radical formation. An electron paramagnetic resonance (EPR) study showed that the catalyst is “EPR-silent” because it is a non-Kramers system.19 Direct detection of reactive oxygen species (ROS) is not feasible due to their very short lifetime. Therefore, indirect measurement of ROS was performed using terephthalic acid (TA) and non-fluorescent dihydrorhodamine 123 (DHR123).20 TA is a non-fluorescent compound which upon reaction with OH radical is converted to fluorescent 2-hydroxyl terephthalic acid (HTA). The gradual increase in fluorescence intensity at λem = 426 nm with progress of reaction time confirms the formation of OH radicals. A linear characteristic was observed for a plot of the fluorescence intensity versus reaction time. The inset gives the fluorescent spectra at different time intervals in the presence of N8 in dark conditions (Fig. 10). Superoxide formation was also confirmed using non-fluorescent DHR123 as a ROS tracking agent (ESI, Fig. S7†).ESI-mass spectral studies were carried out to analyze the intermediates formed during the degradation of methylene blue. The molecular ion peak for MB (without catalyst) was obtained at m/z = 284 (ESI, Fig. S8†). The peak at m/z = 270 corresponds to loss of methyl groups from MB. The peaks at m/z = 318–319, 293 and 279 are due to consecutive additions of hydroxyl in the MB molecule (Fig. 11a). The breaking of the MB molecule was suggested by the presence of peaks at m/z = 205–207, 146–149. From the mass analysis the degradation pathway is shown in Fig. 11b. Detection of hydroxylated intermediates in the ESI-MS study also confirmed that photodegradation of MB in the presence of N8 proceeded through a hydroxyl radical mechanism which was also confirmed by the results of TA and DHR123 treatment.
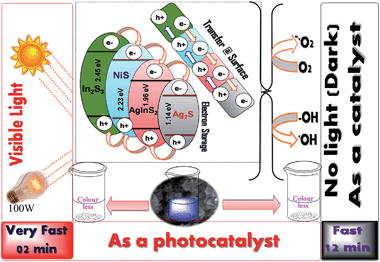
In order to evaluate the active component of the catalysts, various control experiments were performed. Initially, we performed this reaction in the presence of the individual metal sulphides (Ag2S and NiS) which were found to be poor catalysts (ESI, Fig. S6b and c†) in the absence of light. From a literature survey,21 it is also evident that In2S3 can act as photocatalyst in the presence of visible light for a longer time. No report was found for the same in dark conditions. We also performed this reaction in dark conditions to evaluate the activity of In2S3, and it was found to be poor. This supports the conclusion that the degradation of MB was due to a synergistic effect of the nanocomposites and not due to the individual components. It is believed that the electron storage properties of Ag helps in shifting of the apparent Fermi level of the composite towards more negative potential and makes it more reductive photocatalyst. This reductive nature of the photocatalyst supplies electrons even in dark conditions, which are dissipated across the surface resulting in the formation of ROS which is also confirmed from the terephthalic acid treatment. The photo-induced electron–hole pair generation is faster in the presence of different multinary semiconductor chalcogenides, one or of which more may act as co-catalysts in this process. The scavenging of holes in the presence of S2−/Sn2− redox couples is reasonably effective in scavenging the holes from the nanocomposites to maintain their stability throughout the experiments.22
Based on our control experiments and observations for ROS generation, a mechanistic diagram was proposed (Fig. 12), where the electron storage behaviour of silver can promote the formation of electron–hole pairs even in the absence of light. The generation of electron–hole pairs under visible light is faster. The surface transfer process of the electron–hole pairs over the coupled semiconductor nanocomposites makes them more suitable for the generation of ROS. These generated ROS are responsible for the degradation of MB.
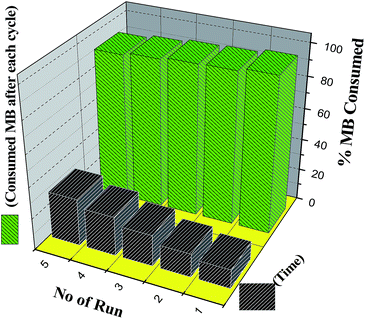
Finally, reusability of the catalysts was examined in dark conditions for samples N5 and N8 (Fig. 13). After completion of each cycle, the catalyst was collected by centrifugation, washed several times with ethanol and water and finally dried under vacuum and reused for the next run. The recycled catalyst took slightly longer time to decompose MB completely. We also compared our results with reported Ag based catalysts (Table S5, ESI†). It is found that the Ag–In–Ni–S nanocomposites are efficient active catalysts under both dark and visible light conditions. PXRD, TGA, IR and SEM of reused catalysts were compared (Fig. S9, ESI†) with those of a fresh sample. The results substantiate that there were no structural and morphological changes after five cycles of use.
4. Conclusions
We have developed a simple and green protocol for the synthesis of Ag–In–Ni–S nanocomposites using thioacetamide as the sulphur source in water with variation of SDS concentration and temperature.The XRD analysis showed that Ag–In–Ni–S is a composite of binary and ternary chalcogenides. The FE-SEM and EDX analyses indicated uniform size and elemental distributions in all the samples. XPS analysis confirmed that Ag+, In3+, Ni2+ and S2− are present in the nanocomposites. The wide binding energy range of sulphide clearly indicated the presence of both binary and ternary chalcogenides. UV-vis and DRS reflectance spectra suggested that the samples are capable of absorbing visible light. We explored the catalytic activities via methylene blue degradation under darkness and visible light. The synergistic effect of nanocomposites promotes the generation of ROS for the fast degradation of dye in darkness (12 min) and under visible light (sunlight: 2 min, 100 W lamp: 4 min). The decomposed intermediates were identified with the help of ESI-MS analysis. The fast decomposition of MB under light and darkness (day and night) is especially important in the context of waste water treatment targeting the colored effluents of the dye industry, for instance. Moreover, the protocol follows some tenets of “green chemistry” with respect to synthesis steps, solvent used and catalytic applications.
Acknowledgements
A.M and M.S are thankful to IIT Patna for their research fellowship. The authors are also thankful to Prof. T. Pradeep and P. Gautham for XPS analysis and Department of Science and Technology India for research grant no. SR/FT/CS-093/2009. The authors are thankful to the anonymous reviewers for their constructive suggestions.Notes and references
- A. Fujishima and K. Honda, Nature, 1972, 238, 37–38 CrossRef CAS PubMed.
- (a) Y. K. Lai, J. Y. Huang, H. F. Zhang, V. P. Subramaniam, Y. X. Tang, D. G. Gong, L. Sun, L. Sundar, Z. Chen and C. Lin, J. Hazard. Mater., 2010, 184, 855–863 CrossRef CAS PubMed; (b) N. Wang, X. Li, Y. Wang, X. Quan and G. Chen, Chem. Eng. J., 2009, 146, 30–35 CrossRef CAS PubMed; (c) O. K. Varghese, M. Paulose, T. J. LaTempa and C. A. Grimes, Nano Lett., 2009, 9, 731–737 CrossRef CAS PubMed; (d) W. Zhao, W. Ma, C. Chen, J. Zhao and Z. Shuai, J. Am. Chem. Soc., 2004, 126, 4782–4783 CrossRef CAS PubMed.
- S. Guo, S. Han, H. Mao, S. Dong, C. Wu, L. Jia, B. Chi, J. Pu and J. Li, J. Power Sources, 2014, 245, 979–985 CrossRef CAS PubMed.
- J. Xia, J. Di, S. Yin, H. Xu, J. Zhang, Y. Xu, L. Xu, H. Li and M. Ji, RSC Adv., 2014, 4, 82–90 RSC.
- (a) C. Zhang, L. Ai, L. Li and J. Jiang, J. Alloys Compd., 2014, 582, 576–582 CrossRef CAS PubMed; (b) J. Shua, Z. Wanga, G. Xia, Y. Zheng, L. Yang and W. Zhang, Chem. Eng. J., 2014, 252, 374–381 CrossRef PubMed.
- (a) J. Yu, J. Jin, B. Cheng and M. Jaroniec, J. Mater. Chem. A, 2014, 2, 3407–3416 RSC; (b) X. Wanga, W.-C. Peng and X.-Y. Li, Int. J. Hydrogen Energy, 2014, 39, 13454–13461 CrossRef PubMed; (c) K. Chang, Z. W. Mei, T. Wang, Q. Kang, S. X. Ouyang and J. H. Ye, ACS Nano, 2014, 8, 7078–7087 CrossRef CAS PubMed; (d) I. Kornarakis, I. N. Lykakis, N. Vordos and G. S. Armatas, Nanoscale, 2014, 6, 8694–8703 RSC; (e) I. J.-L. Plante, A. Teitelboim, I. Pinkas, D. Oron and T. Mokari, J. Phys. Chem. Lett., 2014, 5, 590–596 CrossRef; (f) Y. Shi, Y. Chen, G. Tian, H. Fu, K. Pan, J. Zhou and H. Yan, Dalton Trans., 2014, 43, 12396–12404 RSC; (g) L. Ye, J. Fu, Z. Xu, R. Yuan and Z. Li, ACS Appl. Mater. Interfaces, 2014, 6, 3483–3490 CrossRef CAS PubMed.
- (a) B. Chai, J. Li, Q. Xu and K. Dai, Mater. Lett., 2014, 120, 177–181 CrossRef CAS PubMed; (b) L.-Y. Chen and W.-D. Zhang, Appl. Surf. Sci., 2014, 301, 428–435 CrossRef CAS PubMed; (c) M. Shi, J. Shen, H. Ma, Z. Li, X. Lu, N. Li and M. Ye, Colloids Surf., A, 2012, 405, 30–37 CrossRef CAS PubMed; (d) D. Fu, G. Han, Y. Chang and J. Dong, Mater. Chem. Phys., 2012, 132, 673–681 CrossRef CAS PubMed; (e) W. Ming Yan, H. J. Rao, T. Zhi-Wei, L. Wei-Hua and C. Jun, J. Alloys Compd., 2013, 568, 26–35 CrossRef PubMed; (f) Y. Fu and X. Wang, Ind. Eng. Chem. Res., 2011, 50, 7210–7218 CrossRef CAS; (g) Y. Fu, Q. Chen, M. He, Y. Wan, X. Sun, H. Xia and X. Wang, Ind. Eng. Chem. Res., 2012, 51, 11700–11709 CrossRef CAS.
- (a) Q. Liu, Y. Zhou, J. Kou, X. Chen, Z. Tian, J. Gao, S. Yan and Z. Zou, J. Am. Chem. Soc., 2010, 132, 14385–14387 CrossRef CAS PubMed; (b) L. J. Zhang, T. F. Xie, D. J. Wang, S. Li, L. L. Wang, L. P. Chen and Y. C. Lu, Int. J. Hydrogen Energy, 2013, 38, 11811–11817 CrossRef CAS PubMed; (c) L. Ren, F. Yang, Y.-R. Deng, N.-N. Yan, S. Huang, D. Lei, Q. Sun and Y. Yu, Int. J. Hydrogen Energy, 2010, 35, 3297–3305 CrossRef CAS PubMed.
- (a) B. Murali, M. Madhuri and S. B. Krupanidhi, Cryst. Growth Des., 2014, 14, 3685–3691 CrossRef CAS; (b) Y. A. Douri, Q. Khasawneh, S. Kiwan, U. Hashim, S. B. A. Hamid, A. H. Reshak, A. Bouhemadou, M. Ameri and R. Khenata, Energy Convers. Manage., 2014, 82, 238–243 CrossRef PubMed; (c) R. Lindblad, D. Bi, B.-w. Park, J. Oscarsson, M. Gorgoi, H. Siegbahn, M. Odelius, E. M. J. Johansson and H. Rensmo, J. Phys. Chem. Lett., 2014, 5, 648–653 CrossRef CAS; (d) S. Ito, S. Tanaka, K. Manabe and H. Nishino, J. Phys. Chem. C, 2014, 118, 16995–17000 CrossRef CAS; (e) R. Sahaya, J. Sundaramurthya, P. S. Kumara, V. Thavasi, S. G. Mhaisalkara and S. Ramakrishna, J. Solid State Chem., 2012, 186, 261–267 CrossRef PubMed.
- (a) J. Kolny-Olesiak and H. Weller, ACS Appl. Mater. Interfaces, 2013, 5, 12221–12237 CrossRef CAS PubMed; (b) L. Sójka, Z. Tang, D. Furniss, H. Sakr, A. Oladeji, E. Bereś-Pawlik, H. Dantanarayana, E. Faber, A. B. Seddon, T. M. Benson and S. Sujecki, Opt. Mater., 2014, 36, 1076–1082 CrossRef PubMed; (c) H. C. Yoon, J. H. Oh, M. Ko, H. Yoo and Y. R. Do, ACS Appl. Mater. Interfaces, 2015, 7, 7342–7350 CrossRef CAS PubMed.
- (a) A. Deshpande, S. Kelkar, S. Rayalu and S. Ogale, J. Mater. Chem. A, 2014, 2, 492–499 RSC; (b) S. Kelkar, C. Ballal, A. Deshpande, S. Warule and S. Ogale, J. Mater. Chem. A, 2013, 1, 12426–12431 RSC; (c) M. Moriya, T. Minegishi, H. Kumagai, M. Katayama, J. Kubota and K. Domen, J. Am. Chem. Soc., 2013, 135, 3733–3735 CrossRef CAS PubMed; (d) L. Zhang, T. Minegishi, J. Kubota and K. Domen, Phys. Chem. Chem. Phys., 2014, 16, 6167–6174 RSC; (e) C. Yang, M. Qin, Y. Wang, D. Wan, F. Huang and J. Lin, Sci. Rep., 2013, 3, 1286 Search PubMed; (f) L. Wei, Y. Chen, Y. Lin, H. Wu, R. Yuan and Z. Li, Appl. Catal., B, 2014, 144, 521–527 CrossRef CAS PubMed.
- (a) D. Chakravarty and D. J. Late, RSC Adv., 2015, 5, 21700–21709 RSC; (b) H. Chauhan, M. K. Singh, S. A. Hashmi and S. Deka, RSC Adv., 2015, 5, 17228–17235 RSC; (c) H. Peng, G. Ma, K. Sun, J. Mu, H. Wang and Z. Lei, J. Mater. Chem. A, 2014, 2, 3303–3307 RSC; (d) I. B. Assaker, M. Gannouni, A. Lamouchi and R. Chtourou, Superlattices Microstruct., 2014, 75, 159–170 CrossRef CAS PubMed.
- (a) B. Hu, L.-H. Wu, S.-J. Liu, H.-B. Yao, H.-Y. Shi, G.-P. Li and S.-H. Yu, Chem. Commun., 2010, 46, 2277–2279 RSC; (b) Y. Wen, H. Ding and Y. Shan, Nanoscale, 2011, 3, 4411–4417 RSC; (c) Y. Yan, H. Sun, P. Yao, S.-Z. Kang and J. Mu, Appl. Surf. Sci., 2011, 257, 3620–3626 CrossRef CAS PubMed; (d) J.-K. Liu, C.-X. Luo, J.-D. Wang, X.-H. Yang and X.-H. Zhong, CrystEngComm, 2012, 14, 8714–8721 RSC; (e) Q. Chen, H. Shi, W. Shi, Y. Xu and D. Wu, Catal. Sci. Technol., 2012, 2, 1213–1220 RSC; (f) F. Jia, Z. Yao and Z. Jiang, Int. J. Hydrogen Energy, 2012, 37, 3048–3055 CrossRef CAS PubMed; (g) A. Pourahmad, Superlattices Microstruct., 2012, 52, 276–287 CrossRef CAS PubMed; (h) Y. Zheng and A. Wang, J. Mater. Chem., 2012, 22, 16552–16559 RSC; (i) L. Zhu, B. Wei, L. Xu, Z. Lü, H. Zhang, H. Gao and J. Che, CrystEngComm, 2012, 14, 5705–5709 RSC; (j) C. Zeng, B. Tian and J. Zhang, J. Colloid Interface Sci., 2013, 405, 17–21 CrossRef CAS PubMed; (k) B. Jiang, Z. Hou, C. Tian, W. Zhou, X. Zhang, A. Wu, G. Tian, K. Pan, Z. Ren and H. Fu, CrystEngComm, 2013, 15, 5821–5827 RSC; (l) L. Wang, N. Li, Q. Zhang, S. Lou, Y. Zhao, M. Chen and F. Teng, CrystEngComm, 2014, 16, 9326–9330 RSC; (m) D. Marcinkowski, M. Wałęsa-Chorab, V. Patroniak, M. Kubicki, G. Kądziołka and B. Michalkiewicz, New J. Chem., 2014, 38, 604–610 RSC; (n) Z. Wei, L. Feng, J. Zhi-Ming, S. Xiao-Bo, Y. Peng-Hui, W. Xue-Ren, S. Cheng, G. Zhan-Qi and L. Liang-Sheng, J. Mater. Chem. A, 2014, 2, 13226–13231 RSC; (o) Z. Jiang, D. Liu, D. Jiang, W. Wei, K. Qian, M. Chen and J. Xie, Dalton Trans., 2014, 43, 13792–13802 RSC; (p) C. Han, L. Ge, C. Chen, Y. Li, Z. Zhao, X. Xiao, Z. Li and J. Zhang, J. Mater. Chem. A, 2014, 2, 12594–12600 RSC.
- (a) J. Li, S. K. Cushing, J. Bright, F. Meng, T. R. Senty, P. Zheng, A. D. Bristow and N. Wu, ACS Catal., 2013, 3, 47–51 CrossRef CAS; (b) L. Sun, R. Zhang, Y. Wang and W. Chen, ACS Appl. Mater. Interfaces, 2014, 6, 14819–14826 CAS; (c) M. Zhu, P. Chen and M. Liu, ACS Nano, 2011, 5, 4529–4536 CrossRef CAS PubMed.
- (a) M. Anpo and M. Takeuchi, J. Catal., 2003, 216, 505–516 CrossRef CAS; (b) J. W. Wang, B. D. Mao, J. L. Gole and C. Burda, Nanoscale, 2010, 2, 2257–2261 RSC; (c) S. In, A. Orlov, R. Berg, F. Garcia, S. Pedrosa-Jimenez, M. S. Tikho, D. S. Wright and R. M. Lambert, J. Am. Chem. Soc., 2007, 129, 13790–13791 CrossRef CAS PubMed; (d) S. Sakthivel and H. Kisch, Angew. Chem., Int. Ed., 2003, 42, 4908–4911 CrossRef CAS PubMed; (e) H. Zhang, G. Wang, D. Chen, X. J. Lv and J. H. Li, Chem. Mater., 2008, 20, 6543–6549 CrossRef CAS; (f) S. F. Chen, J. P. Li, K. Qian, W. P. Xu, Y. Lu, Q. X. Huan and S. H. Yu, Nano Res., 2010, 3, 244–255 CrossRef CAS.
- Q. W. Shu, J. Lan, M. X. Gao, J. Wang and C. Z. Huang, CrystEngComm, 2015, 17, 1374–1380 RSC.
- J. K. Olesiak and H. Weller, ACS Appl. Mater. Interfaces, 2013, 5, 12221–12237 Search PubMed.
- (a) M. Yoon, M. Seo, C. Jeong, J. H. Jang and K. S. Jeon, Chem. Mater., 2005, 17, 6069–6079 CrossRef CAS; (b) M. Ge, L. Liu, W. Chen and Z. Zhou, CrystEngComm, 2012, 14, 1038–1044 RSC.
- J. Krzystek, J.-H. Park, M. W. Meisel, M. A. Hitchman, H. Stratemeier, L.-C. Brunel and J. Telser, Inorg. Chem., 2002, 41, 4478–4487 CrossRef CAS PubMed.
- (a) K. I. Ishibashi, A. Fujishima, T. Watanabe and K. Hashimoto, Electrochem. Commun., 2000, 2, 207–210 CrossRef CAS; (b) S. Singh, A. C. Chakraborty, V. Singh, A. Molla, S. Hussain, M. K. Singh and P. Das, Phys. Chem. Chem. Phys., 2015, 17, 5973–5981 RSC; (c) A. Molla, M. Sahu, Y. Kumar and S. Hussain, RSC Adv., 2015, 5, 41941–41948 RSC.
- (a) S. Rengaraj, S. Venkataraj, C.-W. Tai, Y. Kim, E. Repo and M. Sillanp, Langmuir, 2011, 27, 5534–5541 CrossRef CAS PubMed; (b) G. Liu, X. Jiao, Z. Qin and D. Chen, CrystEngComm, 2011, 13, 182–187 RSC.
- P. V. Kamat, J. Phys. Chem. Lett., 2012, 3, 663–672 CrossRef CAS and references cited therein.
Footnote |
| † Electronic supplementary information (ESI) available. See DOI: 10.1039/c5ta02888d |
| This journal is © The Royal Society of Chemistry 2015 |

