 Open Access Article
Reaction mechanism from quantum molecular dynamics for the initial thermal decomposition of 2,4,6-triamino-1,3,5-triazine-1,3,5-trioxide (MTO) and 2,4,6-trinitro-1,3,5-triazine-1,3,5-trioxide (MTO3N), promising green energetic materials†
Cai-Chao
Ye
ab,
Qi
An
a,
Tao
Cheng
a,
Sergey
Zybin
a,
Saber
Naserifar
a,
Xue-Hai
Ju
b and
William A.
Goddard III
*a
aMaterials and Process Simulation Center, California Institute of Technology, 139-74, Pasadena, California 91125, United States. E-mail: wag@wag.caltech.edu
bKey Laboratory of Soft Chemistry and Functional Materials of MOE, School of Chemical Engineering, Nanjing University of Science and Technology, Nanjing 210094, P. R. China
First published on 24th April 2015
Abstract
Klapötke and co-workers recently designed two new materials, 2,4,6-triamino-1,3,5-triazine-1,3,5-trioxide (MTO) and 2,4,6-trinitro-1,3,5-triazine-1,3,5-trioxide (MTO3N), envisioned as candidates for green high-energy materials. However, all attempts at synthesis have failed. In order to validate the expected properties for these systems and to determine why these materials are too unstable to synthesize, we used the PBE flavor of Density Functional Theory (DFT) to predict the crystal structures for MTO and MTO3N and then we carried out DFT molecular dynamics simulations (DFT-MD) to determine the initial reaction mechanisms for decomposition. Klapötke estimated that MTO would have a density of ρ = 1.859 g cm−3 with an estimated detonation velocity (Dv) of 8.979 km s−1, making it comparable to RDX (ρ = 1.82 g cm−3, Dv = 8.75 km s−1) and β-HMX (ρ = 1.91 g cm−3, Dv = 9.10 km s−1). His estimated impact sensitivity >30 J, make it much better than HMX (7 J) and RDX (7.5 J). Our predicted crystal structure for MTO (P2(1) space group) leads to ρ = 1.859 g cm−3, in good agreement with expectations. Our DFT-MD studies find that the first step in the decomposition of MTO is intermolecular hydrogen-transfer reaction (barrier 3.0 kcal mol−1) which is followed quickly by H2O and NO release with reaction barriers of 46.5 and 35.5 kcal mol−1. In contrast for MTO3N (P2(1)/c predicted space group), we find that the first steps are a bimolecular decomposition to release NO2 (ΔH = 44.1 kcal mol−1, ΔG = 54.7 kcal mol−1) simultaneous with unimolecular NO2 cleavage (ΔH = 59.9 and ΔG = 58.2 kcal mol−1) a unique initial reaction among EMs. These results suggest that MTO3N would be significantly more thermally stabile (barrier > 6.0 kcal mol−1 higher) than RDX and HMX, making it an excellent candidate to be insensitive new green energetic materials. However we find that MTO leads to very favorable hydrogen transfer reactions that may complicate synthesis and crystallization, making MTO3N the more promising system.
1. Introduction
Environmental concerns about current energetic materials (EM) make the development of green EM a high priority.1 Moreover developing safe and efficient high-energy content materials is of vital importance to utilization in civil applications as propellants in satellite launch rockets, satellite propulsions system, and naval systems.1,2 An ideal green explosive should have higher velocity of detonation, higher detonation pressure, higher density, and lower sensitivity than benchmark explosives, such as RDX and HMX. Simultaneously it is important that the end products from detonation or combustion are environmentally friendly and that the syntheses not yield toxic or non-green materials that must be disposed. For this reason Klapötke et al. designed 2,4,6-triamino-1,3,5-triazine-1,3,5-trioxide (MTO) and 2,4,6-trinitro-1,3,5-triazine-1,3,5-trioxide (MTO3N) as potential new green energetic materials and estimated that velocity of detonation would be 8.979 km s−1 (compare to 8.855 km s−1 for RDX and 9.247 km s−1 for β-HMX) with density is 1.9 g cm−3 and impact sensitivity > 30 J, much better than HMX (7 J) and RDX (7.5 J).3However, numerous attempts to synthesize MTO and MTO3N have not yet been successful. In order to predict more accurately the properties and to understand the stability, we recently predicted4 the crystal packing and cohesive energy of MTO and MTO3N using Monte Carlo simulated annealing methods5 with the PBE flavor of Density functional Theory6 (DFT) (including the low gradient London dispersion correction)7 (PBE-ulg) to find that MTO has the P2(1) space group with 2 molecules per cell and a density of 1.859 g cm−3, while MTO3N has the P2(1)/c space group with 4 molecules per cell and a density of 2.016 g cm−3. The two molecules and crystal structures are shown in Fig. 1.
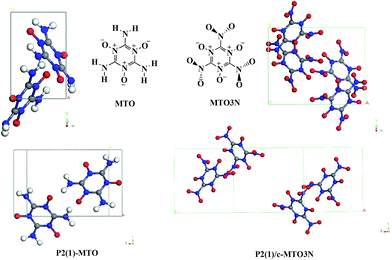 | ||
| Fig. 1 2,4,6-Triamino-1,3,5-triazine-1,3,5-trioxide (MTO) and 2,4,6-trinitro-1,3,5-triazine-1,3,5-trioxide (MTO3N) molecular structures and their most stable crystal structures: P2(1) for MTO and P2(1)/c for MTO3N predicted from previous PBE DFT calculations.4 The C, O, N, H atoms are represented by grey, red, blue and white balls, respectively. | ||
In order to determine the energy release, detonation properties, and sensitivity of EMs, it is essential to determine the reaction mechanism for the initial steps leading to thermal decomposition.8–14 For such nitro-based EMs as TNT, RDX, HMX and CL-20, the initial decomposition at low pressure is unimolecular NO2 cleavage.15–20 However for hydrogen containing highly energetic materials such as RDX and HMX, Chakraborty et al.8,14,21 used DFT to show that intramolecular hydrogen transfer to form HONO provides a competitive first step for decomposition22–27 that dominates under high impact conditions.28 Since MTO has no –NO2 group available to cleave off NO2, and MTO3N has no hydrogen available to form HONO, their decomposition properties should be dramatically different (maybe better) than normal nitro-based explosives.
In this paper, we report the initial thermal decomposition reaction mechanisms of MTO and MTO3N using molecular dynamics simulations based on the PBE-ulg7 flavor of DFT. The PBE-ulg corrects the poor description of van der Waals attraction (London dispersion) in PBE.7 Here we consider MTO and MTO3N starting with their predicted most stable crystal structures (P2(1) for MTO and P2(1)/c for MTO3N).
2. Methodology
2.1. Quantum molecular dynamics simulation
In these DFT based molecular dynamics (MD) simulations, the interatomic forces were calculated in the framework of DFT,29,30 where exchange and correlation were treated with the generalized gradient approximation (GGA), using the PBE-ulg functional form.7The periodic DFT calculations were performed using the VASP package.31–34 For structure optimization we found that a kinetic energy cut-off of 500 eV for the plane wave expansions gives excellent convergence of the total energies, energy differences, and structural parameters. The same energy cut-offs were used in the DFT-MD calculations. Reciprocal space was sampled with the Γ-centered Monkhorst–Pack scheme using only the gamma point for the supercell calculations. The convergence criteria were set to a 1 × 10⁻⁶ eV energy difference for solving the electronic wave function and a 1 × 10⁻³ eV Å−1 force for geometry optimization. They were set to 1 × 10⁻⁵ eV energy difference for solving the electronic wave function and a 1 × 10⁻³ eV Å−1 force for DFT-MD simulation.
Two crystalline phases (MTO: P2(1) and MTO3N: P2(1)/c) were considered in the DFT-MD simulations. The MD considered 8 molecules per periodic cell, obtained by replicating the unit cell twice along the “a” and “b” directions for MTO and replicating the unit cell twice along the “c” direction for MTO3N. Then the structures for the supercells were optimized individually before molecule dynamics simulations. The two initial structures of MTO-P2(1) and MTO3N-P2(1)/c are shown in Fig. S1.†
The procedure for the DFT-MD cook-off simulations was as follows: first the systems were heated from 20 K to 300 K over a period of 2 ps and then equilibrated at 300 K for 1 ps using the NVT (constant volume, constant temperature and constant number of atoms) ensemble. Finally, we heated the system from 300 K to 3000 K uniformly over the period of 20 ps, but with the volume fixed. The time constant for the Nose–Hoover thermostat was set to 0.1 ps. We used a time step of 1 fs for integrating the equations of motion. To analyse the fragments during the simulation, we used a bond length cut-off of 1.5 times of the normal bond length, as are shown in the Table S1.†
2.2. Finite cluster calculation
To analyse the mechanisms for the reactions discovered during the periodic DFT-MD simulations, we extracted the molecule structures involved (generally bimolecular) in the reaction from the periodic DFT-MD trajectories and then carried out finite molecule calculations to locate the nearby transition state (TS) for gas phase reactions at the level of M06/6-311++G** using the Jaguar program.35 The TS's were validated to have only one negative eigenvalue for the Hessian. This was followed by intrinsic reaction coordinate (IRC) scans to connect the TS to nearby reactant and the product structures.36 To obtain free energies, we diagonalized the mass reduced Hessian to obtain the vibrational frequencies, with which we evaluated the thermodynamic properties at 298.15 K and 1 atm. All gas phase calculations were carried out using the Jaguar 8.2 package.353. Results and discussion
These DFT-MD simulations provide a very detailed, molecular-level description of the decomposition and reactions of MTO and MTO3N in the condensed phase. This information allows us to extract valuable information about the complex chemistry involved, including uni- and multi-molecular reactions.12 Our goal is to elucidate the reaction pathway as MTO and MTO3N decomposes and evolves to form intermediates that react with each other and with reactant to form eventually the final products observed theoretically and presumably experimentally. In this work, we focus on thermal decomposition of condensed phase MTO and MTO3N crystals, examining the initial reaction pathways to evaluate the stability of these two promising green energetic materials.3.1. MTO initial reaction
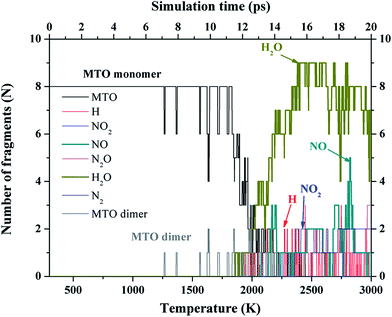
1. No reactions are observed from 0 to 7 ps (up to 1250 K).
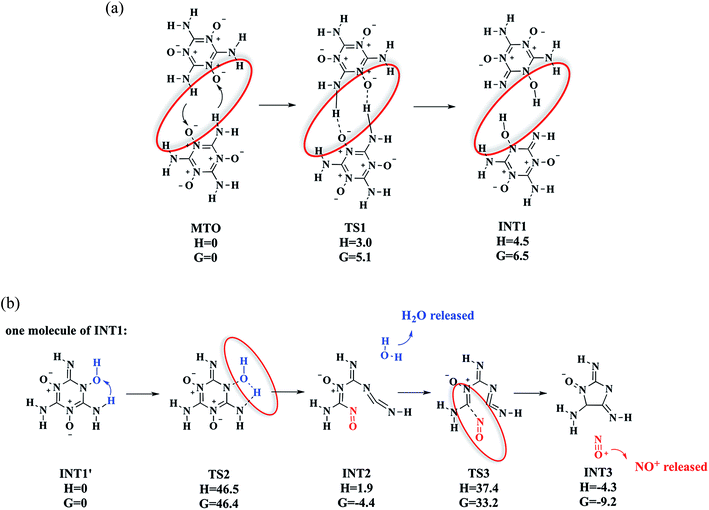
2. Simultaneous intermolecular H transfer between two MTO monomers is observed during the period 7 to 11 ps (up to 1700 K) to form the dimer containing adjacent NH and N–OH groups in place of NH2 and N–O−, with a structure similar to TS1 in Fig. 3.
3. Then, at 11.5 ps (∼1800 K) the first reaction occurs, a unimolecular reaction involving the intermediate formed in step 2 in which an NH2 transfer a hydrogen to the N–OH group to release H2O, leaving behind INT2 (Fig. 3) with an opened ring.
4. Later at 13 ps (∼2050 K), the first NO molecule is released from INT2.
Thus, we find that the unimolecular H2O release subsequent to H transfers between two monomers is the initial decomposition reaction for P2(1)-MTO. We will discuss these reaction mechanisms in more detail using finite cluster calculations. As the temperature continues to increase, we observe the release of increased numbers of H2O products.
3.1.2a. Intermolecular H transfer to form INT1 (MTO–TS1–INT1). We find that the first reaction is intermolecular hydrogen-transfer in which two MTO molecules each exchange one H atom with the other to form the intermediate INT1 (Fig. 3) viaTS1. This leads to a very low barrier of only ΔH = 3.0 kcal mol−1 (ΔG = 5.1 kcal mol−1), which is very fast in the QM-MD above 1250 K. Based on this barrier and we estimate that this should take place in a nanosecond at room temperature, suggesting that the crystallization must be done at low temperature (below 50 K). Although INT1 has an internal energy of 7.0 kcal mol−1, which is lower than the TS1 of 7.8 kcal mol−1 at zero temperature, we find that at room temperature INT1 has a higher enthalpy and free energy than the TS1.
3.1.2b. Decomposition of INT1′ to release H2O (INT1′–TS2–INT2 + H2O). After formation of the INT1′ (INT1 monomer) via the bimolecular H transfer from MTO, we find that one H atom of –NH2 transfers from the N atom to the nearby OH group viaTS2 to release one H2O molecule and INT2, with a barrier of ΔH = 46.5 kcal mol−1 (ΔG = 46.4 kcal mol−1), making it the rate-determining step (RDS) for decomposition. Indeed this is the first decomposition process we see in the DFT-MD on the periodic system (at ∼11.5 ps).
3.1.2c. Decomposition of INT2 to release NO+ (INT2–TS3–INT3 + NO+). Starting with INT2, the lowest energy pathway to eliminate the NO+ molecule is to break the C–N bond viaTS3 to form an intermediate INT3 (shown in Fig. 3), which we find to have a barrier of 35.5 kcal mol−1 above INT2. Indeed we see this process in the DFT-MD on the periodic system at 13 ps.
3.1.2d. MTO get one H+ from previous decomposed nearby fragments. Between 12.5 and 15.0 ps (2000 K and 2300 K) in the DFT-MD simulations on MTO crystal, we found intermediates INT4, INT5 and INT6 after the first H2O and NO releasing reaction, (shown in Fig. 4). The mechanism for forming these species is as follows. First, the MTO molecule adds a dissociated H+ from some previous decomposition to the O atom to form the intermediate INT4. Then starting from INT4, one H atom of –NH2 transfers viaTS4 to the nearby OH group to release one H2O molecule, forming INT5. This has a barrier of ΔH = 45.4 kcal mol−1 (ΔG = 44.4 kcal mol−1), making it the rate-determining step (RDS) for this decomposition pathway. Then from INT5 the easiest decomposition pathway is to eliminate the NO+ molecule by breaking the C–N bond viaTS5 to form intermediate INT6 (shown in Fig. 4), This has a barrier of ΔH = 28.2 kcal mol−1 (ΔG = 30.3 kcal mol−1) above INT5.
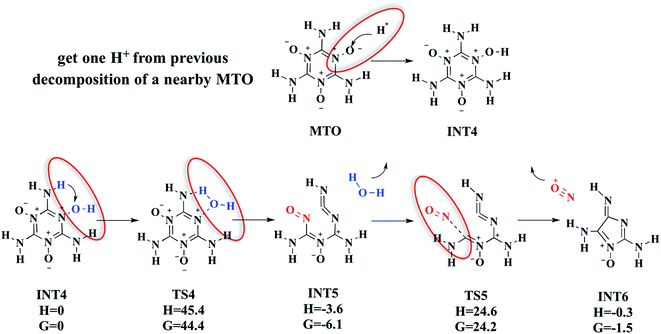 | ||
| Fig. 4 The mechanism of our proposed pathway for the reactions releasing H2O and NO+ from MTO, which starts with an H+ transfer from a previously decomposed MTO molecule to an oxygen atom (see the red lines in Fig. 2, which indicate dissociated H atoms) of an unreacted MTO to form INT4. Then INT4 releases one H2O to form INT5, which is followed quickly by NO+ release to form INT6. Units are in kcal mol−1. | ||
3.1.2e. Intramolecular H transfer (MTO–TS6–INT1′). Although our DFT-MD studies of MTO did not find an intramolecular hydrogen-transfer, we carried out QM calculations to examine the barrier for this intramolecular hydrogen-transfer pathway (MTO–TS6–INT1′), as shown in Fig. 5. Here one H atom of the –NH2 group transfers to the adjacent O atom to form the INT1viaTS6. This leads to a barrier of ΔH = 12.0 kcal mol−1 (ΔG = 12.5 kcal mol−1), which is 9.0 kcal mol−1 higher than the simultaneous intermolecular hydrogen-transfer reaction. This explains why we did not observe intramolecular hydrogen-transfer events in the DFT-MD for periodic MTO. This pathway would form the same INT1′ intermediate (one molecule in INT1) in the gas phase as shown in Fig. 5. As described above we also found a nearby transition state (TS6) with one saddle point and then the nearby stable reactant (MTO) and product (INT1′) species. Compared with the intermolecular H transfer (discussed above in Fig. 3), the first INT1 in Fig. 3 has lower energy than INT1′ in Fig. 5 because of the hydrogen bonding between the two INT1′ molecules in INT1 (the hydrogen bond distance is 1.560 Å).
3.2. MTO3N initial reaction
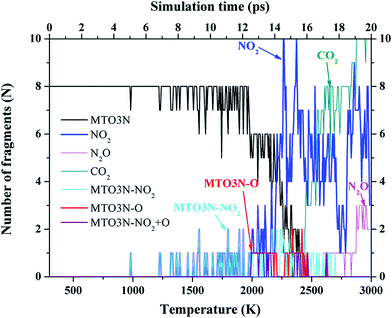 | ||
| Fig. 6 Species analysis for the decomposition of P2(1)/c-MTO3N heated from 300 to 3000 K over 20 ps. From 5 to 12.5 ps, we observe only N–N bond stretching vibration (no reactions), and then at 12.5 ps (∼2000 K), we observe release of two NO2 molecules. At the same time, we observe three new fragments (MTO3N–NO2, MTO3N–O, and MTO3N–NO2 + O), which indicate that the two NO2 molecules come both from a bimolecular NO2 releasing reaction and a unimolecular NO2 cleavage reaction. This event is illustrated in Fig. 7. | ||
• From 5 to 12.5 ps, the amplitude of the N–N bond stretching vibration leads to fluctuations beyond our NN cut-off, but no real reactions.
• Then at 12.5 ps (∼2000 K), we observe release of two NO2 molecules simultaneously with three new fragments: MTO3N–NO2, MTO3N–O, and MTO3N–NO2 + O as shown in Fig. 6. Here one NO2 molecule comes from a bimolecular NO2 releasing reaction while the other is from a unimolecular NO2 cleavage reaction.
We will discuss the reaction mechanisms in more detail in the next section using finite cluster calculations. As the temperature continues increasing, we observe release of additional NO2 products.
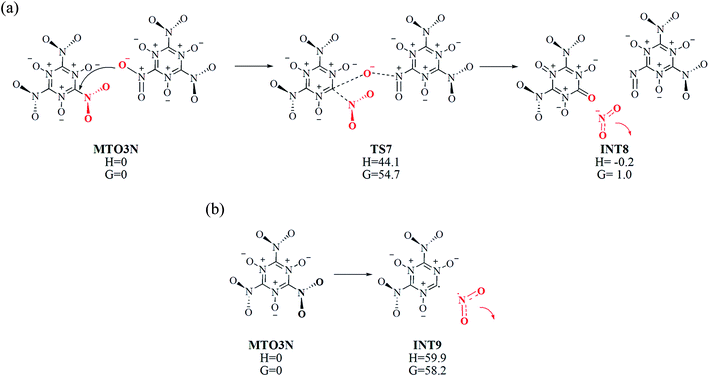
The bimolecular NO2 releasing reaction MTO3N–TS7–INT8 shown in Fig. 7(a) takes place between two MTO3N molecules at about 12.5 ps (∼2000 K). In this reaction one oxygen atom of an –NO2 group in MTO3N reacts with the carbon atom of the nearby MTO3N to make a new C![[double bond, length as m-dash]](https://www.rsc.org/images/entities/char_e001.gif) O double bond viaTS7, accompanied by breaking of the C–N bond, to release one NO2. This bimolecular NO2 releasing reaction (MTO3N–TS7–INT8) is the rate-determining step (RDS) with a barrier of ΔH = 44.1 kcal mol−1 (ΔG = 54.7 kcal mol−1), which is similar to the barrier of H2O releasing reaction (INT1′–TS2–INT2) in MTO initial reactions.
O double bond viaTS7, accompanied by breaking of the C–N bond, to release one NO2. This bimolecular NO2 releasing reaction (MTO3N–TS7–INT8) is the rate-determining step (RDS) with a barrier of ΔH = 44.1 kcal mol−1 (ΔG = 54.7 kcal mol−1), which is similar to the barrier of H2O releasing reaction (INT1′–TS2–INT2) in MTO initial reactions.
Fig. 7(b) shows, the energetics for the unimolecular NO2 cleavage reaction pathway (MTO3N–INT9) found in the fragment analysis of Fig. 6 at 12.5 ps (∼2000 K). The reaction barrier (and endothermicity) is calculated to be ΔH = 59.9 kcal mol−1 (see Fig. 7(b)), which is 15.8 kcal mol−1 higher than the bimolecular NO2 releasing reaction barrier. However the transition state free energy ΔG = 58.2 at 298.15 K is similar to the ΔG = 54.7 for the bimolecular reaction, explaining why the DFT-MD simulation observes both at the same time at 12.5 ps (∼2000 K).
To understand why the reaction energy (barrier) for the unimolecular NO2 cleavage reaction in MTO3N is much higher than the barrier of the bimolecular NO2 releasing reaction, we examined the molecular structure of MTO3N in both the gas phase and crystal. We found that optimizing the MTO3N molecular structure in the gas phase leads to a structure in which, the planes of the three –NO2 group are all perpendicular to the plane of 6-member ring. However, in the optimized MTO3N crystal, the angles between the planes of the –NO2 groups on one MTO3N molecule and the plane of 6-member ring are 30°, 60°, and 90°, respectively. Moreover in the MTO3N crystal the shortest distance between the oxygen atom of –NO2 and the oxygen atom of nearby C![[double bond, length as m-dash]](https://www.rsc.org/images/entities/char_e001.gif) O group is 2.655 Å, much shorter than in gas phase MTO3N (3.274 Å). We conclude that the strong intermolecular repulsive force between –NO2 group and the nearby C
O group is 2.655 Å, much shorter than in gas phase MTO3N (3.274 Å). We conclude that the strong intermolecular repulsive force between –NO2 group and the nearby C![[double bond, length as m-dash]](https://www.rsc.org/images/entities/char_e001.gif) O group makes the bimolecular release of the –NO2 group more favorable in the crystal. In contrast for unimolecular NO2 cleavage unimolecular NO2 cleavage in MTO3N requires a very long atom transfer process, giving it a very high reaction energy (barrier), but this is favored at high temperature because of the increased entropy from the bond breaking process.
O group makes the bimolecular release of the –NO2 group more favorable in the crystal. In contrast for unimolecular NO2 cleavage unimolecular NO2 cleavage in MTO3N requires a very long atom transfer process, giving it a very high reaction energy (barrier), but this is favored at high temperature because of the increased entropy from the bond breaking process.
4. Summary and conclusions
The condensed phase DFT-MD temperature programmed simulations uncover competing unimolecular and bimolecular reactions for the initial thermal decomposition reactions of the MTO and MTO3N energetic materials. We find that these MD results can be explained in terms reaction pathways on just the one or two molecules involved. Key points of our simulations are:(1) For P2(1)-MTO, the initial reaction is a bimolecular hydrogen-transfer reaction, followed first by H2O release with ring opening and then by NO+ release. This intermolecular hydrogen-transfer reaction has a very low barrier of ΔH = 3.0 and ΔG = 5.1 kcal mol−1, suggesting that this reaction may proceed in less than an hour even at 100 K. This could be tested by examining the IR and Raman of the crystalline form to find evidence of both OH and C![[double bond, length as m-dash]](https://www.rsc.org/images/entities/char_e001.gif) N bonds. For the INT1 species formed after the intermolecular hydrogen transfer reactions, it is now most favorable for intramolecular release of H2O (ΔH = 46.5 and ΔG = 46.4 kcal mol−1) to form INT2. From this INT2 intermediate, it is favourable (ΔH = 35.5 and ΔG = 37.6 kcal mol−1) to break the C–N bond, to release NO+ while forming an imidazole ring.
N bonds. For the INT1 species formed after the intermolecular hydrogen transfer reactions, it is now most favorable for intramolecular release of H2O (ΔH = 46.5 and ΔG = 46.4 kcal mol−1) to form INT2. From this INT2 intermediate, it is favourable (ΔH = 35.5 and ΔG = 37.6 kcal mol−1) to break the C–N bond, to release NO+ while forming an imidazole ring.
(2) For P2(1)/c-MTO3N, the bimolecular NO2 releasing reaction and unimolecular NO2 cleavage reaction take place simultaneously in the DFT-MD. In the bimolecular NO2 releasing reaction, one oxygen atom of the –NO2 group in MTO3N reacts with the carbon atom of a nearby MTO3N to form a new C![[double bond, length as m-dash]](https://www.rsc.org/images/entities/char_e001.gif) O double bond while releasing the NO2 from this carbon, with a ΔH = 44.1 and ΔG = 54.7 kcal mol−1 barrier. The reaction energy (barrier) for the unimolecular NO2 cleavage is calculated to be ΔH = 59.9 and ΔG = 58.2 kcal mol−1 leading to a ΔG just slightly higher than the bimolecular NO2 releasing reaction.
O double bond while releasing the NO2 from this carbon, with a ΔH = 44.1 and ΔG = 54.7 kcal mol−1 barrier. The reaction energy (barrier) for the unimolecular NO2 cleavage is calculated to be ΔH = 59.9 and ΔG = 58.2 kcal mol−1 leading to a ΔG just slightly higher than the bimolecular NO2 releasing reaction.
The predicted initial reaction barriers for MTO (ΔH = 46.5 kcal mol−1) and MTO3N (ΔH = 44.1 kcal mol−1) are higher than the NO2 dissociation barrier RDX (ΔH = 39.0 kcal mol−1)8 and for HMX14 (ΔH = 39.8 kcal mol−1). This suggests that both crystals should be more thermally stable. However the favourable hydrogen transfer processes in MTO may lead to problems with synthesis and crystallization. Thus we recommend MTO3N as the more promising material.
We have carried out similar DFT-MD simulations to investigate the initial thermal decomposition reaction of TKX-50![[thin space (1/6-em)]](https://www.rsc.org/images/entities/char_2009.gif) 37 and DTTO,38 which also have been suggested to be insensitive energetic materials. There we found the first decomposition barrier of TKX-50 (45.1 kcal mol−1) and DTTO (45.9 kcal mol−1), which are similar to the value we find for MTO (46.5 kcal mol−1) and MTO3N (44.1 kcal mol−1). These high decomposition barriers for MTO and MTO3N suggest that these newly designed green energetic materials: MTO and MTO3N would be thermally insensitive.
37 and DTTO,38 which also have been suggested to be insensitive energetic materials. There we found the first decomposition barrier of TKX-50 (45.1 kcal mol−1) and DTTO (45.9 kcal mol−1), which are similar to the value we find for MTO (46.5 kcal mol−1) and MTO3N (44.1 kcal mol−1). These high decomposition barriers for MTO and MTO3N suggest that these newly designed green energetic materials: MTO and MTO3N would be thermally insensitive.
Conflict of interest
The authors declare no competing financial interest.Acknowledgements
This research was funded by ONR (N00014-09-1-0634, Cliff Bedford). C.-C. Ye was sponsored by the China Scholarship Council, and thanks the Innovation Project for Postgraduates in Universities of Jiangsu Province (Grant no. CXZZ13_0213).References
- M. B. Talawar, R. Sivabalan, T. Mukundan, H. Muthurajan, A. K. Sikder, B. R. Gandhe and A. S. Rao, J. Hazard. Mater., 2009, 161, 589–607 CrossRef CAS PubMed.
- D. M. Badgujar, M. B. Talawar, S. N. Asthana and P. P. Mahulikar, J. Hazard. Mater., 2008, 151, 289–305 CrossRef CAS PubMed.
- T. M. Klapötke, personal communication, 2014.
- S. Naserifar, S. V. Zybin, C.-C. Ye and W. A. Goddard III, 2015, unpublished.
- M. Arellano and S. Bond, Rev. Econ. Stud., 1991, 58, 277–297 CrossRef.
- R. G. Parr and R. G. P. W. Yang, Density-functional theory of atoms and molecules, Oxford University Press, 1989 Search PubMed.
- H. Kim, J. M. Choi and W. A. Goddard III, J. Phys. Chem. Lett., 2012, 3, 360–363 CrossRef CAS.
- D. Chakraborty, R. P. Muller, S. Dasgupta and W. A. Goddard III, J. Phys. Chem. A, 2000, 104, 2261–2272 CrossRef CAS.
- N. Umezawa, R. K. Kalia, A. Nakano, P. Vashista and F. Shimojo, J. Chem. Phys., 2007, 126, 234702 CrossRef PubMed.
- R. A. Fifer, Fundamentals of Solid-Propellant Combustion, AIAA, New York, 1984 Search PubMed.
- M. R. Manaa, L. E. Fried, C. F. Melius, M. Elstner and T. Frauenheim, J. Phys. Chem. A, 2002, 106, 9024–9029 CrossRef CAS.
- S. P. Han, A. C. van Duin, W. A. Goddard III and A. Strachan, J. Phys. Chem. B, 2011, 115, 6534–6540 CrossRef CAS PubMed.
- A. Strachan, E. M. Kober, A. C. van Duin, J. Oxgaard and W. A. Goddard III, J. Chem. Phys., 2005, 122, 54502 CrossRef PubMed.
- D. Chakraborty, R. P. Muller, S. Dasgupta and W. A. Goddard III, J. Phys. Chem. A, 2001, 105, 1302–1314 CrossRef CAS.
- S. N. Bulusu, Chemistry and physics of energetic materials, Kluwer Academic, Boston Norwell, MA, U.S.A., 1990 Search PubMed.
- C. J. Wu and L. E. Fried, J. Phys. Chem. A, 1997, 101, 8675–8679 CrossRef CAS.
- K. K. Irikura, J. Phys. Chem. A, 2013, 117, 2233–2241 CrossRef CAS PubMed.
- R. Cohen, Y. Zeiri, E. Wurzberg and R. Kosloff, J. Phys. Chem. A, 2007, 111, 11074–11083 CrossRef CAS PubMed.
- X. F. Chen, J. F. Liu, Z. H. Meng and K. L. Han, Theor. Chem. Acc., 2010, 127, 327–344 CrossRef CAS.
- S. Okovytyy, Y. Kholod, M. Qasim, H. Fredrickson and J. Leszczynski, J. Phys. Chem. A, 2005, 109, 2964–2970 CrossRef CAS PubMed.
- D. Chakraborty, R. P. Muller, S. Dasgupta and W. A. Goddard III, J. Comput.-Aided Mol. Des., 2002, 8, 203–212 CrossRef.
- B. Wang, D. Wright, D. Cliffel, R. Haglund and S. T. Pantelides, J. Phys. Chem. A, 2011, 115, 8142–8146 CrossRef CAS PubMed.
- D. Furman, R. Kosloff, F. Dubnikova, S. V. Zybin, W. A. Goddard III, N. Rom, B. Hirshberg and Y. Zeiri, J. Am. Chem. Soc., 2014, 136, 4192–4200 CrossRef CAS PubMed.
- C. A. Mayhew, P. Sulzer, F. Petersson, S. Haidacher, A. Jordan, L. Mark, P. Watts and T. D. Mark, Int. J. Mass Spectrom., 2010, 289, 58–63 CrossRef CAS PubMed.
- Z. Takats, I. Cotte-Rodriguez, N. Talaty, H. W. Chen and R. G. Cooks, Chem. Commun., 2005, 1950–1952 RSC.
- L. M. Minier, K. R. Brower and J. C. Oxley, J. Org. Chem., 1991, 56, 3306–3314 CrossRef CAS.
- L. L. Davis and K. R. Brower, J. Phys. Chem., 1996, 100, 18775–18783 CrossRef CAS.
- A. Strachan, A. C. van Duin, D. Chakraborty, S. Dasgupta and W. A. Goddard III, Phys. Rev. Lett., 2003, 91, 098301 CrossRef.
- W. Kohn and L. J. Sham, Phys. Rev., 1965, 140, A1133–A1138 CrossRef.
- P. Hohenberg and W. Kohn, Phys. Rev., 1964, 136, B864–B871 CrossRef.
- G. Kresse, J. Non-Cryst. Solids, 1995, 193, 222–229 CrossRef.
- G. Kresse and J. Furthmuller, Comput. Mater. Sci., 1996, 6, 15–50 CrossRef CAS.
- G. Kresse and J. Furthmuller, Phys. Rev. B: Condens. Matter Mater. Phys., 1996, 54, 11169–11186 CrossRef CAS.
- G. Kresse and D. Joubert, Phys. Rev. B: Condens. Matter Mater. Phys., 1999, 59, 1758–1775 CrossRef CAS.
- A. D. Bochevarov, E. Harder, T. F. Hughes, J. R. Greenwood, D. A. Braden, D. M. Philipp, D. Rinaldo, M. D. Halls, J. Zhang and R. A. Friesner, Int. J. Quantum Chem., 2013, 113, 2110–2142 CrossRef CAS PubMed.
- K. Fukui, Acc. Chem. Res., 1981, 14, 363–368 CrossRef CAS.
- Q. An, W. Liu, W. A. Goddard III, T. Cheng, S. V. Zybin and H. Xiao, J. Phys. Chem. C, 2014, 118, 27175–27181 CAS.
- C.-C. Ye, Q. An, W. A. Goddard III, T. Cheng, W.-G. Liu, S. V. Zybin and X.-H. Ju, J. Mater. Chem. A, 2015, 3, 1972–1978 CAS.
Footnote |
| † Electronic supplementary information (ESI) available: Atomic coordinates of all intermediates and TSs shown in this study, coordinates for structures of P2(1)-MTO and P2(1)/c-MTO3N, and the bond cut-off in the fragment analysis. See DOI: 10.1039/c5ta02486b |
| This journal is © The Royal Society of Chemistry 2015 |

