 Open Access Article
Creative Commons Attribution 3.0 Unported Licence
Efficient ceramic zeolite membranes for CO2/H2 separation
D.
Korelskiy
*,
P.
Ye
,
S.
Fouladvand
,
S.
Karimi
,
E.
Sjöberg
and
J.
Hedlund
Chemical Technology, Luleå University of Technology, SE-97187 Luleå, Sweden. E-mail: danil.korelskiy@ltu.se
First published on 14th May 2015
Abstract
Membranes are considered one of the most promising technologies for CO2 separation from industrially important gas mixtures like synthesis gas or natural gas. In order for the membrane separation process to be efficient, membranes, in addition to being cost-effective, should be durable and possess high flux and sufficient selectivity. Current CO2-selective membranes are low flux polymeric membranes with limited chemical and thermal stability. In the present work, robust and high flux ceramic MFI zeolite membranes were prepared and evaluated for separation of CO2 from H2, a process of great importance to synthesis gas processing, in a broad temperature range of 235–310 K and at an industrially relevant feed pressure of 9 bar. The observed membrane separation performance in terms of both selectivity and flux was superior to that previously reported for the state-of-the-art CO2-selective zeolite and polymeric membranes. Our initial cost estimate of the membrane modules showed that the present membranes were economically viable. We also showed that the ceramic zeolite membrane separation system would be much more compact than a system relying on polymeric membranes. Our findings therefore suggest that the developed high flux ceramic zeolite membranes have great potential for selective, cost-effective and sustainable removal of CO2 from synthesis gas.
Introduction
Efficient and sustainable CO2 separation and capture technologies are currently of tremendous interest for several reasons. Firstly, CO2 is a greenhouse gas, and combustion of fossil fuels is one of the major sources of CO2 emissions. Secondly, CO2 is an undesired component in many industrial gas streams, such as natural gas, biogas (methane produced from biomass), and synthesis gas, including bio-syngas produced by biomass gasification.1 Removal of CO2 from syngas is a requirement for further processing, such as production of liquid fuels, e.g., methanol,2 and hydrogen at refineries, petrochemical plants, and Integrated Gasification Combined Cycle (IGCC) power plants.3 Today, CO2 is removed primarily by absorption, e.g., amine scrubbing, which is rather an energy-intensive method with high capital costs.4 In addition, the used absorbents are corrosive and environmentally unfriendly, and the absorption unit is quite large and complex.Over the past decades, membrane separation technologies have gained an increasing interest for the reasons of high efficiency, sustainability and low energy consumption. Currently, membranes are considered to be one of the most promising CO2 separation and capture technologies with great market potential.4,5 For instance, the amount of energy required for a 90% recovery of CO2 using an efficient membrane has been estimated to be ca. 16% of the power produced by the power plant,6 whereas the energy required by an amine absorption/desorption process is ca. 50% of the power.7 From the commercial point of view, polymeric membranes have been the most successful membrane type thus far.4 For instance, the MTR Polaris™ membranes8 have been the first commercial polymeric membranes able to separate CO2 from synthesis gas. Today's best polymeric membranes can achieve CO2/H2 selectivities of 10–12 with a CO2 permeance of ca. 2 × 10⁻⁷ mol s−1 m−2 Pa−1 at room temperature.9 Such a low permeance coupled with the fairly poor selectivity necessitates the use of quite large membrane areas for a given separation task. In addition, polymeric membranes suffer from plasticisation induced by CO2, which significantly reduces the membrane selectivity and stability over time.4
Among ceramic membranes, zeolite membranes are especially attractive and promising.5 These membranes are microporous aluminosilicate membranes with a well-defined pore system.10 Due to the porous structure, zeolite membranes can display much higher fluxes than polymeric membranes,11i.e., a much smaller membrane area would be needed for a given separation task. Additionally, ceramic zeolite membranes offer an advantage over polymeric membranes in terms of high chemical and thermal stability.12
Despite the great interest in synthesis gas upgrading using membranes, the number of studies devoted to evaluation of zeolite membranes for this application is small.5 Whereas highly CO2-selective zeolite membranes have been developed, e.g., SAPO-34 membranes13 with a CO2/H2 separation factor of 110 at 253 K and a feed pressure of 12 bar, there are only a few reports on high flux zeolite membranes. Our research group has extensive experience in preparing ultra-thin (ca. 0.5–1 μm) high flux MFI zeolite membranes,14 and these membranes have been evaluated for various gas2,14–19 and liquid20 separations. In the present work, these membranes were evaluated for separation of CO2 from H2 (CO2/H2 mixtures are typically considered as a model system for synthesis gas21) in a wide temperature range of 235–310 K and at a feed pressure of 9 bar.
Experimental
Membrane synthesis
Supported zeolite membranes comprised of an H-ZSM-5 film with a thickness of ca. 0.5 μm and a Si/Al ratio of 139 (ref. 17) were prepared as described in detail in our earlier work.14 A porous graded α-alumina disc (Fraunhofer IKTS, Germany) was used as the support. Prior to the film synthesis, the supports were masked as described elsewhere22 and then seeded with colloidal MFI crystals of 50 nm in diameter. The film synthesis was carried out for 36 h at 100 °C in a solution with a molar composition of 3TPAOH![[thin space (1/6-em)]](https://www.rsc.org/images/entities/char_2009.gif) :
:![[thin space (1/6-em)]](https://www.rsc.org/images/entities/char_2009.gif) 25SiO2
25SiO2![[thin space (1/6-em)]](https://www.rsc.org/images/entities/char_2009.gif) :
:![[thin space (1/6-em)]](https://www.rsc.org/images/entities/char_2009.gif) 1450H2O
1450H2O![[thin space (1/6-em)]](https://www.rsc.org/images/entities/char_2009.gif) :
:![[thin space (1/6-em)]](https://www.rsc.org/images/entities/char_2009.gif) 100C2H5OH. After the synthesis, the membranes were rinsed with a 0.1 M Ammonia solution for 24 h and then calcined for 6 h at 500 °C at a heating rate of 0.2 °C min−1 and a cooling rate of 0.3 °C min−1.
100C2H5OH. After the synthesis, the membranes were rinsed with a 0.1 M Ammonia solution for 24 h and then calcined for 6 h at 500 °C at a heating rate of 0.2 °C min−1 and a cooling rate of 0.3 °C min−1.
Membrane characterisation
Scanning electron microscopy (SEM) characterisation of the membranes was carried out using a Magellan 400 (the FEI Company, Eindhoven, the Netherlands) instrument with no coating. Cross-sections of the membranes were obtained by fracture with a pair of cutting pliers.X-ray diffraction (XRD) characterisation of the membranes was performed using a PANalytical Empyrean diffractometer equipped with a Cu LFF HR X-ray tube and a PIXcel3D detector. The data evaluation was performed using HighScore Plus 3.0.4.
The prepared membranes were also characterised by n-hexane/helium permporometry15 as described in detail in our earlier work23 and in brief below. The membranes were sealed in a stainless steel cell using graphite gaskets (Eriks, the Netherlands). In order to remove any adsorbed compounds, the membranes were heated to 300 °C at a heating rate of 1 °C min−1 and kept at this temperature for 6 h in a flow of pure helium. Permporometry characterisation was carried out at 50 °C and a total pressure difference across the membrane of 1 bar with the permeate stream kept at atmospheric pressure. The relative pressure of n-hexane was raised in a step-wise manner from 0 to ca. 0.4. At each relative pressure, the system was allowed to achieve steady-state. For removing n-hexane from the permeate stream, a condenser kept at −40 °C followed by a column packed with activated carbon was used. The permeate volumetric flow rate was measured with a soap bubble flow meter. A detailed procedure for estimation of the relative areas of defects from permporometry data is given in our earlier work.23 In brief, the defect width was calculated from n-hexane relative pressure using either the Horvàth–Kavazoe equation (micropore range defects) or the Kelvin equation (mesopore range defects). For each defect interval, the average defect width was then calculated. Based on the average defect width, the average helium diffusivity in each defect interval was estimated using the gas-translational model. Knowing the diffusivity, the helium molar flux was further calculated from Fick's law. Finally, the defect area was estimated as the ratio between helium molar flow and flux through the defects in that particular interval.
Separation experiments
Separation experiments were carried out using an equimolar mixture of CO2 and H2. The membrane was in the same cell as used for the permporometry experiment. The total feed pressure was kept at 9 bar, whereas the total permeate pressure was atmospheric. All experiments were performed without sweep gas. Prior to the experiments, the membrane was flushed with pure helium for 6 h at 300 °C in order to remove any adsorbed species. The permeate volumetric flow rate was measured with a drum-type gasmeter (TG Series, Ritter Apparatebau GmbH) and the permeate composition was analysed on-line with a mass spectrometer (GAM 400, InProcess Instruments).The flux of component i, Ji (mol s−1 m−2), was estimated from the measured molar flow of the corresponding component through the membrane, Fi (mol s−1) as
| Ji = Fi/A, |
The permeance of component i, Πi (mol s−1 m−2 Pa−1), was calculated from the flux of the corresponding component through the membrane as
| Πi = Ji/ΔPi, |
The separation factor βi/j was estimated as
| βi/j = (yi/yj)/(xi/xj), |
The membrane selectivity αi/j was estimated as
| αi/j = Πi/Πj. |
Results and discussion
Membrane characterisation
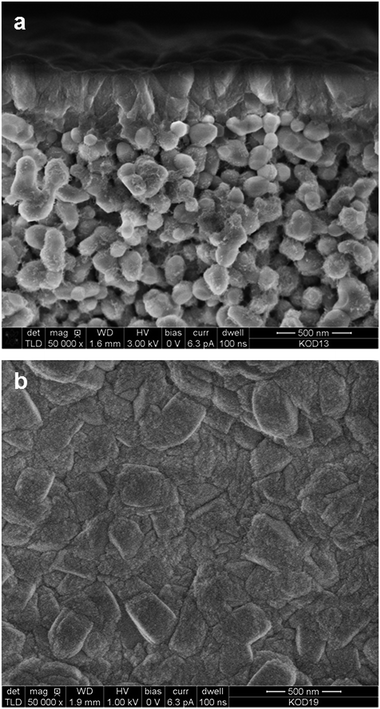
The fabricated membranes were H-ZSM-5 zeolite films with a Si/Al ratio of about 139 (ref. 17) supported on commercial α-alumina discs (Fraunhofer IKTS, Germany). The synthesis procedure is described in the Experimental. Cross-sectional and top-view SEM images of an as-synthesised membrane are shown in Fig. 1. The zeolite film appears to be even with a thickness of ca. 0.5 μm. The crystals composing the film are well-intergrown with a size of ca. 200 nm. No large defects (>5 nm) could be detected by SEM, indicating high quality of the membrane. Fig. 2 shows an XRD pattern of membrane M2. The detected reflections were solely the expected reflections emanating from MFI zeolite and alumina (the support) indicating that no other phase was present in the membrane.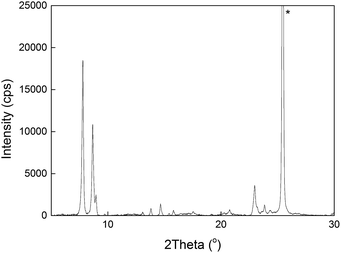 | ||
| Fig. 2 An XRD pattern of membrane M2. The reflection marked with an asterisk emanates from the alumina support. | ||
In order to estimate the amount of defects, the membranes were characterised by n-hexane/helium permporometry15,23 as described in the Experimental. In this technique, helium permeance through the membrane is measured as a function of n-hexane relative pressure. Table 1 reports permporometry data for membrane M1. The helium permeance at a relative pressure of n-hexane of 0, i.e., the permeance through zeolite pores and defects, was as high as 53 × 10−7 mol s−1 m−2 Pa−1, which shows that the zeolite pores are open and rather permeable. As the relative pressure of n-hexane was increased, first zeolite pores and then increasingly larger defects were blocked by n-hexane, and, therefore, the helium permeance decreased. The amount of defects in terms of relative areas was estimated from the permporometry data as described in the Experimental. The total amount of defects in the membrane was very low, constituting less than 0.1% of the total membrane area, indicating a very high quality of the membrane. The main type of defects (ca. 99.4% of all defects) was micropore defects, i.e., defects < 2 nm in size. Such defects are most likely narrow open grain boundaries, as discussed in detail in our previous work.24 Essentially no large defects (>5 nm) were detected by permporometry, which is consistent with the SEM observations.
| P/P0 | He permeance (10−7 mol s−1 m−2 Pa−1) | Defect interval (nm) | Relative area of defectsa (%) |
|---|---|---|---|
| a Area of defects per total membrane area. | |||
| 0 | 53 | — | |
| 3.8 × 10⁻⁴ | 1.25 | 0.71–0.73 | 0.06 |
| 6.7 × 10⁻⁴ | 0.70 | 0.73–0.80 | 0.03 |
| 2.1 × 10⁻³ | 0.36 | 0.80–1.04 | 0.01 |
| 1.1 × 10⁻² | 0.23 | 1.04–1.78 | 0.003 |
| 1.5 × 10⁻¹ | 0.11 | 1.78–5.43 | 0 |
| 4.5 × 10⁻¹ | 0.11 | >5.43 | 0.0006 |
| Total: | 0.10 | ||
Separation experiments
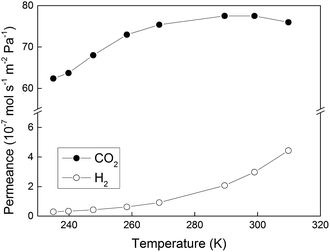
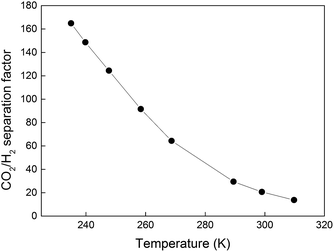
Fig. 3 shows permeances of CO2 and H2 measured for membrane M1 as a function of temperature when a 50/50 (v/v) mixture of CO2/H2 was fed to the membrane. The permeance of CO2 was high and much greater than that of H2 in the entire temperature range. This is a result of the fact that CO2 is adsorbing much stronger in the membrane than H2,2 thereby blocking the transport of H2 and rendering the membrane CO2-selective. The highest CO2 permeance of ca. 78 × 10−7 mol s−1 m−2 Pa−1 was observed at the higher temperatures, i.e., 290–310 K. In general, the measured CO2 permeances were consistent with those previously reported by our group,2 and one to two orders of magnitude higher than those reported for zeolite and polymeric membranes in the literature. With decreasing temperature, the permeances of both CO2 and H2 decreased, most likely due to decreasing diffusivity, as discussed in our earlier work.2 However, the permeance of CO2 was reduced to a significantly lower extent than that of H2 resulting in increasing selectivity of the membrane to CO2 with decreasing temperature, which can be ascribed to increasing adsorption of CO2 with decreasing temperature. At the lowest investigated temperature of 235 K, the permeance of H2 was as low as 0.3 × 10⁻⁷ mol s−1 m−2 Pa−1, whereas the permeance of CO2 was still as high as 62 × 10−7 mol s−1 m−2 Pa−1.Fig. 4 illustrates CO2/H2 separation factors recorded for membrane M1 as a function of temperature. With decreasing temperature, the separation factor was increasing to as high as 165 at the lowest investigated temperature of 235 K. At these conditions, the CO2 concentration in the permeate was as high as 99.4%. Table 2 shows the CO2 fluxes, the concentration of CO2 and H2 in the permeate stream and the CO2/H2 membrane selectivities. The latter term denotes the ratio of CO2 and H2 permeances (not to be confused with the separation factor). The observed CO2 flux was very high, i.e., 350–420 kg m−2 h−1, in the entire temperature range. As discussed in our earlier work,2 the high CO2 flux is a result of the very low zeolite film thickness, strong CO2 adsorption and high CO2 diffusivity in the zeolite pores, and a relatively high CO2 partial pressure difference of 3.5 bar across the membrane. The CO2 flux was decreasing with decreasing temperature, i.e., similar to the CO2 permeance. Since the membrane was highly CO2-selective in the entire temperature range, the CO2 concentration in the permeate was close to 100%, see Table 2. Consequently, the partial pressure of CO2 in the permeate was nearly constant at 1 bar, resulting in almost the same partial pressure difference of CO2 across the membrane (ca. 3.5 bar) at all temperatures. As a result, the CO2 flux was varying with temperature in an almost identical manner as the CO2 permeance. At 253 K, the separation factor was almost as high as 120 with a CO2 flux of ca. 400 kg h−1 m−2, which is 133 times higher than that (3 kg h−1 m−2) reported for the highly CO2-selective SAPO-34 zeolite membranes at similar experimental conditions.13 It is also worth noting that the total duration of the separation experiments was ca. 6 h. During this time, the membrane was constantly exposed to a high flow of gas at elevated pressure. Despite this, no indication of deteriorating membrane quality was observed indicating good membrane stability at these experimental conditions. Evaluation of the long-term stability of the membranes would, however, require an industrial gas supply due to the large consumption of gas and the associated high costs, which was beyond the scope of the present work.
| T (K) | CO2 flux (kg h−1 m−2) | Permeate concentration (mol%) | CO2/H2 membrane selectivity | |
|---|---|---|---|---|
| CO2 | H2 | |||
| 310 | 423 | 93.22 | 6.78 | 17 |
| 300 | 429 | 95.36 | 4.61 | 26 |
| 290 | 428 | 96.71 | 3.28 | 37 |
| 270 | 420 | 98.47 | 1.53 | 82 |
| 260 | 406 | 98.91 | 1.08 | 117 |
| 250 | 383 | 99.20 | 0.80 | 159 |
| 240 | 364 | 99.33 | 0.67 | 189 |
| 235 | 356 | 99.40 | 0.60 | 210 |
In order to study reproducibility of the separation results, another membrane (denoted M2) with defect distribution similar to that for membrane M1 was evaluated for CO2/H2 separation in the temperature range of 235–270 K using a feed pressure of 9 bar. The separation data for membrane M2 summarised in Table 3 were well comparable to those for membrane M1, illustrating good reproducibility of the separation results.
| T (K) | CO2 flux (kg h−1 m−2) | CO2/H2 separation factor | CO2/H2 membrane selectivity |
|---|---|---|---|
| 270 | 448 | 84 | 107 |
| 260 | 407 | 114 | 145 |
| 250 | 404 | 129 | 165 |
| 240 | 341 | 189 | 242 |
| 235 | 303 | 202 | 258 |
A summary of the best CO2/H2 separation data reported for zeolite membranes in the literature is depicted in Fig. 5. Fig. 5 also shows the data obtained in the present work for randomly oriented MFI membranes, and in our previous work25 for b-oriented MFI membranes. The separation performance of the membranes prepared in the present work is well above the upper bound for the best zeolite membranes reported previously. The observed separation performance was also greater than that of high quality b-oriented MFI membranes recently prepared by our group.25 Since the amount of defects in both types of membranes was nearly identical, the difference in the separation performance between the randomly oriented and b-oriented MFI membranes should most likely emanate from the difference in the adsorption affinity of the membranes for CO2. The b-oriented MFI membranes reported in our previous work25 were prepared in a fluoride medium at near-neutral pH, whereas the membranes in the present work were synthesised in an alkaline medium. MFI zeolites prepared in a fluoride medium have been shown26,27 to be less hydrophilic than similar MFI zeolites prepared in a hydroxide medium due to the lower amount of Si–OH groups. In addition, the b-oriented MFI-F membranes prepared in our previous work25 should most probably contain less aluminium in the structure than the present MFI-OH membranes as the leaching of aluminium from the support during the film synthesis should be reduced at near-neutral pH. The lower aluminium content should also result in a less hydrophilic nature of the b-oriented MFI-F membranes. At the same time, the adsorption affinity of MFI zeolites for CO2 has been demonstrated28–30 to increase with increasing hydrophilicity. Thus, the present randomly oriented MFI-OH membranes, being somewhat more hydrophilic, should have greater adsorption affinity for CO2 than the b-oriented MFI-F membranes, and, hence, should be more selective to CO2, as observed in the present work. It is also worth noting that in a previous work19 we compared randomly oriented MFI membranes prepared in fluoride and alkaline media. A similar trend was observed for CO2/H2 separation, i.e., the MFI-OH membranes were more selective to CO2 than the MFI-F membranes. In contrast, the latter membranes were more selective to n-butanol, as should be expected for a less hydrophilic membrane. It should also be noted that the preparation procedure for the randomly oriented MFI membranes is rather well-established and it is much simpler than that for the b-oriented MFI membranes. Hence, at this moment, the randomly oriented high flux MFI membranes should be easier to scale-up.
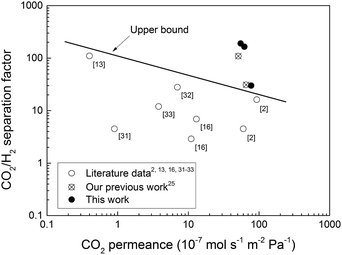 | ||
| Fig. 5 Summary of the best CO2/H2 separation data reported for zeolite membranes in the literature2,13,16,31–33 as well as the data obtained in our previous work25 and in the present work. | ||
Cost estimation
In order to evaluate the economic viability of our membranes, the estimated cost of the membrane modules was compared with that of the commercially available spiral-wound modules used in a natural gas processing plant.34 The latter modules were assumed to contain MTR Polaris™ membranes recently evaluated for CO2/H2 separation in commercial scale.3 The zeolite membrane modules were assumed to contain zeolite membranes supported on 19-channel α-alumina tubes with the same CO2 permeance as measured experimentally for the disc-shaped membranes in the present work. The results of the cost comparison are summarised in Table 4. The costs were estimated for a membrane process with a separation capacity of 300 ton CO2 per day at a CO2 partial pressure difference across the membrane of 10 bar and room temperature. For this purpose, a polymeric membrane process would need as many as 20 membrane modules, whereas a ceramic MFI zeolite membrane process would only require one module. The estimation demonstrates that the total cost of modules with membranes in the case of high flux MFI membranes was approx. 30% lower than that of high performance commercial polymeric membranes. This is due to the much greater permeance of the MFI membranes resulting in a very low membrane area needed for the separation process. Furthermore, the MFI membranes display much higher CO2/H2 selectivity (26 and 210 at 300 and 235 K, respectively, see Table 2) than polymeric membranes (10–12 at room temperature). It is also worth noting that the equipment needed for the high flux MFI membrane process will be very compact, as schematically illustrated in Fig. 6. Hence, the prepared MFI membranes have great market potential for separation of CO2 from synthesis gas.| Parameter | Polaris membranes | MFI membranes |
|---|---|---|
| a The cost of the module was estimated by Fraunhofer IKTS (Dr Ing. H. Richter, personal communication, 6 March 2015). | ||
| CO2 permeance (10−8 mol s−1 m−2 Pa−1) | 20 (ref. 3) | 775 |
| Module type | Spiral-wound | Multichannel tubes (19 channels) |
| Membrane area in one module (m2) | 20 (ref. 3) | 10 (ref. 35) |
| Membrane area needed (m2) | 395 | 10 |
| No. of modules needed | 20 | 1 |
| Cost of membranes and module (USD per m2) | 10 (ref. 34) | 2600a |
| Total cost of modules with membranes (USD) | 39 500 | 26 500 |
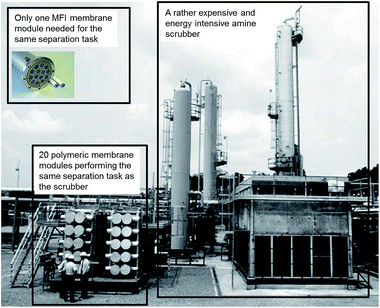 | ||
| Fig. 6 A comparison between the size of an amine scrubber system, polymeric membrane system and high flux MFI membrane system performing the same separation task. The background picture was adapted from Dortmundt and Doshi.36 The ceramic membrane module image was provided by Inopor®.35 | ||
Conclusions
Ultra-thin randomly oriented high flux MFI zeolite membranes were prepared and evaluated for CO2/H2 separation at a temperature ranging from 235 to 310 K and a feed pressure of 9 bar. The observed membrane separation performance in terms both selectivity and flux was superior to that previously reported for CO2-selective zeolite and polymeric membranes. An initial estimate of the cost of membrane modules revealed that the present membranes were more economically attractive than commercial-scale polymeric membranes. In addition, the ceramic zeolite membrane separation system would be much more space efficient than a system relying on polymeric membranes. The findings of the present work therefore suggest that the developed high flux MFI zeolite membranes have great potential for selective and cost-effective removal of CO2 from synthesis gas.Acknowledgements
The Swedish Foundation for Strategic Research (SSF, grant no. RMA08-0018), the Swedish Research Council (VR, grant no. 2010-5317), the Swedish Research Council Formas (Grant no. 213-2013-1684), the Swedish Energy Agency (Grant no. 2013-006587) and Bio4Energy are gratefully acknowledged for financially supporting this work. Amirfarrokh Farzaneh is gratefully acknowledged for fruitful discussions.Notes and references
- X. Yin, D. Y. C. Leung, J. Chang, J. Wang, Y. Fu and C. Wu, Energy Fuels, 2004, 19, 305–310 CrossRef.
- L. Sandström, E. Sjöberg and J. Hedlund, J. Membr. Sci., 2011, 380, 232–240 CrossRef PubMed.
- H. Lin, Z. He, Z. Sun, J. Vu, A. Ng, M. Mohammed, J. Kniep, T. C. Merkel, T. Wu and R. C. Lambrecht, J. Membr. Sci., 2014, 457, 149–161 CrossRef CAS PubMed.
- S. D. Kenarsari, D. Yang, G. Jiang, S. Zhang, J. Wang, A. G. Russell, Q. Wei and M. Fan, RSC Adv., 2013, 3, 22739–22773 RSC.
- M. Pera-Titus, Chem. Rev., 2013, 114, 1413–1492 CrossRef PubMed.
- T. C. Merkel, H. Lin, X. Wei and R. Baker, J. Membr. Sci., 2010, 359, 126–139 CrossRef CAS PubMed.
- P. Luis, T. Van Gerven and B. Van der Bruggen, Prog. Energy Combust. Sci., 2012, 38, 419–448 CrossRef CAS PubMed.
- Membrane Technology & Research (MTR), http://www.mtrinc.com.
- R. W. Baker and B. T. Low, Macromolecules, 2014, 47, 6999–7013 CrossRef CAS.
- J. Caro and M. Noack, Microporous Mesoporous Mater., 2008, 115, 215–233 CrossRef CAS PubMed.
- E. Sjöberg, L. Sandström, O. G. W. Öhrman and J. Hedlund, J. Membr. Sci., 2013, 443, 131–137 CrossRef PubMed.
- J. Caro, M. Noack and E. Stefan, in Advances in Nanoporous Materials, Elsevier, 2010, vol. 1, pp. 1–96 Search PubMed.
- M. Hong, S. Li, J. L. Falconer and R. D. Noble, J. Membr. Sci., 2008, 307, 277–283 CrossRef CAS PubMed.
- J. Hedlund, J. Sterte, M. Anthonis, A. J. Bons, B. Carstensen, N. Corcoran, D. Cox, H. Deckman, W. de Gijnst, P. P. de Moor, F. Lai, J. McHenry, W. Mortier and J. Reinoso, Microporous Mesoporous Mater., 2002, 52, 179–189 CrossRef CAS.
- J. Hedlund, D. Korelskiy, L. Sandström and J. Lindmark, J. Membr. Sci., 2009, 345, 276–287 CrossRef CAS PubMed.
- J. Lindmark and J. Hedlund, J. Membr. Sci., 2010, 360, 284–291 CrossRef CAS PubMed.
- L. Sandström, J. Lindmark and J. Hedlund, J. Membr. Sci., 2010, 360, 265–275 CrossRef PubMed.
- P. Ye, E. Sjöberg and J. Hedlund, Microporous Mesoporous Mater., 2014, 192, 14–17 CrossRef CAS PubMed.
- H. Zhou, D. Korelskiy, E. Sjöberg and J. Hedlund, Microporous Mesoporous Mater., 2014, 192, 76–81 CrossRef CAS PubMed.
- D. Korelskiy, T. Leppäjärvi, H. Zhou, M. Grahn, J. Tanskanen and J. Hedlund, J. Membr. Sci., 2013, 427, 381–389 CrossRef CAS PubMed.
- M. Grahn and J. Hedlund, J. Membr. Sci., 2014, 471, 328–337 CrossRef CAS PubMed.
- J. Hedlund, F. Jareman, A. J. Bons and M. Anthonis, J. Membr. Sci., 2003, 222, 163–179 CrossRef CAS.
- D. Korelskiy, M. Grahn, J. Mouzon and J. Hedlund, J. Membr. Sci., 2012, 417–418, 183–192 CrossRef CAS PubMed.
- D. Korelskiy, P. Ye, H. Zhou, J. Mouzon and J. Hedlund, Microporous Mesoporous Mater., 2014, 186, 194–200 CrossRef CAS PubMed.
- M. Zhou, D. Korelskiy, P. Ye, M. Grahn and J. Hedlund, Angew. Chem., Int. Ed., 2014, 53, 3492–3495 CrossRef CAS PubMed.
- Z. Qin, L. Lakiss, L. Tosheva, J.-P. Gilson, A. Vicente, C. Fernandez and V. Valtchev, Adv. Funct. Mater., 2014, 24, 257–264 CrossRef CAS PubMed.
- K. Zhang, R. P. Lively, J. D. Noel, M. E. Dose, B. A. McCool, R. R. Chance and W. J. Koros, Langmuir, 2012, 28, 8664–8673 CrossRef CAS PubMed.
- J. A. Dunne, R. Mariwala, M. Rao, S. Sircar, R. J. Gorte and A. L. Myers, Langmuir, 1996, 12, 5888–5895 CrossRef CAS.
- J. A. Dunne, M. Rao, S. Sircar, R. J. Gorte and A. L. Myers, Langmuir, 1996, 12, 5896–5904 CrossRef CAS.
- R. Krishna and J. M. van Baten, J. Membr. Sci., 2010, 360, 323–333 CrossRef CAS PubMed.
- M. Kanezashi, AIChE J., 2008, 54, 1478–1486 CrossRef CAS PubMed.
- K. Kusakabe, T. Kuroda, K. Uchino, Y. Hasegawa and S. Morooka, AIChE J., 1999, 45, 1220–1226 CrossRef CAS PubMed.
- W. J. W. Bakker, F. Kapteijn, J. Poppe and J. A. Moulijn, J. Membr. Sci., 1996, 117, 57–78 CrossRef CAS.
- R. W. Baker and K. Lokhandwala, Ind. Eng. Chem. Res., 2008, 47, 2109–2121 CrossRef CAS.
- Inopor®, http://www.inopor.com.
- D. Dortmundt and K. Doshi, Chem. Eng. World, 2003, 38, 55–66 CAS.
| This journal is © The Royal Society of Chemistry 2015 |

