
 Open Access Article
 This Open Access Article is licensed under a
 Creative Commons Attribution 3.0 Unported Licence
Stannous ions reducing graphene oxide at room temperature to produce SnOx-porous, carbon-nanofiber flexible mats as binder-free anodes for lithium-ion batteries†
Feilong
Yan
a,
Xuan
Tang
a,
Yuehua
Wei
a,
Libao
Chen
b,
Guozhong
Cao
*cd,
Ming
Zhang
*a and
Taihong
Wang
a
aKey Laboratory for Micro-Nano Optoelectronic Devices of Ministry of Education, School of Physics and Microelectronics, State Key Laboratory for Chemo/Biosensing and Chemometrics, Hunan University, Changsha, 410082, P. R. China. E-mail: zhangming@hnu.edu.cn
bState Key Laboratory for Power Metallurgy, Central South University, Changsha, 10083, P. R. China
cDepartment of Materials Science & Engineering, University of Washington, Seattle, Washington 98195, USA. E-mail: gzcao@uw.edu
dBeijing Institute of Nanoenergy and Nanosystems, Chinese Academy of Sciences, Beijing 100083, China
First published on 6th May 2015
Abstract
Tin oxides with high theoretical capacities as anodes for lithium-ion batteries always suffer from the electrical disconnect issue of active materials owing to huge volume changes. In this work, flexible mats composed of ultra-small SnOx nanoparticles, graphene, and carbon fibers are synthesized by reducing graphene oxide with stannous ions at room temperature following treatments. SnOx nanoparticles, including SnO and SnO2, with diameters of approximately 4 nm are embedded in the matrix composed of carbon fiber and graphene to form composite fibers that are woven into flexible mats without any binders. As binder-free anodes for lithium-ion batteries, SnOx–graphene–carbon fiber mats can deliver a high reversible capacity of 545 mA h g−1 after 1000 cycles at a current density of 200 mA g−1, which is much better than those of SnOx–carbon fiber mats. The improved performance of SnOx–graphene–carbon fiber mats can be attributed to the ultra-small size of SnOx nanoparticles and the double protection of both graphene and carbon fibers.
1. Introduction
Great attention has been devoted to lithium-ion batteries (LIBs) with high energy density and long cycle stability to meet increasing demands in many fields,1 such as portable electronics2 and electric vehicles,2–6 as well as large-scale stationary energy storage systems.4,7 Nevertheless, the energy density, power density, and cyclic stability of commercial LIBs whose theoretical capacities are just 137 and 372 mA h g−1 for LiCoO2 (50% delithiation) and graphite need to be further improved.1 Tin oxides/tin as anodes for LIBs have attracted considerable attention owing to their high theoretical specific capacities,8 such as SnO2 (781 mA h g−1),9–11 SnO (875 mA h g−1)12 and Sn (992 mA h g−1),1,5,13–15 whose theoretical capacities are 2.5 times higher than that of commercial graphite (372 mA h g−1).13,16However, tin oxides suffer from significant capacity fading due to enormous volume changes during the lithiation/delithiation process.5,10,17 Several approaches have been developed to address this issue. For example, tin oxides were nanosized to minimize the strain during volume changes.4,17–19 This strategy, however, results in a relatively high irreversible capacity in the initial cycle, arising from formation of enlarged solid electrolyte interface (SEI) films because of the high specific area of nanomaterials.20 Another approach is to integrate tin oxides with carbonaceous materials to accommodate their huge volume changes, including amorphous carbon, mesoporous carbon, graphene, carbon nanotubes (CNTs) or carbon nanofiber mats.4,5 For example, SnO2–graphene composites have been synthesized using tin salts and graphene oxide (GO) as raw materials by many methods,11 such as NaBH4 reduction,21 hydrothermal growth,22 and in situ deposition.5 Additional reductants are commonly used in the above routes to reduce GO. Although GO has been demonstrated to be reduced by stannous ions at a relatively high temperature without any reductants,23,24 the reduction of GO by stannous ions at room temperature with little energy consumption has not yet been reported. In addition, GO remains highly resistive even after reduction, which is not optimal for energy storage applications. GO can also control morphology and size of metal oxides.25
To realize the high power density and good cyclic stability of tin oxides based on composites as anodes for LIBs, they should possess two important features: high electrical conductance and fast diffusion channels for Li+.5,26,27 Tin oxides/graphene composites usually have relatively high conductance due to the presence of graphene.26,28 However, diffusion of Li+ may be blocked by the binder (e.g., PVDF, polyvinylidene difluoride) or stacking of graphene sheets in tin oxides/graphene composites.10,29 This issue could be partially solved by introducing some carbon nanoparticles between graphene sheets to enlarge the interspace.30 Li+ diffusion blocked by binders cannot be easily improved without binder-free electrodes,29,31 such as growth nanomaterials on nickel foams. However, the micrometer-sized nickel foam with relatively low specific surface area cannot load nanomaterials at sufficiently high content of active materials; thus, the great interest in exploring tin oxides for fabrication of binder-free anodes for LIBs.29,31
Although modifying LIBs with either carbon fibers or graphene is a useful strategy to maintain structural stability and improve electrochemical properties, the double-protection strategy of tin oxides by both carbon fibers and graphene have not been reported. In this study, flexible hierarchical mats of SnOx–graphene–carbon nanofibers (SGCFs) were synthesized by reducing GO with stannous ions at room temperature, and followed by electrospinning and thermal treatment. The ultra-small tin oxides with diameters of approximately 4 nm were anchored on carbon fibers by chemical bonds. Even though the content of graphene and SnOx in the nanofibers was very low, the flexible mats exhibited a high specific capacity at a large current density, and excellent cyclic stability as binder-free anodes for LIBs. Such superior electrochemical results were ascribed to the carbon and graphene double-protection strategy and the ultra-small size of tin oxides.
2. Experimental details
2.1 Materials synthesis
Polyacrylonitrile (PAN, Mw = 150![[thin space (1/6-em)]](https://www.rsc.org/images/entities/char_2009.gif) 000, Sigma-Aldrich, USA), tin(II) chloride dihydrate (SnCl2·2H2O, Alfa Aesar, USA), and N,N-dimethylformamide (DMF, J. T. Baker, USA) were used without any further purification.
000, Sigma-Aldrich, USA), tin(II) chloride dihydrate (SnCl2·2H2O, Alfa Aesar, USA), and N,N-dimethylformamide (DMF, J. T. Baker, USA) were used without any further purification.
Graphene oxide (GO) was prepared according to our techniques described in the literature.29 GO was dispersed in DMF at a concentration of about 0.4 mg mL−1, and the suspension was processed with ultrasonic waves for 30 min. To prepare the precursor solution for electrospinning, 0.43 g PAN were dissolved in GO–DMF solution and vigorously stirred for 3 h at 30 °C, forming the brown solution; 1.5 mmol SnCl2·2H2O were dissolved in DMF and vigorously stirred for 1 h at room temperature, forming the transparent solution in Fig. 1a. Next, the vigorously stirred solution was added in the brown solution with a dropper. To prepare comparative carbon fibers, a precursor without GO was also prepared. A precursor for nanofibers without graphene was prepared in a similar way, also without GO. All of the precursor solution was transferred into a 5 mL syringe with a stainless steel needle (with 0.71 mm inner diameter). A syringe pump controlled the flow rate of the precursor solution to about 0.2 mL h−1. A piece of aluminum foil used as the collector was vertically positioned about 15 cm away from the needle. The needle was connected to a high-voltage DC power supply to obtain 11–14 kV. Under these conditions, PAN–SnCl2·2H2O and PAN–GO–SnCl2·2H2O nanofibers were generated and formed mats. After preoxidation at 230 °C in air for 6 h, the resulting brown films (PAN–GO–SnCl2·2H2O) were treated at 600 °C and 700 °C in argon for 2 h in order to carbonize the PAN and decompose SnCl2·2H2O, and the product is denoted as SGCF-600 and SGCF-700, respectively. The SnOx–C nanofibers (SCFs) were treated in a similar way at 700 °C in order to obtain the corresponding samples, and the product is denoted as SCF-700.
 | ||
| Fig. 1 Digital photographs of (a) PAN–GO–DMF solution (left) and SnCl2–DMF solution (right); (b) just mixed solution of PAN, GO, SnCl2·2H2O, and DMF; (c–e) mixed solution after magnetic stirring for 1 h (c), 2 h (d), and one night (e). Time-dependent colors of mixtures are evidence of Sn2+ reducing GO at room temperature. (f) Illustration of SnO2–G composite synthesis. | ||
2.2 Material characterization
The morphologies of the samples were studied by a field emission gun scanning electron microscope (Hitachi S-4800, 5 kV). Transmission electron microscopy (TEM) and high-resolution TEM (HRTEM) investigations were carried out by a JEOL JEM-2100F microscope. The samples were also analyzed using X-ray photoelectron spectroscopy (XPS, Surface Science Instruments S-probe spectrometer). Elemental analysis of the samples was achieved using energy dispersive spectroscopy (EDS). The thermal gravimetric analysis was performed on a thermogravimetric analyzer (TGA, PerkinElmer, Diamond TG/DTA) in air with a heating rate of 3.5 °C min−1. The samples were heated from room temperature to 800 °C.2.3 Electrochemical measurements
The mats (including the SGCF-600, SGCF-700, and SCF-700) were directly used as binder-free anodes for electrochemical measurements towards the storage of Li+. A Celgard 2400 microporous polypropylene membrane was used as a separator to assemble coin cells (CR 2025). The electrolyte used was a solution of 1 M LiPF6 in ethylene carbonate–dimethyl carbonate (1:1 by volume). Pieces of pure lithium foil were used as both counters and reference electrodes. All cells were assembled in an argon-filled glove box with the moisture and oxygen levels less than 1 ppm. Discharge and charge measurements were carried out using an Arbin BT2000 and a LAND battery testing system with cut-off potentials of 0.005 V for discharge and 3 V for charge. The cyclic voltammetry results were collected on an electrochemical workstation (CHI660B).
3. Results and discussion
3.1 Synthesis mechanism of SnOx–graphene
A new strategy for preparing graphene by reducing GO with stannous ions was explored for the synthesis of SnOx–G nanocomposite. As shown in Fig. 1a, a light yellow DMF solution containing GO and polyacrylonitrile (PAN) were prepared (left) and SnCl2·H2O was dissolution in DMF to form a colorless solution (right). A brownish mixture, the typical color of GO, was achieved by mixing above two solutions,23,24 as shown in Fig. 1b. The light brown color can be attributed to the dilution of colorless SnCl2·H2O solution. Then the mixed solution was stirred at room temperature. After stirring for 1 h, the solution (Fig. 1c) became darker as compared to the freshly mixed solution. When stirring for 10 h, the solution turned from brown to black, a typical color of graphene (Fig. 1e). In this solution, stannous ions have stronger reduction power than components such as DMF, PAN, H2O, and Cl−.23,32 The solution color transferring from light brown to black is an indication that GO was reduced by stannous ions at room temperature.23 The scheme in Fig. 1f presents the chemical reaction process of stannous ion reducing GO at room temperature and the formation of SnO2–graphene (SnO2–G) composites. A possible reaction mechanism for the reduction process is shown in eqn (1) and (2). First, the standard electrode potential in Sn4+/Sn2+ acid (φΘA = 0.15 V) is much lower than that of Ag+/Ag (φΘA = 1.98 V), showing relatively strong reducibility. In addition, the standard electrode potential of Sn4+/Sn2+ shows a lower value compared with the same value in acid in the base (φΘB = −0.93 V), indicating strong reducibility. Previous reports also demonstrated that stannous ions can reduce Ag+ to silver metal.33,34 Second, owing to the strong reducibility of Sn2+, GO could be reduced to graphene and SnO2 nanoparticles were fixed onto the graphene sheets. The organic solvent may be a special factor in improving the reducibility of Sn2+ at room temperature as compared with previous studies about SnCl2·2H2O reducibility in a water solution.23,32 Furthermore, the intensity of the C![[double bond, length as m-dash]](https://www.rsc.org/images/entities/char_e001.gif) O stretching peak at 1730 cm−1 in the FT-IR spectrum of rGO was diminished after reduction (Fig. S2†). A weak signal for the C–OH stretching vibration at 3420 cm−1 could be ascribed to the vibrations of the adsorbed water molecules. So it could be concluded that GO was reduced by the stannous ions.23 In addition, the diameters of resulting SnO2 nanoparticles may be decreased by the oxygen-containing groups and the nonaqueous reaction system.35
O stretching peak at 1730 cm−1 in the FT-IR spectrum of rGO was diminished after reduction (Fig. S2†). A weak signal for the C–OH stretching vibration at 3420 cm−1 could be ascribed to the vibrations of the adsorbed water molecules. So it could be concluded that GO was reduced by the stannous ions.23 In addition, the diameters of resulting SnO2 nanoparticles may be decreased by the oxygen-containing groups and the nonaqueous reaction system.35| Sn2+ + 2H2O ⇔ Sn(OH)2 + 2H+ | (1) |
| Sn(OH)2 + GO → SnO2 + G + 2H+ | (2) |
3.2 Synthesis and characterization of SGCF flexible mats
After electrospinning of the precursor solution containing PAN and SnO2–G, the as-prepared fibers (PAN–SnO2–G) were preoxidized in air followed by treatment at a high temperature in Ar. The electrospun fibers with large length to diameter ratios are easily woven into mats without any binders.29,31 The resulting flexible mats were hammered into circular films with diameters of 13 mm, as shown in Fig. 2a and d. As-prepared PAN–SnO2–G fibers without any obvious nanoparticles are shown in Fig. S1a,† indicating the ultra-small diameters of SnO2. Fig. 2b and e display the digital photos of the preoxidized samples treated at 230 °C in air for 6 h. In spite of diameters reduced to 12 mm and color change from white to brown, the circular films were without any obvious variation of shape and thickness. The corresponding SEM image shown in Fig. S1b† confirms the stability of fibers. After thermal treatment at 700 °C in Ar for 2 h, the final black SGCF mats (Fig. 2c and d) without cracks are about 8 mm in diameter, showing good structural stability and flexibility of the mats built by SGCFs. Fig. 2g is a typical low-magnification SEM image of the continuous SGCF-700 nanofibers, which shows regular diameter in the range of 120–160 nm and length of several micrometers. In addition, the nanofibers weave into a multilayer and hierarchical network without binders. An amplified SEM image of SGCF-700 is displayed in Fig. 2h, revealing that the surface of the SGCF-700 nanofibers is smooth and uniform. Graphene is not directly observed in the SEM image, because graphene with an approximate concentration of 1.2 wt% (based on a carbonization yield of 45 wt% for PAN) is embedded in the carbon matrix pyrolysized from PAN. As a comparison experiment, no GO was added and the final samples treated at 700 °C were SnOx–C nanofibers, which were marked as SCF-700 and shown in Fig. 2i (Fig. S1c†). The diameter of SCF-700 is a bit smaller than that of SGCF-700, and some cracked fibers are found, although the fibers also build a binder-free network. The flexibility of SGCF-700 mats was tested by bending experiments, as shown in Fig. 2j–l. The SGCF-700 mat with a 180 degree bend was not broken (Fig. 2j). The degree of bending can decrease with the improvement of tweezer interspace (Fig. 2k). After the bending experiments, the mat without cracks is an integral structure, confirming the excellent flexibility of SGCF-700 mats. | ||
| Fig. 2 Digital photographs of as-prepared mats (a and d); mat treated at 230 °C (b and e), and SGCF-700 mats (c and f). Images show size shrinkage of mats. Low- (g) and high-magnification (h) SEM images of the SGCF-700 mat. (i) SEM image of SCF-700 mats. (j–l) are digital photographs of SGCF-700 that show flexibility of SGCF-700 mats. | ||
The detailed morphological and structural features of the SGCFs were also characterized by TEM. Fig. 3a shows a typical TEM image of SGCF-700. No aggregated SnOx nanoparticles are found on the smooth surface of the fibers, indicating that the particles were embedded in SGCFs. This phenomenon can be confirmed by more TEM images (Fig. S3†) at different magnifications. The fracture of SGCFs could be ascribed to ultrasonication during sample preparation for the TEM test. The high-magnification TEM image is shown in Fig. 3b. The lighter color in the fibers represents the carbon matrix and the darker color represents SnOx. This image reveals that the ultra-small nanoparticles with diameters of approximate 4 nm (black dots) were well dispersed in SGCFs, suggesting good compatibility between carbon and nanoparticles. The size of SnOx is very close to the perfect diameter of SnO2 nanoparticles as anodes for LIBs reported in a previous paper.36 To further explore composite structure, high-resolution TEM (HRTEM) studies were carried out, as presented in Fig. 3c and d. An ultra-small SnOx was embedded in the SGCFs. Two planes with d-spacing of 0.275 nm in Fig. 3c and 0.26 nm in Fig. 3d were observed on the surface of SGCFs. Those values are highly consistent with the (011) planes of SnO and the (002) planes of SnO2,5,37 indicating the presence of ultra-small SnOx nanoparticles in SGCFs and transformation of SnO2 to SnO during the treatment at 700 °C. The ultra-small size of SnOx nanoparticles could be attributed to the inhibition of carbon matrix and graphene on nanoparticle growth.35 The presence and distribution of Sn elements were further verified by TEM element mapping (Fig. S4a–d†). Fig. S4c† confirmed the homogenous distribution of Sn on CNFs. Other elements, such as C, N, and O, also were uniformly distributed on CNFs. Taking into account the TEM results, it can be concluded that ultrafine SnOx nanoparticles are homogenously distributed on CNFs.
 | ||
| Fig. 3 (a) and (b) Display low- and high-magnification TEM images of SGCF-700. Ultra-small particles in (b) are marked as circles. (c) and (d) Show HRTEM images of the nanoparticles indicated by circles in (b) conforming to presence of both SnO and SnO2. | ||
The chemical composition at the surface of SGCF-700 was also investigated by X-ray photoelectron spectroscopy (XPS). As shown in Fig. 4a, the Sn 3d5/2 peak can be deconvoluted to two peaks. The peaks at 486.7 and 487.4 eV are ascribed to Sn2+ and Sn4+, corresponding to atom ratios of 61.3% and 38.7%, respectively.1,5 This result is consistent with the TEM conclusion that there are two tin-based compounds in the SGCF-700. The O 1s spectrum is shown in Fig. 4b, which could be deconvoluted to four peaks. The peaks at 531.3, and 533.2 eV are assigned to oxygen in O2 and H2O, respectively, which should be attributed to the adsorbed H2O and O2 on the carbon matrix–graphite.1 Another peak at 533.6 eV originated from C–O bonding indicates that the oxygen also bonds with carbon. Other peaks at 531.3 and 533.2 eV can be indexed to oxygen and water.1 The remaining peak may be evidence of Sn–O bonding (532.4 eV), which was directly explained by the anchoring of ultra-small tin oxides with 4 nm diameters on carbon fibers by chemical bonds.1 The full XPS spectrum of SGCF-700 in Fig. 4c demonstrated the presence of nitrogen and carbon in SGCFs, but not tin and oxygen. The fine XPS spectrum of N 1s shows two peaks at about 398.4 and 400.8 eV that could be indexed to pyridine-type and conjugated nitrogen. Both of the above nitrogen types have positive effects on the storage of lithium ions, especially pyridine-type nitrogen.29 In addition, nitrogen doping could improve carbon conductivity, and result in enhanced properties of lithium ion storage.1,4 The EDS spectrum in Fig. 4d shows the presence of carbon, oxygen, tin, and nitrogen in SGCFs, which is consistent with XPS results in Fig. 4c. The copper can be assigned to the sample holder for TEM characterization. Thus, SnOx nanoparticles (including SnO2 and SnO) were chemically embedded in nitrogen-doped carbon fibers.
 | ||
| Fig. 4 (a) Sn 3d XPS spectra of SGCF-700 mats. (b) High-resolution O 1s XPS spectrum of SGCF-700. (c) Full XPS spectrum of SGCF-700 (insert shows N 1s spectrum of SGCF-700). (d) EDS of SGCF-700 mats collected on TEM. | ||
Thermogravimetric analysis (TGA) was carried out to gain insight into the chemical composition of SGCF-700 in air; results are shown in Fig. 5. From the TGA curve, SGCF-700 has 68.22% weight loss from 300 to 633 °C that can be assigned to combustion of graphene and carbon in air forming CO2.4 This carbon weight loss agrees well with XPS analysis results. The final product of TGA is SnO2 with weight of 33.8%. Considering the transformation of SnO to SnO2 with weight increase of 11.9% and Sn2+ with an atomic ratio of 61.3%, the weight ratio can be estimated at 18.5 wt% for SnO, 13.1 wt% for SnO2, 67.3 wt% for carbon fibers, and 0.1 wt% for graphene. Calculation details are shown in the ESI.†
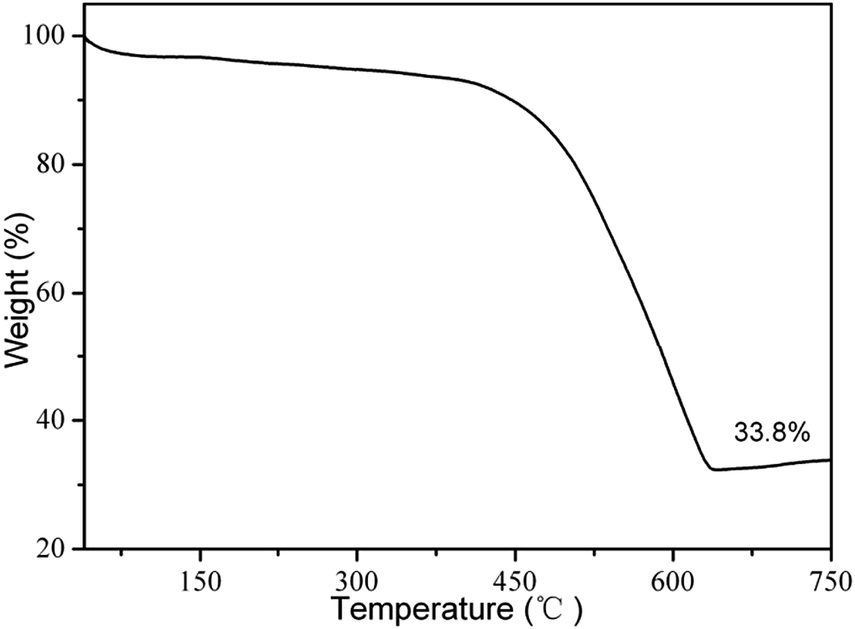 | ||
| Fig. 5 Thermogravimetric analysis (TGA) of SGCF-700 at heating rate of 3.5 °C min−1 in air with flow rate of 20 mL min−1. | ||
Nitrogen adsorption studies were carried out in order to investigate the surface area and pore volume of as-prepared porous SGCF-700 mats (Fig. S5†). BET results show that porous SGCF-700 nanofibers have a surface area of about 14.9 m2 g−1. In addition, porous SGCF-700 nanofibers also have a pore volume of about 0.208 cm3 g−1. Fig. S5b† demonstrates that most of the pores are smaller than 50 nm in diameter, and that SGCF-700 mats are mainly composed of mesopores (1–50 nm). The BET results demonstrate the formation of porous structure in the SGCF-700 mat.
CV tests were performed to investigate the mechanism of electrochemical reactions, as shown in Fig. 6. The cathodic peak of SGCF-700 at about 0.57 V in the first cycle (Fig. 6a) is ascribed to formation of an SEI film and the lithiation of SnO2 (eqn (3)), which disappears in the following cycles. Another peak in the range of 0–0.3 V can be indexed to intercalation of lithium ions into carbon (eqn (5)) and formation of Li–Sn alloys (eqn (4)).38–40
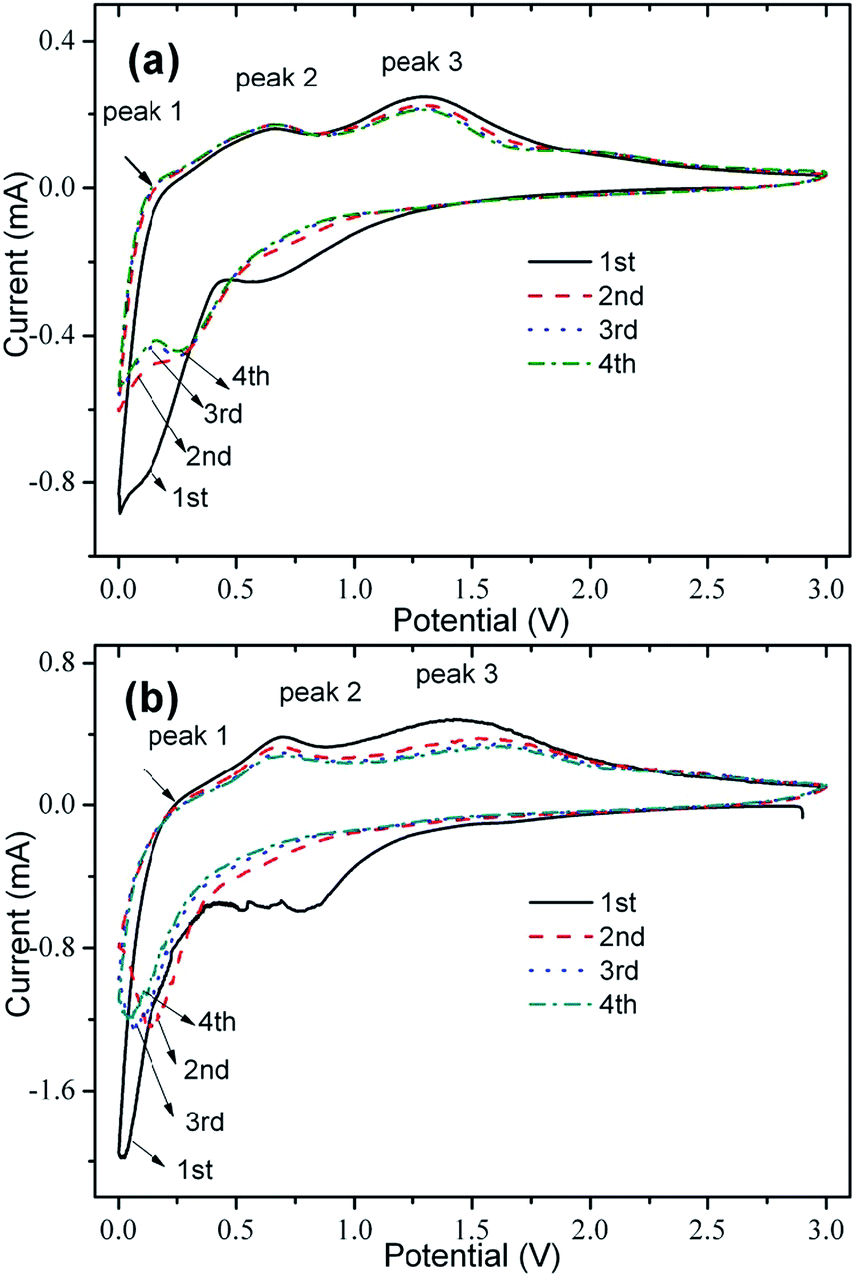 | ||
| Fig. 6 CV curves of (a) SGCF-700 and (b) SCF-700 mats at a scan rate of 0.3 mV s−1. | ||
During the anodic scan, three peaks were found. The peak at about 0.1 V could be attributed to the delithiation of graphite carbon. Another anodic peak at 0.65 V can be ascribed to delithiation of Li–Sn alloys (eqn (4)). The anodic peak at about 1.35 V may be deconvoluted to two aspects. The first is the reversible transfer of Sn0 to SnO2, which has been observed in some SnO2–carbon–graphene composites for LIB.23,41,42 Another possible reaction representing this peak is the reversible lithium ions extracting from defective sites or micropores of carbon matrix.43 Further investigation needs to be carried out to clarify details of the mechanism for this peak. Although the CV curves of SCF-700 are similar to those of SGCF-700, there are some differences between them. First, changes of anodic peaks for SGCF-700 at 0.65 and 1.35 V are smaller than those of SCF-700 in the initial four cycles, showing an improved cyclic stability of SGCF-700 by introducing graphene, although both show good cyclic stability from the second to the fourth cycle. Second, the peak current ratios of peak 3 to peak 2 of SGCF-700 are higher than those of SCF-700, indicating a possible improved reversibility of the transfer of Sn0 to SnO2 and lithium ions extracting from the defective sites or carbon matrix micropores.44
| SnOx + 2xLi+ + 2xe− → Sn + xLi2O | (3) |
| Sn + xLi+ + xe− ⇔ LixSn (0 ≤ x ≤ 4.4) | (4) |
| 6C + yLi+ + ye− ⇔ LiyC6 (0 ≤ y ≤ 1) | (5) |
The charge–discharge curves of SGCF-700 mats are shown in Fig. 7a. It is worth noting that the poorly defined plateau at about 0.8 V associated with the reduction of SnO2 to Sn becomes indiscernible in the following cycles, which suggests irreversibility of this reaction within the narrow voltage window.45 The potential profiles of SGCF-700 electrodes at a current density of 200 mA g−1 presented excellent discharge and charge capacities of 1272.6 and 828.7 mA h g−1 in the first cycle corresponding to a Coulombic efficiency (CE) of 65.1%. While increasing the number of cycles, the discharge capacity gradually decayed to 891.6, 639.8, 601.6, and 598 mA h g−1 in the 2nd, 100th, 200th, and 400th cycles, respectively. The large capacity loss (34.9%) in the first cycle is generally attributed to irreversible formation of the SEI film during the first discharge process.
 | ||
| Fig. 7 (a) Charge–discharge voltage profiles of SGCF-700 mats at the 1st, 2nd, 100th, 200th, 400th cycles at a current density of 200 mA g−1. (b) and (c) Show cyclic properties of SGCF-700 mats in comparison with SGCF-600 and SCF-700 at current densities of 200 mA g−1. (d) Rate capability of SGCF-700 as compared with SCF-700 at current densities of 100, 200, 500, 1000, 2000, and 100 mA g−1, respectively. All specific capacities in this study were calculated based on weight of whole mats. | ||
Fig. 7b displays the cyclic properties of SGCF-700 mats in the potential range of 0.005–3.0 V at a current density of 200 mA g−1. The CE of the second cycle exceeds 92.3%. The high CE indicates that embedding SnOx nanoparticles in the carbon matrix can largely prevent detrimental reactions between SnOx and the electrolyte, which is in good agreement with the CV results. High capacity should benefit from the ultra-small SnOx nanoparticles and porous carbon network structure, which enable full utilization of SnOx nanoparticles. More importantly, after several cycles the reversible capacity is stabilized at 100%.
The slow shrinkage of charge–discharge curves after the first cycle implies the high cycling stability of the as-prepared composite. The reasons for this enhancement are caused by the synergistic effect of electrospinning and optimal heat treatment. For comparison, the SGCF-600 composite anode delivered an initial discharge capacity of 1277 mA h g−1 with a CE of 70.9%. The properties of SGCF-700 are just a little better than those of SGCF-600. But after 135 cycles, SGCF-600 anodes only delivered a capacity of 496 mA h g−1, which is much lower than SGCF-700 anodes. The inferior properties of SGCF-600 could be attributed to the low degree of carbonization and poor nanofiber conductance. This result agrees with a recent study on PAN-based carbon for LIBs.29 The porous carbon nanofiber mats prepared by electrospinning act as a buffering matrix that can prevent the agglomeration of SnO2 particles, volume expansion, and mechanical stress during Li alloying and dealloying.31 The porous carbon nanofiber is used as an electrical conductor to compensate for the drawbacks of semiconductors such as SnO2 and Li2O. And it helps promote decomposition of SnOx as a semiconductor into Sn and Li2O. Moreover, the porous carbon nanofibers allow the charge transfer and mass transfer to facilitate lithiation/delithiation due to high electronic conductivity.5,29
Fig. 7c compares the cyclic stability and specific capacities of SGCF-700 and SCF-700 mats. It is clear that SGCF-700 mats exhibit much better cycling stability than SCF-700 electrodes. SCF-700 mats delivered an initial discharge capacity of 1637 mA h g−1 with a CE of 43.0%. Although the initial discharge of SGCF-700, 1273 mA h g−1, is lower than that of SCF-700. SGCF-700, a discharge capacity of 640 mA h g−1 in the 100th cycle, 1.25 times that of SCF-700 in the same cycle. Even after 480 cycles, SGCF-700 mats still delivered a discharge capacity of 600 mA h g−1, which is almost 50% higher than that of traditional graphitic anode (372 mA h g−1). In addition, the CE for SGCF-700 was also higher than that of SCF-700 in the fourth cycle in spite of CE being almost 100% in subsequent cycles. Besides, the high CE in SGCF-700 anodes after four cycles suggests high reversibility of SGCF-700 mats for the storage of lithium ions. Considering the difference between SGCF-700 and SCF-700, the improved properties of SGCF-700 could be attributed to the presence of graphene, which can affect the growth of nanoparticles resulting in ultra-small nanoparticles and suppress the agglomeration of tin alloys.10,28 Another reason for the high properties of SGCF-700 may be the ultra-small diameter (4 nm) of SnOx nanoparticles, which is close to the optimizing size (about 3–4 nm) of SnO2 for Li+ storage.36
Fig. 7d shows the rate capacities of SGCF-700 and SCF-700. SGCF-700 maintains reversible capacities of 850, 737, 613, 504, and 368 mA h g−1 at current densities of 100, 200, 500, 1000, and 2000 mA g−1, respectively. These values are higher than those of SCF-700 at corresponding current densities. This improvement could be attributed to the enhanced conductance arising from graphene. The synergistic effects arising from the ultra-small SnOx particles within the porous carbon nanofibers and graphene are further discussed for comparison. It is proven that the graphene can be used to improve the mechanical properties of porous carbon nanofiber mats made by electrospinning.
To demonstrate the superior electrochemical performance of SnOx–carbon-nanofiber (CNF) freestanding electrodes developed in this study, Table 1 compares the capacities and cycles of the electrodes prepared using similar SnOx-based materials and approaches taken from recent reports. Indeed, the SnOx–graphene–carbon fiber composites obtained in this study present relatively high capacities and superior cyclic stability.
| Material | Capacity (mA h g−1) | Current density | Ref. |
|---|---|---|---|
| SnOx–CNF | 674, 100th cycle | 500 mA g−1 | 5 |
| SnOx–CNF | 510, 40th cycle | 30 mA g−1 | 14 |
| SnOx–CNF | 450, 30th cycle | 25 mA g−1 | 46 |
| SnOx–CNF | 649, 100th cycle | 30 mA g−1 | 47 |
| SnOx–CNF | 608, 200th cycle | 500 mA g−1 | 48 |
| SnOx–CNF | 520, 100th cycle | 200 mA g−1 | 49 |
| SnOx–CNF | 512, 200th cycle | 200 mA g−1 | 50 |
| SnOx–G–CNF | 600, 480th cycle | 200 mA g−1 | This study |
| SnOx–G–CNF | 545, 1000th cycle | 200 mA g−1 |
In order to investigate the lithium-driven structural and morphological changes during the charge and discharge processes, we performed ex situ SEM analyses on the SGCF-700 electrodes before cycling and after the 1000th cycle and SCF-700 electrodes after the 100th cycle at a current density of 200 mA g−1; the SEM images are shown in Fig. 8. It can be seen in Fig. 8 that the structure and morphology of SGCF-700 electrodes maintain integrity (Fig. 8a and S5a†). However, in the case of SCF-700 electrodes, much of the aggregate was on the porous carbon nanofiber surfaces (Fig. 8b), and protuberant particles with diameters of 1–4 μm were dispersed in SGCFs (Fig. S5b†). The stark contrast between the two samples demonstrates that graphene not only can obviously improve specific capacity, but also can maintain cycling stability for LIBs.
 | ||
| Fig. 8 (a) SEM image of SGCF-700 after 1000 cycles. (b) SEM image of SCF-700 after 100 cycles. Both SGCF-700 and SCF-700 were tested at current density of 200 mA g−1. | ||
4. Conclusions
Flexible hierarchical porous mats of SGCFs were synthesized by reducing GO with stannous ions at room temperature and following electrospinning route. The SnOx nanoparticles (including SnO and SnO2) with ultra-small sizes were chemically embedded in the graphene–carbon nanofiber mats. As binder-free anodes for LIBs, the flexible SGCF mats obtained at 700 °C can deliver a discharge capacity of 545 mA h g−1 after 1000 cycles at a current density of 200 mA g−1 while it is only 509 mA h g−1 for the mats without graphene in the 100th cycle. The rate capacities of SGCF mats are also higher than those of SCFs at the same current densities. The excellent properties of SGCF mats can be ascribed to hierarchical networks serving as the highway for electrons and diffusion channels for ions, and to graphene for maintaining structural stability of SnOx nanoparticles and improving the conductivity of CNFs. It is believed that this strategy may be used for composite synthesis based on other compounds of valence-variable elements, graphene, and carbon fibers for the storage and transformation of energy.Acknowledgements
This research has been financially supported by the National Natural Science Foundation of China (51404103, 61376073, 21373081), Hunan Provincial Natural Science Foundation of China (11JJ7004, 14JJ3067), and Fundamental Research Funds for the Central Universities.Notes and references
- Z. Zhu, S. Wang, J. Du, Q. Jin, T. Zhang, F. Cheng and J. Chen, Nano Lett., 2013, 14, 153–157 CrossRef PubMed.
- X. Zhou, L.-J. Wan and Y.-G. Guo, Adv. Mater., 2013, 25, 2152–2157 CrossRef CAS PubMed.
- Y. Yu, L. Gu, C. Zhu, P. A. van Aken and J. Maier, J. Am. Chem. Soc., 2009, 131, 15984–15985 CrossRef CAS PubMed.
- G. Zhang, J. Zhu, W. Zeng, S. Hou, F. Gong, F. Li, C. C. Li and H. Duan, Nano Energy, 2014, 9, 61–70 CrossRef CAS PubMed.
- B. Zhang, Y. Yu, Z. Huang, Y.-B. He, D. Jang, W.-S. Yoon, Y.-W. Mai, F. Kang and J.-K. Kim, Energy Environ. Sci., 2012, 5, 9895–9902 CAS.
- G. Wang, H. Liu, J. Liu, S. Qiao, G. M. Lu, P. Munroe and H. Ahn, Adv. Mater., 2010, 22, 4944–4948 CrossRef CAS PubMed.
- M. Zhang, Y. Li, E. Uchaker, S. Candelaria, L. Shen, T. Wang and G. Cao, Nano Energy, 2013, 2, 769–778 CrossRef CAS PubMed.
- Y. N. Ko, S. B. Park and Y. C. Kang, Small, 2014, 10, 3240–3245 CrossRef CAS PubMed.
- P. Meduri, C. Pendyala, V. Kumar, G. U. Sumanasekera and M. K. Sunkara, Nano Lett., 2009, 9, 612–616 CrossRef CAS PubMed.
- S.-M. Paek, E. Yoo and I. Honma, Nano Lett., 2008, 9, 72–75 CrossRef PubMed.
- X. Zhou, Y.-X. Yin, L.-J. Wan and Y.-G. Guo, J. Mater. Chem., 2012, 22, 17456–17459 RSC.
- K. Sakaushi, Y. Oaki, H. Uchiyama, E. Hosono, H. Zhou and H. Imai, Small, 2010, 6, 776–781 CrossRef CAS PubMed.
- J. Zhu, J. Jiang, Y. Feng, G. Meng, H. Ding and X. Huang, ACS Appl. Mater. Interfaces, 2013, 5, 2634–2640 CAS.
- L. Zou, L. Gan, R. Lv, M. Wang, Z.-h. Huang, F. Kang and W. Shen, Carbon, 2011, 49, 89–95 CrossRef CAS PubMed.
- K. T. Lee, Y. S. Jung and S. M. Oh, J. Am. Chem. Soc., 2003, 125, 5652–5653 CrossRef CAS PubMed.
- N. Yesibolati, M. Shahid, W. Chen, M. N. Hedhili, M. C. Reuter, F. M. Ross and H. N. Alshareef, Small, 2014, 10, 2849–2858 CrossRef CAS PubMed.
- H.-X. Zhang, C. Feng, Y.-C. Zhai, K.-L. Jiang, Q.-Q. Li and S.-S. Fan, Adv. Mater., 2009, 21, 2299–2304 CrossRef CAS PubMed.
- Y. Yu, L. Gu, C. Wang, A. Dhanabalan, P. A. van Aken and J. Maier, Angew. Chem., Int. Ed., 2009, 48, 6485–6489 CrossRef CAS PubMed.
- X. W. Lou, C. M. Li and L. A. Archer, Adv. Mater., 2009, 21, 2536–2539 CrossRef CAS PubMed.
- E. Peled, C. Menachem, D. Bar-Tow and A. Melman, J. Electrochem. Soc., 1996, 143, L4–L7 CrossRef CAS PubMed.
- X.-L. Wang, M. Feygenson, M. C. Aronson and W.-Q. Han, J. Phys. Chem. C, 2010, 114, 14697–14703 CAS.
- J. Lin, Z. Peng, C. Xiang, G. Ruan, Z. Yan, D. Natelson and J. M. Tour, ACS Nano, 2013, 7, 6001–6006 CrossRef CAS PubMed.
- M. Zhang, D. Lei, Z. Du, X. Yin, L. Chen, Q. Li, Y. Wang and T. Wang, J. Mater. Chem., 2011, 21, 1673–1676 RSC.
- M. Zhang, D. Lei, X. Yu, L. Chen, Q. Li, Y. Wang, T. Wang and G. Cao, J. Mater. Chem., 2012, 22, 23091–23097 RSC.
- H. Wang, H. S. Casalongue, Y. Liang and H. Dai, J. Am. Chem. Soc., 2010, 132, 7472–7477 CrossRef CAS PubMed.
- Y. Wang, H. C. Zeng and J. Y. Lee, Adv. Mater., 2006, 18, 645–649 CrossRef CAS PubMed.
- L. Qie, W.-M. Chen, Z.-H. Wang, Q.-G. Shao, X. Li, L.-X. Yuan, X.-L. Hu, W.-X. Zhang and Y.-H. Huang, Adv. Mater., 2012, 24, 2047–2050 CrossRef PubMed.
- X. Zhou, J. Bao, Z. Dai and Y.-G. Guo, J. Phys. Chem. C, 2013, 117, 25367–25373 CAS.
- M. Zhang, F. Yan, X. Tang, Q. Li, T. Wang and G. Cao, J. Mater. Chem. A, 2014, 2, 5890–5897 CAS.
- E. Yoo, J. Kim, E. Hosono, H.-s. Zhou, T. Kudo and I. Honma, Nano Lett., 2008, 8, 2277–2282 CrossRef CAS PubMed.
- M. Zhang, E. Uchaker, S. Hu, Q. Zhang, T. Wang, G. Cao and J. Li, Nanoscale, 2013, 5, 12342–12349 RSC.
- B. Zhao, G. Zhang, J. Song, Y. Jiang, H. Zhuang, P. Liu and T. Fang, Electrochim. Acta, 2011, 56, 7340–7346 CrossRef CAS PubMed.
- Y. Kobayashi, V. Salgueiriño-Maceira and L. M. Liz-Marzán, Chem. Mater., 2001, 13, 1630–1633 CrossRef CAS.
- Z. Zhang, C. Shao, Y. Sun, J. Mu, M. Zhang, P. Zhang, Z. Guo, P. Liang, C. Wang and Y. Liu, J. Mater. Chem., 2012, 22, 1387–1395 RSC.
- H. Wang, J. T. Robinson, G. Diankov and H. Dai, J. Am. Chem. Soc., 2010, 132, 3270–3271 CrossRef CAS PubMed.
- C. Kim, M. Noh, M. Choi, J. Cho and B. Park, Chem. Mater., 2005, 17, 3297–3301 CrossRef CAS.
- J. Zhu, D. Lei, G. Zhang, Q. Li, B. Lu and T. Wang, Nanoscale, 2013, 5, 5499–5505 RSC.
- M.-S. Park, G.-X. Wang, Y.-M. Kang, D. Wexler, S.-X. Dou and H.-K. Liu, Angew. Chem., 2007, 119, 764–767 CrossRef PubMed.
- C. Guan, X. Wang, Q. Zhang, Z. Fan, H. Zhang and H. J. Fan, Nano Lett., 2014, 14, 4852–4858 CrossRef CAS PubMed.
- J. Zhu, G. Zhang, X. Yu, Q. Li, B. Lu and Z. Xu, Nano Energy, 2014, 3, 80–87 CrossRef CAS PubMed.
- X. Wang, X. Zhou, K. Yao, J. Zhang and Z. Liu, Carbon, 2011, 49, 133–139 CrossRef CAS PubMed.
- Y. Chen, Q. Z. Huang, J. Wang, Q. Wang and J. M. Xue, J. Mater. Chem., 2011, 21, 17448–17453 RSC.
- B. Guo, X. Wang, P. F. Fulvio, M. Chi, S. M. Mahurin, X.-G. Sun and S. Dai, Adv. Mater., 2011, 23, 4661–4666 CrossRef CAS PubMed.
- C.-M. Wang, W. Xu, J. Liu, J.-G. Zhang, L. V. Saraf, B. W. Arey, D. Choi, Z.-G. Yang, J. Xiao, S. Thevuthasan and D. R. Baer, Nano Lett., 2011, 11, 1874–1880 CrossRef CAS PubMed.
- L. Zhang, H. B. Wu, B. Liu and X. W. Lou, Energy Environ. Sci., 2014, 7, 1013–1017 Search PubMed.
- Y. Yu, Q. Yang, D. Teng, X. Yang and S. Ryu, Electrochem. Commun., 2010, 12, 1187–1190 CrossRef CAS PubMed.
- H.-R. Jung and W.-J. Lee, J. Electroanal. Chem., 2011, 662, 334–342 CrossRef CAS PubMed.
- X. Zhou, Z. Dai, S. Liu, J. Bao and Y.-G. Guo, Adv. Mater., 2014, 26, 3943–3949 CrossRef CAS PubMed.
- M. Zou, J. Li, W. Wen, Y. Lin, H. Lai and Z. Huang, Mater. Res. Bull., 2014, 60, 868–871 CrossRef CAS PubMed.
- S. Li, H. Yue, Q. Wang, W. Xie and D. He, Mater. Lett., 2014, 116, 271–274 CrossRef CAS PubMed.
Footnote |
| † Electronic supplementary information (ESI) available: SEM images of diverse samples, FT-IR spectra for rGO and GO and TEM images of the SGCF-700. See DOI: 10.1039/c5ta02107c |
| This journal is © The Royal Society of Chemistry 2015 |