 Open Access Article
Creative Commons Attribution 3.0 Unported Licence
Integrating theory, synthesis, spectroscopy and device efficiency to design and characterize donor materials for organic photovoltaics: a case study including 12 donors†
S. D.
Oosterhout
a,
N.
Kopidakis
*a,
Z. R.
Owczarczyk
a,
W. A.
Braunecker
a,
R. E.
Larsen
a,
E. L.
Ratcliff
b and
D. C.
Olson
a
aNational Renewable Energy Laboratory, 15013 Denver West Parkway, Golden, CO 80401, USA. E-mail: nikos.kopidakis@nrel.gov
bDepartment of Materials Science and Engineering, University of Arizona, 1306 E. University Blvd, Tucson, AZ 85721, USA
First published on 7th April 2015
Abstract
The remarkable improvements in the power conversion efficiency of solution-processable Organic Photovoltaics (OPV) have largely been driven by the development of novel narrow bandgap copolymer donors comprising an electron-donating (D) and an electron-withdrawing (A) group within the repeat unit. Given the large pool of potential D and A units and the laborious processes of chemical synthesis and device optimization, progress on new high efficiency materials can, and has been, slow with a few new efficient copolymers reported every year despite the large number of groups pursuing these materials. In this paper we present an integrated approach toward new narrow bandgap copolymers that uses theory to guide the selection of materials to be synthesized based on their predicted energy levels, and time-resolved microwave conductivity (TRMC) to select the best-performing copolymer–fullerene bulk heterojunction to be incorporated into complete OPV devices. We validate our methodology by using a diverse group of 12 copolymers, including new and literature materials, to demonstrate good correlation between (a) theoretically determined energy levels of polymers and experimentally determined ionization energies and electron affinities and (b) photoconductance, measured by TRMC, and OPV device performance. The materials used here also allow us to explore whether further copolymer design rules need to be incorporated into our methodology for materials selection. For example, we explore the effect of the enthalpy change (ΔH) during exciton dissociation on the efficiency of free charge carrier generation and device efficiency and find that ΔH of −0.4 eV is sufficient for efficient charge generation.
Introduction
Solution processed organic photovoltaics (OPV) provide an attractive approach for the conversion of solar energy to electricity, with high power conversion efficiencies up to 11% (ref. 1–6) recently achieved in single-junction devices. These devices utilize a polymer electron donor interfaced with a fullerene electron acceptor to efficiently separate photogenerated excitons into free carriers at the heterojunction. “Push–pull” copolymers, where electron donating (D) and electron withdrawing (A) monomer units are alternating along the polymer backbone, have been the main driver of the steady increase of power conversion efficiency and are widely considered state of the art for OPV donors. These copolymers allow for fine-tuning of many variables with synthetic modifications to the individual components, even though it is not always possible to predict the effect of a particular modification of the D or A unit to the properties of the polymer and, ultimately, to the final device efficiency. When considering the choice of copolymer material, there are various design parameters that influence the desired electronic properties. These parameters typically include (1) the optical bandgap of the polymer, which controls the absorption overlap with the solar spectrum;5,7 (2) the Ionization Energy (IE) of the polymer in the solid state, which influences the voltage output of the device;7 (3) the change in energy from the photoexcited exciton to free carriers, usually described as a change in Gibbs energy (ΔG),7–10 which affects the efficiency of the charge separation process as well as the voltage output of the device;8,11 (4) the side-chains on the backbone of the polymer, which influence solubility in different solvents, polymer stacking behavior in thin films, polymer–fullerene intercalation and nanoscale morphologies;12–15 and (5) molecular weight, which can influence transport, stacking, and morphology.16–18Given the enormous number of structures that can be envisioned for this one subcategory of OPV materials development, and accounting for the actual time it takes to synthesize these materials, polymer synthesis is one major bottleneck in the materials development process. Here we demonstrate that theory can be used to predict design parameters 1 and 2 above, therefore it can provide valuable guidance to choosing copolymer structures for efficient OPV devices. A second major bottleneck is the optimization of the devices, which is further affected by interfacial transport layers, charge collection at the electrodes, etc.19 Additionally, we show that contactless photoconductivity measurements in 5 ns–500 ns time scales can be used to select the most promising copolymers for device optimization. We recently reported on this methodology as a strategy to dramatically accelerate the materials development process for OPV polymers, focusing on a new class of push–pull copolymers based on a cyclopenta[c]thiophene-4,6-dione (CTD) electron withdrawing unit, shown in Fig. 1.20 Our approach comprised the following steps: (i) quantum chemical calculations were used to test suitable functionalization of the CTD electron withdrawing unit and appropriate electron donating units to predict push–pull copolymers with desired optoelectronic properties (optical bandgap and ionization energy); (ii) target polymers based on chemical intuition and guidance from the aforementioned calculations were synthesized; (iii) the contactless Flash-Photolysis Time-Resolved Microwave Conductivity (TRMC) method was then used to determine the ability of the polymer to generate long-lived (ns time scales) free charge carriers under illumination in a bulk heterojunction thin film; and (iv) fabrication and optimization of OPV devices was carried out. The use of quantum chemical calculations as a design and evaluation tool aims to address the synthetic bottleneck by focusing synthetic efforts on only the most promising materials. The use of the contactless TRMC probe aims to address the device optimization bottleneck by focusing device optimization efforts only on blends with intrinsically high carrier yields and/or mobilities.
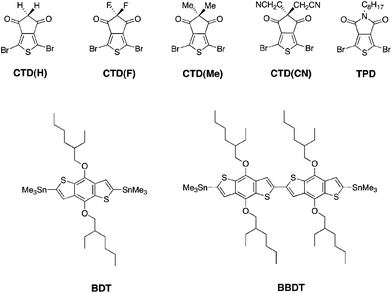
The purpose of the methodology described above is to provide a “flow chart” for the development of new OPV donors that can accelerate the discovery of new materials for higher efficiency devices. This, however, requires a larger-scale validation of (a) the theoretical prediction of the polymer energy levels and (b) TRMC as a tool for selection of the most efficient active layers for device optimization. In this work we demonstrate the validity of our approach by investigating 9 new and 3 literature polymers. The new materials include a family of new push–pull copolymers based on cyclopenta[c]thiophene-4,6-dione (CTD) and benzodithiophene (BDT), where we exploit the ease of synthetic functionalization of the CTD to produce new BDT–CTD copolymers (Scheme 1) with varying absorption onsets and energy levels. Further variation of the copolymers was achieved by configuring polymer backbones in the donating–withdrawing (D–A) (BDT–CTD) and D–D–A (bis-BDT–CTD, denoted BBDT–CTD) configuration. Utilizing the BBDT unit increased solubility of certain CTD-functionalized polymers, which in our previous work limited our ability to draw correlations in energetics due to the propensity of certain polymers to aggregate. We also include three commercially available donors (PTB7,21BDT–TPD,22 and P3HT23) as references to validate our methodologies, for a total of 12 different donor materials. Previously, correlations between DFT-predicted orbital energies and experimental quantities have been demonstrated for small molecular units24 but our current results provide validation of our general approach of using computational evaluation of polymeric materials before undertaking synthesis. We demonstrate good correlation between theoretically calculated energy levels of polymers, and experimentally determined ionization energies and electron affinities. Photoinduced carrier generation, probed by TRMC, also shows good correlation with device performance. These results demonstrate the validity of our design methodology and pave the way for its use for the accelerated design of new polymers donors for OPV.
Finally, the information on the optical bandgap, energy levels and photophysics for all materials studied here allow us to seek further refinement of our materials design methodology. Here we also address an important parameter pertaining to OPV materials design, namely the change in enthalpy (ΔH) during exciton dissociation to free charges, whose importance is still unresolved.8,19,25,26,54 We conclude that ΔH as low as −0.4 eV does not limit charge generation efficiency, which suggests that high open circuit voltages (Voc) need not be exclusive to high band gap polymers (>1.8 eV). In fact, one of the materials we present in this study achieves Voc = 0.95 V with an optical bandgap of 1.64 eV.
The paper is structured as follows: we first discuss the synthesis and characterization of the materials that are the test beds for this study. We then compare experimental optical bandgap and energy level values to those predicted from theory on these structures. Finally, we present TRMC results and their correlation to device performance and conclude with a set of simple design rules to select materials from theory to synthesis and from TRMC to device optimization.
Results and discussion
Materials synthesis and characterization
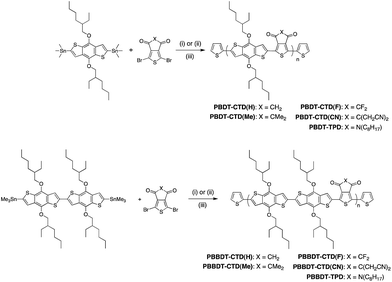
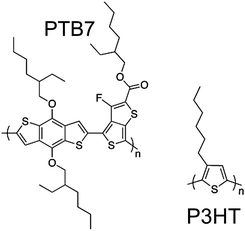
In this work, CTD(CN), CTD(F), CTD(H) and CTD(Me) are copolymerized with BDT and BBDT. As shown in our previous publication, Poly-BDT–CTD(F) (P-BDT–CTD(F)) and P-BDT–CTD(H) are insoluble in common organic solvents.20 However, by copolymerizing CTD(F) and CTD(H) with BBDT (Scheme 1), significantly more soluble materials were obtained, permitting us to obtain a systematic trend in optoelectronic properties with hydrogen, methyl, fluorine, and cyanomethyl-substituted CTD units (Fig. 1). Moreover, the switch from the D–A (BDT–CTD) comonomer to a D–D–A (BBDT–CTD) comonomer also shifts the highest occupied molecular orbital (HOMO) and lowest unoccupied molecular orbital (LUMO) levels closer to vacuum, and changes the optical band gap, as described below. We also synthesized copolymers of BDT and BBDT with thienopyrrolodione (TPD) for comparison.The copolymers were synthesized using Pd-catalyzed cross-coupling between the corresponding CTD or TPD and BDT or BBDT comonomers, followed by end-capping with 2-(tributylstannyl)thiophene and 2-bromothiophene (Scheme 1). Synthetic details of these monomers and polymers are provided in the Experimental section. Molecular weight data and additional characterization is provided in Table 1. Additionally, 2 high performance commercially available OPV polymers (Fig. 2) were included in this study as standards for the development of our integrated design methodology.
| Polymer | M n (kDa) | PDI | λ max (nm) (calc) | λ max/λ0.1max (nm) (solution) | Optical band gap (calc) (eV) | Optical band gap (film) (eV) | IE from UPS (eV) |
|---|---|---|---|---|---|---|---|
| a These polymers were insoluble (see text). | |||||||
| P-BDT–CTD(CN) | 10 | 1.5 | 785 | 681/739 | 1.58 | 1.59 | −5.61 |
| P-BDT–CTD(F)a | — | — | 795 | — | 1.56 | — | — |
| P-BDT–CTD(H)a | — | — | 738 | — | 1.68 | — | — |
| P-BDT–CTD(Me) | 84 | 3.0 | 737 | 646/709 | 1.68 | 1.64 | −5.33 |
| P-BDT–TPD | 46 | 2.2 | 670 | 632/667 | 1.85 | 1.72 | −5.09 |
| P-BBDT–CTD(CN) | 10 | 1.5 | 737 | 650/719 | 1.68 | 1.62 | −5.65 |
| P-BBDT–CTD(F) | 25 | 4.5 | 756 | 679/753 | 1.64 | 1.51 | −5.44 |
| P-BBDT–CTD(H) | 18 | 3.2 | 713 | 631/679 | 1.74 | 1.70 | −5.09 |
| P-BBDT–CTD(Me) | 18 | 3.1 | 713 | 617/665 | 1.74 | 1.74 | −5.12 |
| P-BBDT–TPD | 27 | 3.0 | 670 | 581/630 | 1.85 | 1.85 | −4.99 |
A comparison of the solution absorption spectra of the BBDT series of polymers (left panel of Fig. 3) illustrates the very systematic shift in absorption with the strength of the electron withdrawing group of the acceptor comonomer: λmax red shifts more than 100 nm as the substituents on the acceptor become increasingly electron withdrawing (N-alkyl on TPD to Me, H, MeCN, and F on CTD).27 A systematic red shift of approximately 30 nm or more is also observed between BBDT and BDT copolymers with analogous electron withdrawing comonomers (right panel of Fig. 3), as the switch to BBDT effectively decreases the push–pull effect in the copolymer, since the electron withdrawing unit becomes less dominant. These figures illustrate the power of synthetic chemistry to manipulate and fine-tune optical band gaps in these materials.
 | ||
| Fig. 3 Normalized polymer absorbance spectra in CHCl3 solution. (Left) Series of BBDT containing polymers. (Right) Comparison of BDTvs.BBDT containing polymers. | ||
Energy level dependence on polymer structure: theory and experiment
The principal “selection rule” for choosing donor polymers for efficient OPV performance with PCBM acceptors is related to their energy levels. The best compromise between low optical bandgap (Eopt), for improved overlap with the solar spectrum, and a deep HOMO level (EHOMO negative with respect to vacuum) for high Voc, is reached for 1.5 < (Eopt/eV) < 1.8 and −5.7 < (EHOMO/eV) < −4.8.9,28 In addition, the exciton energy of the polymer, which is related to the optical bandgap, influences the energetic driving force for charge carrier generation and also needs to be considered,8 as discussed further below.The predictive power of theory for the purpose of OPV donor design is that it can accurately calculate the values of Eopt and EHOMO, therefore it can help select the most promising materials for synthesis. In the following we validate this proposition using our 12 polymer donors and comparing theoretical and experimental values for the energy levels of the systems.
Quantum chemical calculations were utilized to predict the energy levels of the new CTD-containing polymers and of the 2 literature donors presented above. The solid diamonds in Fig. 4 show the highest occupied Kohn–Sham molecular orbital energy calculations on these polymers, and the corresponding “optical LUMO”, which we define to be the HOMO + energy gap (calculated lowest excited state energy).29 Further details about calculations are described in the Experimental section. Here we note that our use of the optical LUMO is justified since we are using the optical LUMO energy as an estimate for the energy of the excited state of the polymer (see below) and not as a transport level.29
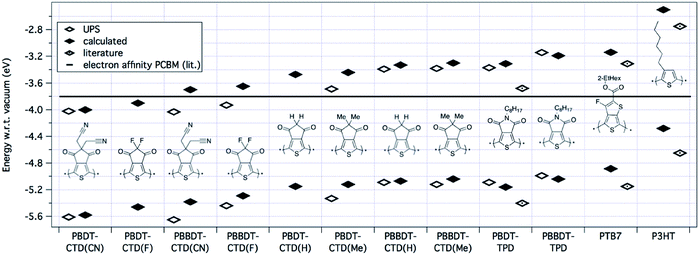 | ||
| Fig. 4 HOMO/LUMO levels of polymers determined by calculation, ionization energy from UPS, we define the experimental LUMO level adding the band gap of the polymer as measured optically in a thin film to the IE. Literature values are displayed for P-BDT–TPD,30PTB7,21 and P3HT.23 The black line in the figure represents the electron affinity of PCBM.9 | ||
Ultraviolet photoelectron spectroscopy (UPS) measurements were carried out on films of the pure polymer on ITO substrates, with representative spectra shown in the ESI.† Ionization energies (IEs) were determined from the observed onset in the occupied density of states; these values are included in Table 1 and as open diamonds in Fig. 4. Also shown in Fig. 4 are the calculated optical LUMOs and the experimental values for the IE plus the optical band gap as obtained from absorption measurements of thin films. Note that because the optical gap is defined experimentally as the energy at which the absorption spectrum is at 10% of the reddest peak in the spectrum, whereas the theoretical gap would correspond to the energy of the top of the lowest energy absorption peak, we expect the measured gaps to be slightly lower than the predicted gaps due to peak broadening.
The experimental values are compared to the theoretical ones in Fig. 5, showing good agreement (linear fit value and Pearson's coefficient shown in figure) and validating the theoretical methodology as a tool to predict energy levels of candidate donor materials. It is worth noting that in most cases, the calculated HOMO energies are closer to vacuum than the measured IE values. We would expect the measured IE values to be smaller than the −HOMO values (closer to vacuum), not larger, due to possible band tails in films. We rationalize this systematic deviation as an artifact of our choice of basis set for the DFT calculations. As noted in the Theoretical methods section below, we have found that increasing the basis set size by adding diffuse functions (from 6-31g(d) to 6-31+g(d)) leads to a systematic downward shift of HOMO values by 0.2–0.3 eV while leaving the predicted gaps unchanged. Adding additional diffuse functions or polarization functions to the basis results in almost no change in predicted HOMO values. Hence, we consider the 6-31g(d) basis set calculations, which are standard within the field as a compromise between accuracy and computational speed, to be accurate to within an offset of a few tenths of an eV from experiment.
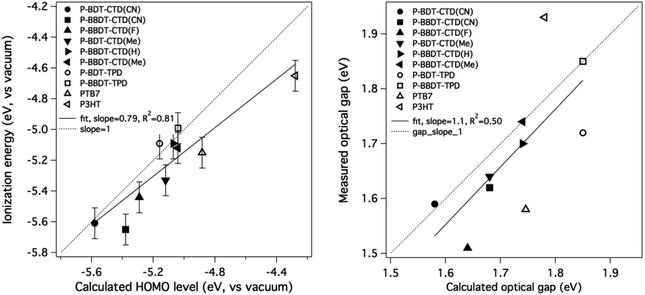 | ||
| Fig. 5 Comparison of calculated HOMO with measured IE (left) and (HOMO + calculated optical gap) with (IE + measured optical gap) (right). The straight line is not a fit to the data, but has a slope of 1. Literature values are used as measured values for PTB7 (ref. 21) and P3HT.23 | ||
The results presented above show that by using 2 BDT units for every CTD unit instead of one, the polymer becomes easier to oxidize (decreased IE, or HOMO closer to vacuum) and the optical LUMO shifts closer to the vacuum level, for all copolymers with CTD derivative or TPD unit. Fluorine atoms on the CTD unit (CTD(F)) result in the strongest electron accepting unit of the series studied, and the smallest band gap of the series. By decreasing the strength of the electron withdrawing group on the CTD unit (i.e. F > CN > H > Me) we observe increases in the band gap, which ultimately, increases the energy of the photogenerated exciton (Eexc). Likewise, we would expect that increasing the strength of the electron withdrawing group should increase the ionization energy (make the polymer harder to oxidize). This is generally true, except for comparison between the fluoro- and cyano-substituted CTD units, where the IE is slightly larger for polymers with CTD(CN), relative to CTD(F). We have no explanation for this effect, and it is currently under investigation.
Overall, by using the class of the BDT-based copolymers, we can tune the IEpolymer by ca. 0.8 eV by the choice of the electron-withdrawing unit, as predicted by DFT. This readily gives us the opportunity to systematically study the energy dependence of the process of free charge generation in more detail to predict device performance. For example, the optical LUMO energy of P-BBDT–CTD(F) is −3.65 eV, which is only 0.15 eV above the electron affinity (−3.80 eV (ref. 5, 7 and 9)) of the fullerene acceptor phenyl-C61-butyric acid methyl ester (PCBM), as shown by the black line in Fig. 4. However, as discussed in more detail in the next section, charge separation still occurs at the interface between P-BBDT–CTD(F) and PCBM. The energy levels of unsubstituted and methyl-substituted CTD monomers are closer to vacuum, and these would be considered more suitable as donor materials in OPV with PCBM as the acceptor. Furthermore, the CTD-class polymers have IEs and EAs that should better match the energy levels of PCBM than either P-BDT–TPD or PTB7. Therefore, the polymers based on the CTD unit are predicted to have a smaller energy loss upon charge separation. P-BDT–TPD12–15,31,32 and PTB7 (ref. 6 and 16–18) already reach efficiencies up to 8.5 and 9.2%, respectively, so this suggests the potential of the CTD class of polymers studied in this paper to create highly efficient devices.
Additional energetic considerations: dependence of free carrier generation on enthalpy change
In the previous section we discussed design considerations for OPV copolymers based on their bandgap and the HOMO energy. Here we investigate the influence of an additional parameter, the change in enthalpy, ΔH, of the system during electron transfer step from the photoexcited donor to the PCBM and its effect on free carrier generation. ΔH is defined as ΔH = (IEpolymer − EAfullerene) − Eexc, where IEpolymer is measured by UPS, EA is the electron affinity of the acceptor as measured by inverse photoemission spectroscopy (IPES) (−3.80 eV for PCBM9,19) and Eexc is the energy of the exciton (estimated here from the absorption maximum). We note that a better description of the thermodynamics of electron transfer would consider the change in Gibbs energy,8,20,26,33 however the diversity of donors used here, and the associated changes in solid state structure of the bulk heterojunctions, makes it impossible to accurately estimate the change in entropy during electron transfer. The purpose of this section is to discuss the dependence of the processes of exciton quenching and free charge generation on ΔH, motivated by the fact that the design of donor polymers is guided by their energy levels, IE and IE + Eexc, as determinants of the open circuit voltage (Voc) and the overlap with the solar spectrum, respectively. These same energy levels however might also play an important role in determining the efficiency of free carrier generation following light absorption, via the dependence of this process on ΔH. The enthalpy change, ΔH, is negative in these material systems, hence separation of the exciton into free charges is energetically favored and varies between 0 and −1 eV for the donors considered here. The question we aim to answer is: what is the range of ΔH that results in efficient free charge carrier generation? In the following we probe both exciton dissociation (by PL quenching) and free charge carrier generation (by TRMC) to address this question.Exciton quenching was probed by steady-state photoluminescence (PL) measurements. Thin films of the blends with 1![[thin space (1/6-em)]](https://www.rsc.org/images/entities/char_2009.gif) :
:![[thin space (1/6-em)]](https://www.rsc.org/images/entities/char_2009.gif) 1 polymer
1 polymer![[thin space (1/6-em)]](https://www.rsc.org/images/entities/char_2009.gif) :
:![[thin space (1/6-em)]](https://www.rsc.org/images/entities/char_2009.gif) PCBM blend ratios were deposited on quartz substrates. The PL intensity for the bulk heterojunction films were compared to the pure donors, and the PL quenching efficiency determined by dividing the peak value of a spectrum of a blend film by the peak value of the spectrum of the pure material. The PL quenching efficiency versus −ΔH is plotted in Fig. 6. As −ΔH increases, the PL quenching efficiency increases due to exciton splitting at the polymer–fullerene interface competing with exciton recombination, as expected. We find that PL quenching is efficient (40% or higher) even for ΔH close to zero, and almost complete quenching is observed for −ΔH > 0.1 eV.
PCBM blend ratios were deposited on quartz substrates. The PL intensity for the bulk heterojunction films were compared to the pure donors, and the PL quenching efficiency determined by dividing the peak value of a spectrum of a blend film by the peak value of the spectrum of the pure material. The PL quenching efficiency versus −ΔH is plotted in Fig. 6. As −ΔH increases, the PL quenching efficiency increases due to exciton splitting at the polymer–fullerene interface competing with exciton recombination, as expected. We find that PL quenching is efficient (40% or higher) even for ΔH close to zero, and almost complete quenching is observed for −ΔH > 0.1 eV.
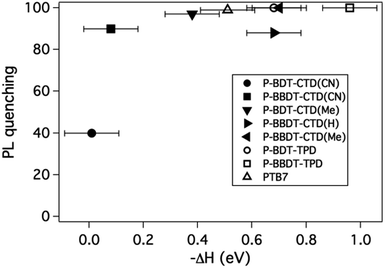 | ||
| Fig. 6 PL quenching efficiency for blends of various polymers in a 50% blend with PCBM, versus the pure material as function of ΔH as described in the text. | ||
In order to probe the efficiency of charge carrier generation in these new polymers in blends with PCBM, photoconductance was measured with the contactless time-resolved microwave conductivity (TRMC) technique, using the same samples as used for the PL experiments. The samples were placed in a resonance microwave cavity at the end of an X-band waveguide and photoexcited using a 5 ns laser pulse. The relative change in microwave power in the cavity as microwaves are absorbed by photoinduced free electrons and holes is proportional to the photoconductance (ΔG) of the sample, which relates to the yield of free carrier generation (φ) per absorbed photon multiplied by the sum of the local mobilities (∑μ) of free carriers (eqn (1)). The product (φ∑μ) is the principal figure-of-merit extracted from TRMC measurements in this work:2,34,35
| ΔG = βqeI0FA(φ∑μ) | (1) |
In the following we measure the φ∑μ figure of merit, taken from the peak of the photoconductance transients and use it to discuss the efficiency of free carrier generation during the excitation pulse as a tool for selecting active layer materials for efficient OPV devices. TRMC probes the primary step in the photocurrent generation process, which is the generation, with quantum efficiency φ, of free charges with mobilities ∑μ. While the φ∑μ figure of merit depends on the solid state structure of the film, it is much less sensitive to the details of optimization of a given active layer than the long-range percolation of charges to electrodes in a complete device.5 Hence the applicability of TRMC as a tool to select promising active layers for device optimization arises from the observation that a high value for φ is a necessary (but not sufficient) condition for an efficient device. For example, although the molecular weight of these polymers is fairly low, with P-BDT–CTD(Me) and P-BDT–TPD as exception, we have found that φ∑μ is fairly independent of molecular weight, based upon TRMC measurements on different molecular weight batches of P-BDT–CTD(Me) (not shown).8,19,20,25,26
Representative photoconductance transients are shown in the ESI.† A full analysis of photoconductance decays and their relation to loss mechanisms (recombination and trapping) of charges after the end of the laser pulse will be presented in a forthcoming publication.
Here, the φ∑μ of the 50% blend of polymer and PCBM is used as identifier for potentially efficient active layers in OPV, since it shows good correlation with device performance (vide infra).
In contrast to the PL results, there is no clear trend in the TRMC figure-of-merit versus ΔH (Fig. 7). We note that although ΔH, which depends on the molecular structure of the donors as discussed above, might be expected to influence the quantum yield for free carrier generation, φ,8,9,25,29 the sum of the mobilities of the free carriers, ∑μ, also depends on the molecular structure, but is also influenced by the solid state microstructure of the blend.4,29,34,36–39 It is therefore not surprising that no clear correlation between ΔH and φ∑μ is observed in this work. It is however noteworthy that a number of successful OPV donors that also exhibit the highest φ∑μ measured here, are clustered around −ΔH = 0.4–0.7 eV, suggesting that a −ΔH as low as 0.4 eV can still result in efficient free charge carrier generation in OPV bulk heterojunctions. This is in agreement with several other publications,8,19,25,26 although there have been reports of even lower numbers as well.54 This conclusion is another selection rule that should be considered in OPV donor design, in addition to the optical bandgap and HOMO energy as discussed above. Since ΔH can be calculated, it should be used to further refine the set of predicted polymer materials for efficient OPV.
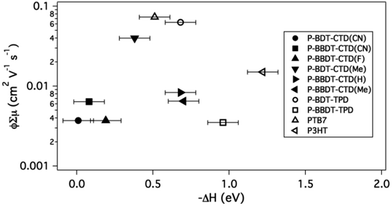 | ||
| Fig. 7 Logarithmic plot of TRMC signal (ϕ∑μ) of 50% blends of polymers with PCBM versus enthalpy change (ΔH) for the exciton splitting process. Literature values are used for the HOMO level (for calculating ΔH) of PTB7,21 and P3HT.23 | ||
We note that, in principle, one more parameter for this system should be considered, namely the reorganization energy during electron transfer.33 However, accurate calculation of the reorganization energy is challenging and goes beyond the somewhat straightforward DFT calculations presented here. A methodology for calculating the reorganization energy is under development and will be added to further refinements of our integrated materials design methodology.
Device characterization and comparison with TRMC
In this section we compare the TRMC figure of merit with device efficiency results for our test bed materials, in order to validate TRMC as a “screening tool” for efficient polymer–fullerene combinations.Photovoltaic devices were made in the glass/ITO/hole contact layer (HCL)/polymer![[thin space (1/6-em)]](https://www.rsc.org/images/entities/char_2009.gif) :
:![[thin space (1/6-em)]](https://www.rsc.org/images/entities/char_2009.gif) PCBM/electron contact layer (ECL) configuration. The ECL is Ca/Al, and as HCL, either PEDOT
PCBM/electron contact layer (ECL) configuration. The ECL is Ca/Al, and as HCL, either PEDOT![[thin space (1/6-em)]](https://www.rsc.org/images/entities/char_2009.gif) :
:![[thin space (1/6-em)]](https://www.rsc.org/images/entities/char_2009.gif) PSS or MoO3 was used. Devices were optimized for polymer
PSS or MoO3 was used. Devices were optimized for polymer![[thin space (1/6-em)]](https://www.rsc.org/images/entities/char_2009.gif) :
:![[thin space (1/6-em)]](https://www.rsc.org/images/entities/char_2009.gif) PCBM ratio, thickness, and solvent combination (for optimized efficiencies, see Table 2). Saeki et al.40 correlated the power conversion efficiency (PCE) divided by the open circuit voltage (Voc) (PCE/Voc, or Jsc × FF) with the φ∑μ. The efficiency was divided by the Voc because TRMC only probes carrier generation and mobility, not the energy of the carriers. We found a similar trend in our data, as shown in Fig. 8. This leads to the conclusion that the TRMC figure of merit, φ∑μ, of blends of polymers with fullerene can help us predict device performance for new active layer materials. Thus TRMC characterization allows for evaluation of materials performance without requiring fabrication or optimization of full solar cell devices that necessarily includes the laborious task of optimization of processing, electrodes, and device architectures.41 Based on the data from Fig. 8, efficient devices will result for materials with ϕ∑μ ≥ 0.01 cm2 V−1 s−1. We note that this value will not depend on excitation intensity as it should be the value taken at low excitation intensity, in the linear response regime of the photoconductance of the system.2,34,38
PCBM ratio, thickness, and solvent combination (for optimized efficiencies, see Table 2). Saeki et al.40 correlated the power conversion efficiency (PCE) divided by the open circuit voltage (Voc) (PCE/Voc, or Jsc × FF) with the φ∑μ. The efficiency was divided by the Voc because TRMC only probes carrier generation and mobility, not the energy of the carriers. We found a similar trend in our data, as shown in Fig. 8. This leads to the conclusion that the TRMC figure of merit, φ∑μ, of blends of polymers with fullerene can help us predict device performance for new active layer materials. Thus TRMC characterization allows for evaluation of materials performance without requiring fabrication or optimization of full solar cell devices that necessarily includes the laborious task of optimization of processing, electrodes, and device architectures.41 Based on the data from Fig. 8, efficient devices will result for materials with ϕ∑μ ≥ 0.01 cm2 V−1 s−1. We note that this value will not depend on excitation intensity as it should be the value taken at low excitation intensity, in the linear response regime of the photoconductance of the system.2,34,38
| Polymer | V oc (V) | J sc (mA cm−2) | FF | Eff (%) | Thickness (nm) |
|---|---|---|---|---|---|
| P-BDT–CTD(CN) | 0.75 (0.89) | 0.38 (0.40) | 0.30 (0.29) | 0.08 (0.10) | 135 |
| P-BBDT–CTD(CN) | 0.82 (0.90) | 2.0 (1.9) | 0.35 (0.38) | 0.56 (0.76) | 45 |
| P-BBDT–CTD(F) | 0.75 (0.75) | 3.3 (3.7) | 0.38 (0.38) | 0.93 (1.1) | 60 |
| P-BDT–CTD(Me) | 0.94 (0.95) | 7.9 (8.3) | 0.51 (0.52) | 3.7 (4.1) | 77 |
| P-BBDT–CTD(H) | 0.85 (0.86) | 6.8 (6.8) | 0.46 (0.47) | 2.6 (2.7) | 75 |
| P-BBDT–CTD(Me) | 0.89 (0.90) | 6.8 (6.8) | 0.52 (0.53) | 3.2 (3.2) | 95 |
| P-BBDT–TPD | 0.89 (0.89) | 5.4 (5.5) | 0.50 (0.51) | 2.4 (2.5) | 130 |
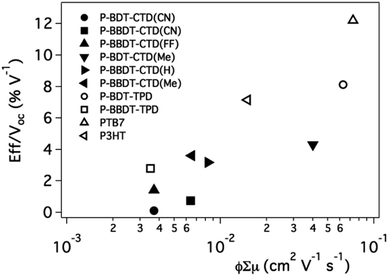 | ||
| Fig. 8 J sc × FF as function of φ∑μ. Literature device data is used for P-BDT–TPD,32PTB7 (ref. 6) and, P3HT.42 | ||
The Internal Quantum Efficiency (IQE) of OPV devices is proportional to the charge generation efficiency per absorbed photon and the charge collection efficiency. The IQE was determined for the optimized devices by correcting the measured EQE for light absorption within the active layer, determined by reflectance measurements using an integrating sphere. Low φ, measured by TRMC, would intuitively imply that the IQE is also low. To first order, a greater amount of free carrier generation is expected to result in higher internal quantum efficiency in photovoltaic devices.
The IQE is plotted versus the TRMC figure-of-merit in Fig. 9 (left panel). However, in contrast to our expectation, there appears to be no strong trend between φ∑μ, and the measured IQE. This indicates that although TRMC is a powerful technique to predict device performance, the IQE is also dependent on other factors, which are not evaluated in TRMC, such as long-range charge transport and charge extraction from the active layer to the electrodes.
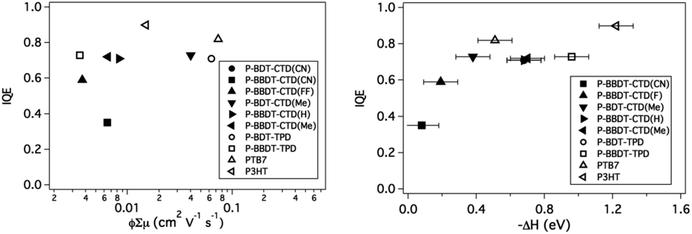 | ||
| Fig. 9 IQE vs. ϕ∑μ (left) and IQE vs. ΔH. IQE values are taken from literature for P3HT.43 | ||
Interestingly, when the IQE is plotted versus −ΔH (right panel), a clear trend is observed: the IQE increases as −ΔH is increased and remains high for all materials with −ΔH > 0.4 eV, providing further validation of our selection criterion for ΔH discussed above. Additionally, the polymers with low −ΔH required relatively thin active layers to achieve these high internal quantum efficiencies, which indicates that recombination in the active layer is higher in blends with these polymers. This property is also reflected in the low fill factor (FF) of the devices.
Conclusion
In conclusion, we present and validate a methodology for designing copolymer donors for OPV that uses theory to select materials that can lead to high efficiencies, and TRMC to select the best-performing materials for device optimization. This methodology has the potential to greatly accelerate copolymer development for OPV, as it focuses the time-consuming tasks of synthesis and device optimization to only a small subset of structures. We exploit the electronic and structural tunability of CTD to design a set of copolymers that have a range of different energy levels for application in OPV and also use three well-known literature polymers as reference. Calculations predict a trend in IE and optical absorption gaps that are experimentally confirmed using UPS and optical measurements. The enthalpy change during charge separation of the exciton, ΔH, in the donor–acceptor BHJ system is systematically varied in order to optimize charge generation efficiency, while minimizing energy loss in the exciton separation step.PL and complementary TRMC experiments were used to verify the charge separation efficiency in a bulk heterojunction of polymer and PCBM. The PL quenches to a larger extent as the −ΔH is increased. The TRMC data does not show correlation of φ∑μ with −ΔH. However, the TRMC is a useful tool to identify potential high-efficiency materials prior to device fabrication, since there is a correlation between the measured φ∑μ and the efficiency divided by open circuit voltage. This eliminates the need for time-consuming device optimization for low-performance polymers.
The internal quantum efficiency (IQE) is linked to −ΔH, where we observe an optimal value of 0.4 eV needed for efficient charge generation and collection within the device. Additional recombination experiments confirm that below this value, not only does charge generation decrease but recombination in the layer increases, thereby limiting device performance.
The correlation between theoretically predicted and experimentally measured energy levels, and between the TRMC figure of merit and device efficiency, suggest that the following criteria can be used for copolymer design:
Theory: select materials for synthesis that have theoretical Eopt, EHOMO and ΔH in the range: 1.5 < (Eopt/eV) < 1.8, −5.7 < (EHOMO/eV) < −4.8 and −ΔH/eV > 0.4.
TRMC: select materials for device optimization that (in the linear response regime) have φ∑μ ≥ 0.01 cm2 V−1 s−1.
While these selection rules by no means cover all the processes that determine OPV device efficiency, they can still greatly accelerate polymer donor design and evaluation. As an example, from 60![[thin space (1/6-em)]](https://www.rsc.org/images/entities/char_2009.gif) 000 theoretical polymers in our OPV design database, only 4425 (7.3%) fulfill the theoretical requirements presented above (taking into account the typical 0.2 eV shift associated with the DFT calculations based on the 6-31G(d) basis set only, see Experimental). This demonstrates the power of relatively straightforward DFT calculations in guiding materials design through the vast pool of monomers and comonomers that can be envisioned as building blocks for OPV polymer absorbers. We note that our approach can be applied to find materials with any desired range for Eopt and EHOMO; for example, one can use it to select wide optical bandgap materials for tandem devices.
000 theoretical polymers in our OPV design database, only 4425 (7.3%) fulfill the theoretical requirements presented above (taking into account the typical 0.2 eV shift associated with the DFT calculations based on the 6-31G(d) basis set only, see Experimental). This demonstrates the power of relatively straightforward DFT calculations in guiding materials design through the vast pool of monomers and comonomers that can be envisioned as building blocks for OPV polymer absorbers. We note that our approach can be applied to find materials with any desired range for Eopt and EHOMO; for example, one can use it to select wide optical bandgap materials for tandem devices.
The selection criteria discussed here for absorber design are only related to the energies (Eopt, EHOMO and ΔH). It is increasingly being recognized that while choosing materials based on molecular energy levels is useful, changes between the solid state structure of these materials may have an equal influence on final device performance.54 For example, in a literature survey of donor copolymers, EHOMO does not show a clear correlation with Voc other than a general trend of higher Voc as EHOMO becomes deeper than −4.8 eV vs. vacuum.7 Indeed, we do not obtain a clear correlation between EHOMO and Voc in the donor materials presented here. This creates the need to expand the design methodology for OPV active layer materials to also include properties of the structure in the solid state, which is a considerably more challenging and computationally expensive task that we hope to report on in the near future. Still, the selection of materials will have to start from the much simpler energy level calculations reported here.
Experimental
Theoretical methods
Density functional theory (DFT) and time-dependent density functional theory (TDDFT) were used to predict the properties of the polymers reported in this work for hydrogen-terminated oligomers with n = 1, 2. All calculations were performed with the default settings in the Gaussian 09 electronic structure package, revision B.01.44 The geometric structure of each oligomer was optimized in vacuum using the Becke-style three-parameter density functional with the Lee-Yang-Parr correlation function (B3LYP) with the 6-31G(d) basis set; subsequently, for a few structures, diffuse functions were included (6-31+G(d)) for calculation of the orbital energies and optical absorption spectra of the optimized structures. Including diffuse functions had little effect on the predicted absorption spectra; the main change was a systematic shift of the molecular orbital energies down by ∼0.2–0.3 eV.Extrapolation to the polymer limit was performed using a novel Huckel-like model that will be described in detail in a separate manuscript.45 In its simplest form, used here, this model predicts that all computed electronic quantities reported can be taken to vary according with number of monomer units, n, as,
 | (2) |
Time-resolved microwave conductivity
TRMC is a pump-probe technique that can be used to measure the photoconductance of a film without the need for charge collection at electrical contacts.34,46,47 The details of the experimental methodology have been presented elsewhere.34,48 In brief, the sample is placed in a microwave cavity at the end of an X-band waveguide operating at ca. 9 GHz, and is photoexcited through a grid with a 5 ns laser pulse from an Optical Parametric Oscillator (OPO) pumped by the third harmonic of an Nd:YAG laser. The relative change of the microwave power, P, in the cavity, due to absorption of the microwaves by the photoinduced free electrons and holes, is related to the transient photoconductance, ΔG, by ΔP/P = −KΔG, where the calibration factor K is experimentally determined individually for each polymer. Taking into account that the electrons and holes are generated in pairs, the peak photoconductance during the laser pulse can be expressed as34| ΔG = βqeI0FA(ϕ∑μ) | (3) |
OPV device fabrication and characterization
10 nm MoO3 was evaporated onto a patterned glass/ITO substrate (Edwards Auto 306 thermal evaporator, base pressure 4 × 10⁻⁶ mbar) as a hole transport layer. For some devices, PEDOT![[thin space (1/6-em)]](https://www.rsc.org/images/entities/char_2009.gif) :
:![[thin space (1/6-em)]](https://www.rsc.org/images/entities/char_2009.gif) PSS (Clevios P VP Al 4083) was spin coated instead, at 4000 rpm leading to a thickness of 35 nm. The parameters leading to best device performance for the different polymers are summarized in the ESI.† The devices were completed by thermal evaporation of a top electrode composed of Ca/Al (20 nm/100 nm) using an Angstrom Engineering thermal evaporator with a base pressure below 3 × 10⁻⁷ Torr, defining an active device area of 0.11 cm2. All subsequent handling and analysis of the devices were carried out under an inert atmosphere. Thin films used for absorption, PL and TRMC were fabricated in an analogous way. Devices were illuminated using a Newport Oriel Sol3A class AAA solar simulator, and J–V curves were measured in both dark and 1 sun illumination. The measured short circuit current was corrected for spectral mismatch, following the procedure of Shrotriya et al.49 EQE was measured using a Newport Oriel IQE200 system with lock-in detection.
PSS (Clevios P VP Al 4083) was spin coated instead, at 4000 rpm leading to a thickness of 35 nm. The parameters leading to best device performance for the different polymers are summarized in the ESI.† The devices were completed by thermal evaporation of a top electrode composed of Ca/Al (20 nm/100 nm) using an Angstrom Engineering thermal evaporator with a base pressure below 3 × 10⁻⁷ Torr, defining an active device area of 0.11 cm2. All subsequent handling and analysis of the devices were carried out under an inert atmosphere. Thin films used for absorption, PL and TRMC were fabricated in an analogous way. Devices were illuminated using a Newport Oriel Sol3A class AAA solar simulator, and J–V curves were measured in both dark and 1 sun illumination. The measured short circuit current was corrected for spectral mismatch, following the procedure of Shrotriya et al.49 EQE was measured using a Newport Oriel IQE200 system with lock-in detection.
Synthesis of materials
High molecular weight P-BDT–CTD(Me) was synthesized as published in our earlier publication.20
Acknowledgements
This work was supported by the U.S. Department of Energy under Contract no. DE-AC36-08-GO28038 with the National Renewable Energy Laboratory through the DOE SETP program.Notes and references
- M. A. Green, K. Emery, Y. Hishikawa, W. Warta and E. D. Dunlop, Prog. Photovoltaics, 2015, 23, 1–9 Search PubMed.
- A. J. Ferguson, N. Kopidakis, S. E. Shaheen and G. Rumbles, J. Phys. Chem. C, 2008, 112, 9865–9871 CAS.
- G. Li, R. Zhu and Y. Yang, Nat. Photonics, 2012, 6, 153–161 CrossRef CAS.
- T. Savenije, J. Kroeze, M. Wienk, J. Kroon and J. Warman, Phys. Rev. B: Condens. Matter Mater. Phys., 2004, 69, 155205 CrossRef.
- W. L. Rance, A. J. Ferguson, T. McCarthy-Ward, M. Heeney, D. S. Ginley, D. C. Olson, G. Rumbles and N. Kopidakis, ACS Nano, 2011, 5, 5635–5646 CrossRef CAS PubMed.
- Z. He, C. Zhong, S. Su, M. Xu, H. Wu and Y. Cao, Nat. Photonics, 2012, 6, 591–595 Search PubMed.
- P.-L. T. Boudreault, A. Najari and M. Leclerc, Chem. Mater., 2011, 23, 456–469 CrossRef CAS.
- D. C. Coffey, B. W. Larson, A. W. Hains, J. B. Whitaker, N. Kopidakis, O. V. Boltalina, S. H. Strauss and G. Rumbles, J. Phys. Chem. C, 2012, 116, 8916–8923 CAS.
- M. C. Scharber, D. Mühlbacher, M. Koppe, P. Denk, C. Waldauf, A. J. Heeger and C. J. Brabec, Adv. Mater., 2006, 18, 789–794 CrossRef CAS.
- W. A. Braunecker, S. D. Oosterhout, Z. R. Owczarczyk, R. E. Larsen, B. W. Larson, D. S. Ginley, O. V. Boltalina, S. H. Strauss, N. Kopidakis and D. C. Olson, Macromolecules, 2013, 46, 3367–3375 CrossRef CAS.
- J.-L. Brédas, D. Beljonne, V. Coropceanu and J. Cornil, Chem. Rev., 2004, 104, 4971–5004 CrossRef PubMed.
- S.-W. Tsang, S. Chen and F. So, Adv. Mater., 2013, 25, 2434–2439 CrossRef CAS PubMed.
- Y. Zhang, J. Zou, C.-C. Cheuh, H.-L. Yip and A. K. Y. Jen, Macromolecules, 2012, 45, 5427–5435 CrossRef CAS.
- N. C. Cates, R. Gysel, Z. Beiley, C. E. Miller, M. F. Toney, M. Heeney, I. McCulloch and M. D. McGehee, Nano Lett., 2009, 9, 4153–4157 CrossRef CAS PubMed.
- I. Osaka, R. Zhang, G. Sauvé, D.-M. Smilgies, T. Kowalewski and R. D. McCullough, J. Am. Chem. Soc., 2009, 131, 2521–2529 CrossRef CAS PubMed.
- G. Ren, C. W. Schlenker, E. Ahmed, S. Subramaniyan, S. Olthof, A. Kahn, D. S. Ginger and S. A. Jenekhe, Adv. Funct. Mater., 2013, 23, 1238–1249 CrossRef CAS.
- P. Schilinsky, U. Asawapirom, U. Scherf, M. Biele and C. J. Brabec, Chem. Mater., 2005, 17, 2175–2180 CrossRef CAS.
- C.-W. Chu, V. Shrotriya, G. Li and Y. Yang, Appl. Phys. Lett., 2006, 88, 153504 CrossRef PubMed.
- J.-L. Brédas, J. E. Norton, J. Cornil and V. Coropceanu, Acc. Chem. Res., 2009, 42, 1691–1699 CrossRef PubMed.
- Z. R. Owczarczyk, W. A. Braunecker, S. D. Oosterhout, N. Kopidakis, R. E. Larsen, D. S. Ginley and D. C. Olson, Adv. Energy Mater., 2014, 4, 1301821 Search PubMed.
- B. Carsten, J. M. Szarko, H. J. Son, W. Wang, L. Lu, F. He, B. S. Rolczynski, S. J. Lou, L. X. Chen and L. Yu, J. Am. Chem. Soc., 2011, 133, 20468–20475 CrossRef CAS PubMed.
- Y. Zou, A. Najari, P. Berrouard, S. Beaupré, B. Réda Aïch, Y. Tao and M. Leclerc, J. Am. Chem. Soc., 2010, 132, 5330–5331 CrossRef CAS PubMed.
- Z.-L. Guan, J. B. Kim, H. Wang, C. Jaye, D. A. Fischer, Y.-L. Loo and A. Kahn, Org. Electron., 2010, 11, 1779–1785 CrossRef CAS PubMed.
- G. Zhang and C. B. Musgrave, J. Phys. Chem. A, 2007, 111, 1554–1561 CrossRef CAS PubMed.
- H. Ohkita, S. Cook, Y. Astuti, W. Duffy, S. Tierney, W. Zhang, M. Heeney, I. McCulloch, J. Nelson, D. D. C. Bradley and J. R. Durrant, J. Am. Chem. Soc., 2008, 130, 3030–3042 CrossRef CAS PubMed.
- T. M. Clarke and J. R. Durrant, Chem. Rev., 2010, 110, 6736–6767 CrossRef CAS PubMed.
- C. Hansch, A. Leo and R. W. Taft, Chem. Rev., 1991, 91, 165–195 CrossRef CAS.
- S. D. Dimitrov and J. R. Durrant, Chem. Mater., 2014, 26, 616–630 CrossRef CAS.
- P. I. Djurovich, E. I. Mayo, S. R. Forrest and M. E. Thompson, Org. Electron., 2009, 10, 515–520 CrossRef CAS PubMed.
- C. L. Chochos and S. A. Choulis, Prog. Polym. Sci., 2011, 36, 1326–1414 CrossRef CAS PubMed.
- E. T. Hoke, K. Vandewal, J. A. Bartelt, W. R. Mateker, J. D. Douglas, R. Noriega, K. R. Graham, J. M. J. Fréchet, A. Salleo and M. D. McGehee, Adv. Energy Mater., 2013, 3, 220–230 CrossRef CAS.
- C. Cabanetos, A. El Labban, J. A. Bartelt, J. D. Douglas, W. R. Mateker, J. M. J. Fréchet, M. D. McGehee and P. M. Beaujuge, J. Am. Chem. Soc., 2013, 135, 4656–4659 CrossRef CAS PubMed.
- L. J. A. Koster, S. E. Shaheen and J. C. Hummelen, Adv. Energy Mater., 2012, 2, 1246–1253 CrossRef CAS.
- A. J. Ferguson, N. Kopidakis, S. E. Shaheen and G. Rumbles, J. Phys. Chem. C, 2011, 115, 23134–23148 CAS.
- G. Dicker, M. de Haas, L. Siebbeles and J. Warman, Phys. Rev. B: Condens. Matter Mater. Phys., 2004, 70, 045203 CrossRef.
- A. M. Nardes, A. J. Ferguson, J. B. Whitaker, B. W. Larson, R. E. Larsen, K. Maturová, P. A. Graf, O. V. Boltalina, S. H. Strauss and N. Kopidakis, Adv. Funct. Mater., 2012, 22, 4115–4127 CrossRef CAS.
- W. A. Braunecker, Z. R. Owczarczyk, A. Garcia, N. Kopidakis, R. E. Larsen, S. R. Hammond, D. S. Ginley and D. C. Olson, Chem. Mater., 2012, 24, 1346–1356 CrossRef CAS.
- T. J. Savenije, A. J. Ferguson, N. Kopidakis and G. Rumbles, J. Phys. Chem. C, 2013, 117, 24085–24103 CAS.
- D. H. K. Murthy, M. Gao, M. J. W. Vermeulen, L. D. A. Siebbeles and T. J. Savenije, J. Phys. Chem. C, 2012, 116, 9214–9220 CAS.
- A. Saeki, S. Yoshikawa, M. Tsuji, Y. Koizumi, M. Ide, C. Vijayakumar and S. Seki, J. Am. Chem. Soc., 2012, 134, 19035–19042 CrossRef CAS PubMed.
- N. R. Armstrong, P. A. Veneman, E. Ratcliff, D. Placencia and M. Brumbach, Acc. Chem. Res., 2009, 42, 1748–1757 CrossRef CAS PubMed.
- G. Li, V. Shrotriya, J. Huang, Y. Yao, T. Moriarty, K. Emery and Y. Yang, Nat. Mater., 2005, 4, 864–868 CrossRef CAS.
- B. Liu, R.-Q. Png, L.-H. Zhao, L.-L. Chua, R. H. Friend and P. K. H. Ho, Nat. Commun., 2012, 3, 1321–1328 CrossRef PubMed.
- M. J. Frisch, G. W. Trucks, H. B. Schlegel, G. E. Scuseria, M. A. Robb, J. R. Cheeseman, G. Scalmani, V. Barone, B. Mennucci, G. A. Petersson, H. Nakatsuji, M. Caricato, X. Li, H. P. Hratchian, A. F. Izmaylov, J. Bloino, G. Zheng, J. L. Sonnenberg, M. Hada, M. Ehara, K. Toyota, R. Fukuda, J. Hasegawa, M. Ishida, T. Nakajima, Y. Honda, O. Kitao, H. Nakai, T. Vreven, J. A. Montgomery Jr, J. E. Peralta, F. Ogliaro, M. Bearpark, J. J. Heyd, E. Brothers, K. N. Kudin, V. N. Staroverov, T. Keith, R. Kobayashi, J. Normand, K. Raghavachari, A. Rendell, J. C. Burant, S. S. Iyengar, J. Tomasi, M. Cossi, N. Rega, J. M. Millam, M. Klene, J. E. Knox, J. B. Cross, V. Bakken, C. Adamo, J. Jaramillo, R. Gomperts, R. E. Stratmann, O. Yazyev, A. J. Austin, R. Cammi, C. Pomelli, J. W. Ochterski, R. L. Martin, K. Morokuma, V. Zakrzewski, G. A. Voth, P. Salvador, J. J. Dannenberg, S. Dapprich, A. D. Daniels, O. G. Farkas, J. B. Foresman, J. V. Ortiz, J. Cioslowski and D. J. Fox, Gaussian09, Revision B.01, Gaussian, Inc., Wallingford, CT, 2010 Search PubMed.
- R. E. Larsen, 2014, in preparation.
- J. E. Kroeze, T. J. Savenije, M. J. W. Vermeulen and J. M. Warman, J. Phys. Chem. B, 2003, 107, 7696–7705 CrossRef CAS.
- D. H. K. Murthy, A. Melianas, Z. Tang, G. Juska, K. Arlauskas, F. Zhang, L. D. A. Siebbeles, O. Inganäs and T. J. Savenije, Adv. Funct. Mater., 2013, 23, 4262–4268 CrossRef CAS.
- S. Dayal, N. Kopidakis and G. Rumbles, Faraday Discuss., 2012, 155, 323 RSC.
- V. Shrotriya, G. Li, Y. Yao, T. Moriarty, K. Emery and Y. Yang, Adv. Funct. Mater., 2006, 16, 2016–2023 CrossRef CAS.
- L. P. Khanh, P. Dallemagne and S. Rault, Synlett, 1999, 9, 1450–1452 CrossRef PubMed.
- Y. Ie, Y. Umemoto, M. Okabe, T. Kusunoki, K.-I. Nakayama, Y.-J. Pu, J. Kido, H. Tada and Y. Aso, Org. Lett., 2008, 10, 833–836 CrossRef CAS PubMed.
- Y. Liang, D. Feng, Y. Wu, S.-T. Tsai, G. Li, C. Ray and L. Yu, J. Am. Chem. Soc., 2009, 131, 7792–7799 CrossRef CAS PubMed.
- K. T. Nielsen, K. Bechgaard and F. C. Krebs, Macromolecules, 2005, 38, 658–659 CrossRef CAS.
- N. E. Jackson, B. M. Savoie, T. J. Marks, L. X. Chen and M. A. Ratner, J. Phys. Chem. Lett., 2015, 6, 77–84 CrossRef CAS.
- W. A. Braunecker, S. D. Oosterhout, Z. R. Owczarczyk, N. Kopidakis, E. L. Ratcliff, D. S. Ginley and D. C. Olson, ACS Macro Lett., 2014, 3, 622–627 CrossRef CAS.
Footnote |
| † Electronic supplementary information (ESI) available. See DOI: 10.1039/c5ta01153a |
| This journal is © The Royal Society of Chemistry 2015 |

