 Open Access Article
Creative Commons Attribution 3.0 Unported Licence
Polymer–polymer solar cells with a near-infrared spectral response†
Weiwei
Li
*ab,
Yang
An
b,
Martijn M.
Wienk
bc and
René A. J.
Janssen
*bc
aBeijing National Laboratory for Molecular Sciences, CAS Key Laboratory of Organic Solids, Institute of Chemistry, Chinese Academy of Sciences, Beijing 100190, P. R. China. E-mail: liweiwei@iccas.ac.cn
bMolecular Materials and Nanosystems, Eindhoven University of Technology, P. O. Box 513, 5600 MB Eindhoven, The Netherlands. E-mail: r.a.j.janssen@tue.nl
cDutch Institute for Fundamental Energy Research, De Zaale 20, 5612 AJ Eindhoven, The Netherlands
First published on 25th February 2015
Abstract
Four different thiazole-flanked diketopyrrolopyrrole-based polymers were applied as an electron acceptor in bulk heterojunction solar cells with poly(3-hexylthiophene) as an electron donor. Power conversion efficiencies of 1.5% to 3.0% were achieved with a spectral response from 350 to 950 nm.
Bulk heterojunction (BHJ) polymer solar cells (PSCs) based on a conjugated polymer as an electron donor and a fullerene derivative as an electron acceptor were first reported in 1995 (ref. 1) and have now achieved power conversion efficiencies (PCEs) above 10%.2 Also in 1995, solar cells in which conjugated polymers acted both as an electron donor and as an electron acceptor were demonstrated.3,4 The performance of these polymer–polymer blends still lags behind polymer–fullerene based solar cells.5 Before 2013, the PCEs of polymer–polymer solar cells were typically less than 3%, but their performance recently advanced to around 5%.6–8 The difficulty in creating the required micro-phase separation for efficient charge generation in polymer–polymer blends is one of the reasons for the moderate PCEs.9 In addition, only a limited number of electron acceptor polymers are known, certainly when compared to the vast number of conjugated donor polymers developed for polymer–fullerene cells. To exploit some of the intrinsic advantages of polymer acceptors, such as tunable energy levels and optical band gaps, high absorption coefficients, high charge carrier mobility and good morphological stability compared to fullerene-based materials, more research effort on polymer–polymer solar cells is required.
The push–pull design, in which electron rich units alternate with electron deficient units along the chain, has been very successful in constructing donor polymers10 and has also been applied in designing acceptor polymers. The most widely used electron deficient units for acceptor polymers are benzothiadiazole,11 perylenediimide,8,12,13 and naphthalenediimide.6,7,14–17 Units such as isoindigo18 and diketopyrrolopyrrole (DPP)19–21 have been used much less. Few acceptor polymers provide a photoresponse above 900 nm in PSCs,22 but extending the absorption of acceptor polymers to the near-infrared region, such as to 1000 nm, can increase the number of photons absorbed under solar radiation.
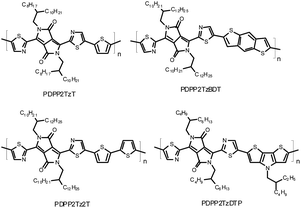
Strong electron withdrawing units, such as DPP, have been successfully applied in donor polymers with near-infrared absorption.23,24 DPP-based polymers also possess high electron mobilities in organic field-effect transistors (FETs),25 indicating their potential to be applied as the electron acceptor in organic solar cells. In a recent publication, we demonstrated that a polymer in which a DPP unit is flanked by two thiazole rings (PDPP2TzT, Fig. 1) can act as an acceptor polymer in solar cells.21 In FETs, PDPP2TzT possesses an electron mobility of μe = 0.13 cm2 V−1 s−1. Combined with a second DPP-polymer (PDPP5T) as an electron donor, a PCE of 2.9% was achieved.21 The modest PCE in this blend originates mainly from a low external quantum efficiency (EQE), which can be attributed to a suboptimal morphology and a photon energy loss, which is defined as the energy difference between the optical band gap (Eg) and the open-circuit voltage (Voc) (Eloss = Eg − qVoc), of 0.63 eV that is close to the minimal threshold of ∼0.6 eV for photoinduced generation of free charges.26 Initially PSCs based on poly(3-hexylthiophene) (P3HT) as a donor with PDPP2TzT as an acceptor exhibited low PCEs of 0.6% due to the large phase separation between P3HT and PDPP2TzT.21
We are interested in further exploring thiazole-flanked DPP-polymers as an electron acceptor with P3HT as an electron donor to enhance the PCE. Here we evaluate the photovoltaic performance of four homologous polymers in which the thiazole-flanked DPP unit alternates with thiophene (PDPP2TzT), benzodithiophene (PDPP2TzBDT), bithiophene (PDPP2Tz2T) or dithienopyrrole (PDPP2TzDTP) (Fig. 1) as an electron acceptor in solar cells with P3HT as an electron donor. The photovoltaic performance was found to be highly dependent on processing conditions, such as the nature of the co-solvent, thermal annealing and thickness of the photoactive layers. In optimized devices, PCEs of 1.5% to 3.0% were achieved with a spectral response up to 950 nm.
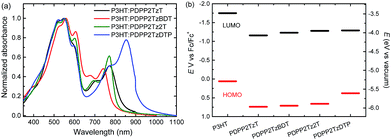
The synthesis, GPC data, and the optical and electrochemical properties of these four DPP-polymers have been reported elsewhere.21,27 The polymers have a high number average molecular weight (Mn = 74–109 kg mol−1, ESI† Table S1).21,27 The main optical absorption band extends from 600 nm to the near infrared, with onsets in the range of 800 to 950 nm (ESI† Fig. S1). The spectra are highly complementary to the absorption of P3HT which peaks at 550 nm and has an onset at 650 nm. Fig. 2a shows the absorption spectra for the four P3HT:DPP-polymer blends (2![[thin space (1/6-em)]](https://www.rsc.org/images/entities/char_2009.gif) :
:![[thin space (1/6-em)]](https://www.rsc.org/images/entities/char_2009.gif) 1 w/w). The shoulder at 600 nm is more pronounced than that of pure P3HT, suggesting a more planar structure of P3HT in blend films. The absorption intensity of the DPP-polymers is less than that of P3HT, reflecting the 2
1 w/w). The shoulder at 600 nm is more pronounced than that of pure P3HT, suggesting a more planar structure of P3HT in blend films. The absorption intensity of the DPP-polymers is less than that of P3HT, reflecting the 2![[thin space (1/6-em)]](https://www.rsc.org/images/entities/char_2009.gif) :
:![[thin space (1/6-em)]](https://www.rsc.org/images/entities/char_2009.gif) 1 weight. The HOMO and LUMO levels of P3HT determined by cyclic voltammetry are −5.29 and −3.48 eV, respectively. Under the same conditions, PDPP2TzT has the deepest HOMO and LUMO levels of −5.97 and −4.07 eV, while PDPP2TzDTP, with the stronger DTP donor unit, exhibited the highest HOMO and LUMO levels of −5.61 and −3.94 eV (Fig. 2b). These data reveal that the HOMO–HOMO and LUMO–LUMO offsets of P3HT with each of the DPP-polymers exceed 0.3 eV, which is considered as the threshold to ensure efficient exciton dissociation and charge generation in donor–acceptor blends.
1 weight. The HOMO and LUMO levels of P3HT determined by cyclic voltammetry are −5.29 and −3.48 eV, respectively. Under the same conditions, PDPP2TzT has the deepest HOMO and LUMO levels of −5.97 and −4.07 eV, while PDPP2TzDTP, with the stronger DTP donor unit, exhibited the highest HOMO and LUMO levels of −5.61 and −3.94 eV (Fig. 2b). These data reveal that the HOMO–HOMO and LUMO–LUMO offsets of P3HT with each of the DPP-polymers exceed 0.3 eV, which is considered as the threshold to ensure efficient exciton dissociation and charge generation in donor–acceptor blends.
 | ||
Fig. 2 (a) Absorption spectra of P3HT:DPP-polymer (2![[thin space (1/6-em)]](https://www.rsc.org/images/entities/char_2009.gif) : :![[thin space (1/6-em)]](https://www.rsc.org/images/entities/char_2009.gif) 1 w/w) blends in thin films. (b) Energy diagram of P3HT and DPP-based polymers. 1 w/w) blends in thin films. (b) Energy diagram of P3HT and DPP-based polymers. | ||
Polymer–polymer solar cells based on P3HT:DPP-polymer blends were fabricated in an inverted device configuration with an ITO/sol–gel ZnO electron collecting contact and a thermally evaporated MoO3/Ag electrode for hole collection. The photoactive layers were spin coated from chloroform solutions. Several parameters were carefully optimized. The use of a high boiling point co-solvent, such as 1,8-diiodooctane (DIO), 1-chloronaphthalene (1-CN) or ortho-dichlorobenzene (o-DCB), thermal annealing (TA) and the thickness of the active layer had great influence on device performance. Table 1 lists the influence of some of these parameters on the PCE for P3HT:PDPP2TzT blends. Active layers spin coated from chloroform with 5% DIO afford the highest PCE. When the active layer was spin coated from chloroform without an additive or with 1-CN or o-DCB, the PCE was significantly less. Thermal annealing has a strong effect on the device performance, especially for blends processed from chloroform with DIO.
![[thin space (1/6-em)]](https://www.rsc.org/images/entities/char_2009.gif) :
:![[thin space (1/6-em)]](https://www.rsc.org/images/entities/char_2009.gif) 1 w/w) photovoltaic cells
1 w/w) photovoltaic cells
| Co-solvent | TAa | J sc (mA cm−2) | V oc (V) | FF | PCEb (%) | R q (nm) |
|---|---|---|---|---|---|---|
| a At 150 °C for 10 min before metal evaporation. b J sc and PCE were calculated by integrating the EQE spectrum with the AM1.5 G spectrum. c Root mean square surface roughness. | ||||||
| No | No | 0.31 | 0.52 | 0.30 | 0.05 | — |
| No | Yes | 0.99 | 0.62 | 0.45 | 0.28 | 2.3 |
| 2.5% DIO | No | 0.36 | 0.59 | 0.35 | 0.08 | 7.2 |
| 2.5% DIO | Yes | 5.5 | 0.6 | 0.59 | 1.9 | 7.2 |
| 5% DIO | Yes | 6.5 | 0.66 | 0.61 | 2.6 | 3.2 |
| 10% DIO | Yes | 5.7 | 0.66 | 0.60 | 2.3 | 4.7 |
| 5% DIO + 10% o-DCB | Yes | 3.7 | 0.66 | 0.54 | 1.3 | 24.6 |
| 3% 1-CN | No | 0.83 | 0.64 | 0.47 | 0.25 | — |
| 3% 1-CN | Yes | 1.2 | 0.66 | 0.45 | 0.36 | 9.7 |
| 10% o-DCB | No | 0.72 | 0.66 | 0.55 | 0.26 | — |
| 10% o-DCB | Yes | 0.65 | 0.65 | 0.45 | 0.19 | 15.3 |
For the other three DPP-polymers, the best performance was achieved with 10% o-DCB as the co-solvent and thermal annealing (ESI† Table S2). The optimal thickness of active layers was found to be ≤115 nm. For thicker layers, the fill factor (FF) and short-circuit current (Jsc) dropped (ESI† Table S3), suggesting that charge transport is not optimal. The absorption spectra of the blends show small changes after thermal annealing (ESI† Fig. S2) and atomic force microscopy (AFM) reveals a similar surface morphology (ESI† Fig. S3).
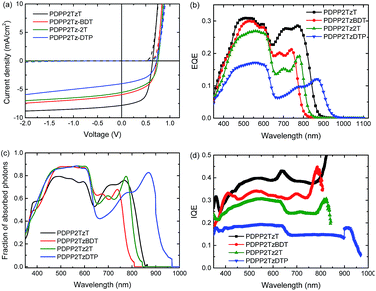
The solar cell parameters of the optimized device are summarized in Table 2. Fig. 3 shows the relevant characteristics. P3HT:PDPP2TzT cells exhibited the best PCE of 3%, with Voc = 0.64 V, FF = 0.61 and Jsc = 7.8 mA cm−2. The cells based on PDPP2TzBDT, PDPP2Tz2T and PDPP2TzDTP have a higher Voc up to 0.76 V, but relatively low FF and Jsc, so that PCEs based on these cells are 2.3%, 2.1% and 1.5%. The enhanced Voc can directly be correlated with the higher lying LUMO of these DPP-polymers compared to that of PDPP2TzT. The magnitude of the photocurrent is also reflected in the EQE as shown in Fig. 3b. All cells exhibit two distinct spectral contributions to the EQE spectra, one from P3HT up to 650 nm and another in the near-infrared from the DPP-polymers. The EQE extends up to ∼950 nm for P3HT:PDPP2TzDTP. The P3HT:PDPP2TzT cells have a maximum EQE of 0.3 originating from both P3HT and PDPP2TzT, which can explain the higher Jsc. For the other cells, the EQE drops and there is a concomitant reduction of Jsc.
| Acceptor | E g (eV) | Thickness (nm) | J sc (mA cm−2) | V oc (V) | FF | PCEa (%) | E loss (eV) |
|---|---|---|---|---|---|---|---|
a Best cells are shown, typical deviations are in the range of 5% for nominally identical devices.
b
J
sc and PCE were calculated by integrating the EQE spectrum with the AM1.5G spectrum. The optimized content ratio of P3HT:DPP-polymer is 2![[thin space (1/6-em)]](https://www.rsc.org/images/entities/char_2009.gif) : :![[thin space (1/6-em)]](https://www.rsc.org/images/entities/char_2009.gif) 1. The active layers were thermally annealed at 150 °C before metal evaporation. 1. The active layers were thermally annealed at 150 °C before metal evaporation.
|
|||||||
| PDPP2TzT | 1.44 | 115 | 7.8 | 0.64 | 0.61 | 3 | 0.80 |
| PDPP2TzBDT | 1.53 | 80 | 5.9 | 0.73 | 0.54 | 2.3 | 0.80 |
| PDPP2Tz2T | 1.47 | 70 | 5.5 | 0.76 | 0.50 | 2.1 | 0.71 |
| PDPP2TzDTP | 1.28 | 70 | 4 | 0.72 | 0.51 | 1.5 | 0.56 |
Internal quantum efficiencies (IQEs) of the cells were determined by dividing the EQE by the fraction of photons absorbed as determined from optical modelling of the device stack using the wavelength dependent refractive index (n) and extinction coefficients (k) of all layers involved (ESI† Fig. S4). With the optimized thickness, these blends absorb more than 70% of the light at their absorption peaks (Fig. 3c). All cells show relatively flat IQE spectra in their absorption region. This indicates that photons absorbed by either the P3HT donor or the DPP-polymer acceptor can be converted into collectable charges with similar efficiencies.
The possible causes for the different Jscs and PCEs in these P3HT:DPP-polymer solar cells are worth discussing. Going from PDPP2TzT to PDPP2TzDTP, the HOMO and LUMO of DPP-polymers are increased, which reduce the driving force for charge dissociation with P3HT. This is also reflected in Eloss which decreases from 0.80 eV for PDPP2TzT and PDPP2TzBDT, via 0.71 eV for PDPP2Tz2T, to 0.56 eV PDPP2TzDTP (Table 2). For the latter, Eloss is below the 0.6 eV threshold26 and as a consequence the IQE drops significantly.
The second effect is the phase separation. We investigated the differently processed P3HT:PDPP2TzT blends, as shown in Table 1, by AFM (ESI† Fig. S5). Smooth films are formed when the films are spin coated from chloroform only (root mean square surface roughness, Rq, is 2.3 nm). Adding DIO increases the surface roughness (Rq = 3.2 to 7.2 nm) and the PCE. We interpret this as being caused by the increased phase separation, induced by the aggregation of polymers during spin coating.28 When using o-DCB or 1-CN as co-solvents, the surface becomes more strongly corrugated (Rq = 9.7 to 24.6 nm) and the PCE drops to negligible values. This suggests that o-DCB and 1-CN cause the formation of large polymer aggregates during drying which result in a too coarse morphology.
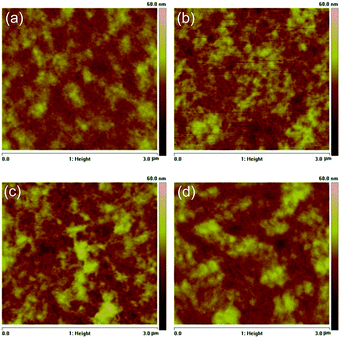
The AFM height images of the optimized blends for P3HT:PDPP2TzT and the three other optimized P3HT:DPP-polymer blends are shown in Fig. 4. The differences are generally small and Rq is in a narrow range of 3.2 to 4.8 nm. Rq is less for the most efficient blend (3.18 nm) than for the other three blends (4.33 to 4.78 nm), suggesting a larger micro-phase separation in the latter blends and a corresponding decrease in the IQE.
The fact that thermal annealing has a strong positive effect on the PCE indicates that also crystallization of the polymers enhances the performance. As discussed above, annealing does not affect the Rq (ESI† Fig. S3). The positive effect of forming semi-crystalline domains for both donor and acceptor on the PCE is well established for P3HT:fullerene blends29 and seems to apply here too. The fact that the final IQEs remain moderate and do not exceed 0.4 (Fig. 3d), even when Eloss > 0.6 eV, is most likely related to the fact that the morphology is still not optimal in terms of having the right balance between pure crystalline domains and amorphous mixed regions.30
Conclusions
Four homologous, near-infrared absorbing thiazole-flanked DPP-polymers were studied as an electron acceptor in polymer–polymer bulk heterojunction solar cells with P3HT as an electron donor. P3HT and the DPP-polymers contribute to the photocurrent generation, indicating that photons absorbed by the donor and by the acceptor can be effectively converted into free charges. The PCEs range from 1.5% to 3% and the solar cells exhibit a broad spectral response from 350 up to 950 nm.Acknowledgements
This work was performed in the framework of the Largecells project that received funding from the European Commission's Seventh Framework Programme (Grant Agreement no. 261936). The research forms part of the Solliance OPV program and has received funding from the Ministry of Education, Culture and Science (Gravity program 024.001.035).Notes and references
- G. Yu, J. Gao, J. C. Hummelen, F. Wudl and A. J. Heeger, Science, 1995, 270, 1789–1791 CAS.
- Y. Liu, J. Zhao, Z. Li, C. Mu, W. Ma, H. Hu, K. Jiang, H. Lin, H. Ade and H. Yan, Nat. Commun., 2014, 5, 5293 CrossRef CAS PubMed.
- J. J. M. Halls, C. A. Walsh, N. C. Greenham, E. A. Marseglia, R. H. Friend, S. C. Moratti and A. B. Holmes, Nature, 1995, 376, 498–500 CrossRef CAS.
- G. Yu and A. J. Heeger, J. Appl. Phys., 1995, 78, 4510–4515 CrossRef CAS PubMed.
- A. Facchetti, Mater. Today, 2013, 16, 123–132 CrossRef CAS PubMed.
- D. Mori, H. Benten, I. Okada, H. Ohkita and S. Ito, Energy Environ. Sci., 2014, 7, 2939–2943 CAS.
- T. Earmme, Y.-J. Hwang, S. Subramaniyan and S. A. Jenekhe, Adv. Mater., 2014, 26, 6080–6085 CrossRef CAS PubMed.
- Y. Zhou, T. Kurosawa, W. Ma, Y. Guo, L. Fang, K. Vandewal, Y. Diao, C. Wang, Q. Yan, J. Reinspach, J. Mei, A. L. Appleton, G. I. Koleilat, Y. Gao, S. C. B. Mannsfeld, A. Salleo, H. Ade, D. Zhao and Z. Bao, Adv. Mater., 2014, 26, 3767–3772 CrossRef CAS PubMed.
- K. D. Deshmukh, T. Qin, J. K. Gallaher, A. C. Y. Liu, E. Gann, K. O'Donnell, L. Thomsen, J. M. Hodgkiss, S. E. Watkins and C. R. McNeill, Energy Environ. Sci., 2015, 8, 332–342 CAS.
- L. Dou, J. You, Z. Hong, Z. Xu, G. Li, R. A. Street and Y. Yang, Adv. Mater., 2013, 25, 6642–6671 CrossRef CAS PubMed.
- D. Mori, H. Benten, H. Ohkita, S. Ito and K. Miyake, ACS Appl. Mater. Interfaces, 2012, 4, 3325–3329 CAS.
- X. Zhan, Z. a. Tan, B. Domercq, Z. An, X. Zhang, S. Barlow, Y. Li, D. Zhu, B. Kippelen and S. R. Marder, J. Am. Chem. Soc., 2007, 129, 7246–7247 CrossRef CAS PubMed.
- E. Zhou, J. Cong, Q. Wei, K. Tajima, C. Yang and K. Hashimoto, Angew. Chem., Int. Ed., 2011, 50, 2799–2803 CrossRef CAS PubMed.
- X. Guo, A. Facchetti and T. J. Marks, Chem. Rev., 2014, 114, 8943–9021 CrossRef CAS PubMed.
- E. Zhou, J. Cong, K. Hashimoto and K. Tajima, Adv. Mater., 2013, 25, 6991–6996 CrossRef CAS PubMed.
- D. Mori, H. Benten, I. Okada, H. Ohkita and S. Ito, Adv. Energy Mater., 2014, 4(4), 1301006 Search PubMed.
- T. Earmme, Y.-J. Hwang, N. M. Murari, S. Subramaniyan and S. A. Jenekhe, J. Am. Chem. Soc., 2013, 135, 14960–14963 CrossRef CAS PubMed.
- R. Stalder, J. Mei, J. Subbiah, C. Grand, L. A. Estrada, F. So and J. R. Reynolds, Macromolecules, 2011, 44, 6303–6310 CrossRef CAS.
- W. Li, T. Lee, S. J. Oh and C. R. Kagan, ACS Appl. Mater. Interfaces, 2011, 3, 3874–3883 CAS.
- M.-F. Falzon, A. P. Zoombelt, M. M. Wienk and R. A. J. Janssen, Phys. Chem. Chem. Phys., 2011, 13, 8931–8939 RSC.
- W. Li, W. S. C. Roelofs, M. Turbiez, M. M. Wienk and R. A. J. Janssen, Adv. Mater., 2014, 26, 3304–3309 CrossRef CAS PubMed.
- E. Zhou, M. Nakano, S. Izawa, J. Cong, I. Osaka, K. Takimiya and K. Tajima, ACS Macro Lett., 2014, 3, 872–875 CrossRef CAS.
- K. H. Hendriks, G. H. L. Heintges, V. S. Gevaerts, M. M. Wienk and R. A. J. Janssen, Angew. Chem., Int. Ed., 2013, 52, 8341–8344 CrossRef CAS PubMed.
- R. S. Ashraf, I. Meager, M. Nikolka, M. Kirkus, M. Planells, B. C. Schroeder, S. Holliday, M. Hurhangee, C. B. Nielsen, H. Sirringhaus and I. McCulloch, J. Am. Chem. Soc., 2015, 137, 1314–1321 CrossRef CAS PubMed.
- C. B. Nielsen, M. Turbiez and I. McCulloch, Adv. Mater., 2013, 25, 1859–1880 CrossRef CAS PubMed.
- D. Veldman, S. C. J. Meskers and R. A. J. Janssen, Adv. Funct. Mater., 2009, 19, 1939–1948 CrossRef CAS.
- W. Li, K. H. Hendriks, A. Furlan, M. M. Wienk and R. A. J. Janssen, J. Am. Chem. Soc., 2015, 137, 2231–2234 CrossRef CAS PubMed.
- J. J. van Franeker, M. Turbiez, W. Li, M. M. Wienk and R. A. J. Janssen, Nat. Commun., 2015, 6, 6229 CrossRef PubMed.
- X. Yang, S. C. Veenstra, W. J. H. Verhees, M. M. Wienk, R. A. J. Janssen, J. M. Kroon, M. A. J. Michels and J. Loos, Nano Lett., 2005, 5, 579–583 CrossRef CAS PubMed.
- N. D. Treat and M. Chabinyc, Annu. Rev. Phys. Chem., 2014, 65, 59–81 CrossRef CAS PubMed.
Footnote |
| † Electronic supplementary information (ESI) available: Experimental procedures, additional figures and tables. See DOI: 10.1039/c5ta01042j |
| This journal is © The Royal Society of Chemistry 2015 |


