
 Open Access Article
 This Open Access Article is licensed under a
 Creative Commons Attribution 3.0 Unported Licence
High open-circuit voltage small-molecule p-DTS(FBTTh2)2:ICBA bulk heterojunction solar cells – morphology, excited-state dynamics, and photovoltaic performance†
Aung Ko
Ko Kyaw‡
a,
Dominik
Gehrig‡
b,
Jie
Zhang
a,
Ye
Huang
c,
Guillermo C.
Bazan
c,
Frédéric
Laquai
*b and
Thuc-Quyen
Nguyen
*c
aInstitute of Materials Research and Engineering (IMRE), Agency for Science Technology and Research (A*STAR), Singapore 117602, Republic of Singapore
bMax Planck Research Group for Organic Optoelectronics, Max Planck Institute for Polymer Research, Ackermannweg 10, D-55128 Mainz, Germany. E-mail: laquai@mpip-mainz.mpg.de
cCenter for Polymers and Organic Solids, Department of Chemistry and Biochemistry, University of California at Santa Barbara, Santa Barbara, California 93106-5090, USA. E-mail: quyen@chem.ucsb.edu
First published on 27th November 2014
Abstract
The photovoltaic performance of bulk heterojunction solar cells using the solution-processable small molecule donor 7,7′-(4,4-bis(2-ethylhexyl)-4H-silolo[3,2-b:4,5-b′]dithiophene-2,6-diyl)bis(6-fluoro-4-(5′-hexyl-[2,2′-bithiophene]-5-yl)benzo[c][1,2,5]thiadiazole) (p-DTS(FBTTh2)2 in combination with indene-C60 bis-adduct (ICBA) as an acceptor is systematically optimized by altering the processing conditions. A high open-circuit voltage of 1 V, more than 0.2 V higher than that of a p-DTS(FBTTh2)2:PC70BM blend, is achieved. However, the power conversion efficiency remains around 5% and thus is lower than ∼8% previously reported for p-DTS(FBTTh2)2:PC70BM. Transient absorption (TA) pump–probe spectroscopy over a wide spectral (Vis-NIR) and dynamic (fs to μs) range in combination with multivariate curve resolution analysis of the TA data reveals that generation of free charges is more efficient in the blend with PC70BM as an acceptor. In contrast, blends with ICBA create more coulombically bound interfacial charge transfer (CT) states, which recombine on the sub-nanosecond timescale by geminate recombination. Furthermore, the ns to μs charge carrier dynamics in p-DTS(FBTTh2)2:ICBA blends are only weakly intensity dependent implying a significant contribution of recombination from long-lived CT states and trapped charges, while those in p-DTS(FBTTh2)2:PC70BM decay via an intensity-dependent recombination mechanism indicating that spatially separated (free) charge carriers are observed, which can be extracted as photocurrent from the device.
1. Introduction
The open-circuit voltage (VOC) is one of the figures of merit determining the power conversion efficiency (PCE) of solar cells. It is also a critical parameter in electrochemical reactions such as photocatalytic splitting of water into hydrogen and oxygen using solar fuels.1–4 What exactly determines the VOC is still intensely investigated. In fact several factors influencing the VOC of a bulk-heterojunction (BHJ) solar cell have already been suggested, for instance the work-function difference of the device electrodes according to the metal–insulator–metal model,5–7 Fermi level pinning between the metal electrode and the fullerene reduction potential,8 the surface dipoles at the interfaces,9,10 the formation of ground-state charge-transfer complexes between the acceptor and donor material,11 and shunts in the photoactive layer causing leakage currents.12 However, it appears that the VOC mainly depends on the energy offset between the highest occupied molecular orbital (HOMO) of the donor and the lowest unoccupied molecular orbital (LUMO) of the acceptor.8,13Based on this rather simple and empiric design rule, donor materials with deep HOMO levels have been designed to increase the VOC of BHJ organic solar cells. The VOC of the heavily researched poly(3-hexylthiophene):phenyl-C61-butyric acid methyl ester blend (P3HT:PC60BM) is only 0.6 V (in fact it varies between 0.58 V and 0.67 V depending on the film processing conditions and interfacial layer structure)14,15 as P3HT has a rather high HOMO level of −5.2 eV, whereas conjugated polymers with lower HOMO levels such as poly(N-9′′-hepta-decanyl-2,7-carbazole-alt-5,5-(4′,7′-di-2-thienyl-2′,1′,3′-benzothiadiazole)) (PCDTBT) and poly[2,3-bis-(3-octyloxyphenyl)quinoxaline-5,8-diyl-alt-thiophene-2,5-diyl] (PTQ1) (HOMO levels of −5.5 eV and −5.7 eV, respectively) show significantly higher VOCs of ∼0.88 V and 0.89 V, respectively.16,17 Furthermore, fullerene bis-adduct acceptors have been used to increase the VOC, because of their higher LUMO level compared to the ubiquitously used PC60BM. For instance, replacing PC60BM with indene-C60 bis-adduct (ICBA) (LUMO levels around −3.74 eV vs. −3.91 eV for PC60BM) significantly increases the VOC of a P3HT-based solar cell from 0.58 V to 0.84 V.18–21 However, there are limitations in the tunability of energy levels of materials. Firstly, lowering the HOMO level of the donor without changing its LUMO level increases the optical bandgap of the donor and hence blue-shifts the absorption spectrum of the photoactive layer thereby reducing the spectral overlap with the solar radiation. Secondly, if the LUMO level of the donor is lowered concomitantly to maintain the bandgap, then the effective energy offset between the LUMO levels of the donor and acceptor decreases and the probability of exciton dissociation into free charges can be reduced.22 Similarly, lifting the LUMO level of the acceptor to increase VOC also decreases the energy offset and can reduce the yield of free charges. However, the minimum energy offset required to overcome the exciton binding energy for efficient charge separation is still controversially debated and is a subject of recent studies and reports vary from 0.1 eV to 0.5 eV depending on the donor properties.23,24 Furthermore, the reduction of the energy offset leads to the condition, in which the energy level of the triplet state is lower than that of the interfacial charge transfer state, resulting in relaxation of the charge transfer state to the triplet state.25 Thus, while the VOC of some BHJ systems has reached values higher than 1 V, the fill factor (FF) and PCE often remained low.26,27 In fact, a BHJ system with decent efficiency (PCE > 5%) and VOC approaching 1 V is a very rare case.28
Recently, we reported a BHJ solar cell with a PCE of ∼8% and a VOC of ∼0.78 V using a small molecule (SM) donor, namely 7,7′-(4,4-bis(2-ethylhexyl)-4H-silolo[3,2-b:4,5-b′]dithiophene-2,6-diyl)bis(6-fluoro-4-(5′-hexyl-[2,2′-bithiophene]-5-yl)benzo[c][1,2,5]thiadiazole) (p-DTS(FBTTh2)2), and phenyl-C71-butyric acid methyl ester (PC70BM) as an acceptor.29 The energy offset between the LUMO levels of p-DTS(FBTTh2)2 and PC70BM, however, is very large (∼1 eV), as illustrated in Fig. 1. Thus, a significant fraction of the photon energy is lost in the charge transfer process. However, there is huge potential to improve the VOC by reducing the energy offset between the LUMO levels of the donor and acceptor in this BHJ system. Hence, in the present study we investigate the photovoltaic performance of blends of p-DTS(FBTTh2)2 and ICBA, as the ICBA has a higher LUMO level than the PC70BM previously used. We demonstrate a high VOC (∼1 V) with a PCE of ∼5% using the p-DTS(FBTTh2)2:ICBA system. Despite a more than 200 mV improvement in VOC, the PCE of the p-DTS(FBTTh2)2:ICBA system is lower than that of our previously reported p-DTS(FBTTh2)2:PC70BM system mainly due to a low FF. Transient absorption spectroscopy covering a wide wavelength region (that is from the visible to the near-infrared) and spanning a wide dynamic range (from 100 fs to several μs) reveals that the formation of weakly bound charge transfer (CT) states in the p-DTS(FBTTh2)2:ICBA system, and their subsequent recombination, plus trap-assisted recombination of free charges are the main reasons for the low FF.
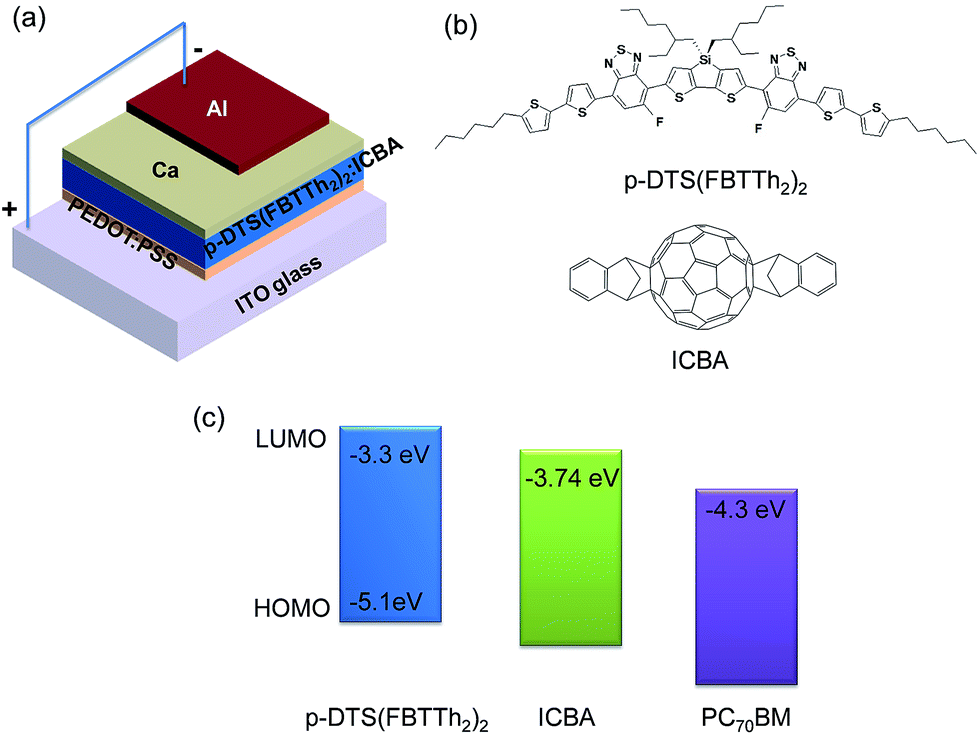 | ||
| Fig. 1 Device structure of an organic solar cell with p-DTS(FBTTh2)2:ICBA blend used in this study (a). Molecular structure (b) and energy level (c) of p-DTS(FBTTh2)2 and ICBA, respectively. LUMO level of PC70BM is shown in (c) for comparison with ICBA. | ||
2. Results and discussion
2.1. Photovoltaic performance of p-DTS(FBTTh2)2:ICBA blends
In this section, we present the photovoltaic performance of p-DTS(FBTTh2)2:ICBA blends prepared under various processing conditions. The use of solvent additives is an effective and common method to influence the nanomorphology of the BHJ. To examine the effect of solvent additives on the morphology and efficiency of p-DTS(FBTTh2)2:ICBA blends, we spin-cast films from solutions containing 0% to 0.6% (v/v%) 1,8-diiodooctane (DIO) and compared the photovoltaic performance of the devices. The photovoltaic parameters of the p-DTS(FBTTh2)2:ICBA solar cells processed with various contents of DIO are listed in Table 1 and their J–V characteristics under AM 1.5G irradiation at 100 mW cm−2 are shown in Fig. S1, ESI.† The results demonstrate that the device processed without any additive exhibits a PCE of only 3.01% with a short-circuit current density (JSC) of 7.42 mA cm−2, a VOC of 1.017 V and a FF of 39.9%. The device processed with 0.4% DIO shows the best performance with JSC = 9.71 mA cm−2, VOC = 0.963 V, FF = 46.1%, and PCE = 4.31%. The VOC has increased to ∼1 V as expected, which represents a 25% increase compared to that of the p-DTS(FBTTh2)2:PC70BM blend (∼0.8 V).29,30![[thin space (1/6-em)]](https://www.rsc.org/images/entities/char_2009.gif) :A weight ratio is 1.5:1 and the total concentration in solution is 35 mg mL−1 unless otherwise stated
:A weight ratio is 1.5:1 and the total concentration in solution is 35 mg mL−1 unless otherwise stated
| DIO content | J SC [mA cm−2] | V OC [V] | FF [%] | PCE [%] |
|---|---|---|---|---|
| 0% | 7.42 | 1.017 | 39.9 | 3.01 |
| 0.2% | 8.29 | 1.012 | 42.6 | 3.58 |
| 0.4% | 9.71 | 0.963 | 46.1 | 4.31 |
| 0.6% | 8.69 | 0.956 | 42.8 | 3.56 |
When the 0.4% DIO BHJ film was annealed at 120 °C, the PCE increased to 5.07% with JSC = 10.45 mA cm−2, VOC = 0.962 V and FF = 50.4%. In contrast to other BHJ systems,31–34 one observes that the figures of merit of the p-DTS(FBTTh2)2:ICBA system are not strongly dependent on the annealing temperature. The PCE remains almost unchanged in the annealing temperature range from 100 °C to 130 °C (Table 2).
:acceptor weight ratios. The values shown in the table are average results from five devices
| D:A ratio |
Additive | Annealing temperature | J SC [mA cm−2] | V OC [V] | FF [%] | PCE [%] | J SC (calc.) [mA cm−2] | Error [%] |
|---|---|---|---|---|---|---|---|---|
| 1.5:1 |
0.4% DIO | 100 °C | 10.30 | 0.964 | 49.9 | 4.95 | ||
| 110 °C | 10.35 | 0.962 | 49.7 | 4.95 | ||||
| 120 °C | 10.45 | 0.962 | 50.4 | 5.07 | 10.34 | 1.05 | ||
| 130 °C | 10.71 | 0.962 | 47.8 | 4.92 | ||||
| 1.5:1 |
Nil | 100 °C | 9.99 | 1.000 | 49.5 | 4.95 | 9.97 | 0.2 |
| 110 °C | 9.86 | 1.013 | 48.4 | 4.83 | ||||
| 120 °C | 9.83 | 1.000 | 48.6 | 4.78 | ||||
| 2.3:1 |
Nil | 100 °C | 10.02 | 1.017 | 48.5 | 4.94 | 9.99 | 0.3 |
| 110 °C | 10.14 | 1.000 | 47.8 | 4.84 |
While the device processed without DIO exhibits a low PCE (3.01%), its PCE significantly increased to 4.95% with JSC = 9.99 mA cm−2, VOC = 1.0 V and FF = 49.5% after annealing at 100 °C (Table 2). Hence, the PCE of this device (that is without DIO, but with annealing) becomes similar to that of the device prepared with 0.4% DIO and annealing, suggesting that the impact of annealing supersedes the effect of additive in this system. We also investigated the thermal stability of the devices processed without DIO. The PCE changed from 4.95% to 4.78% by varying the temperature from 100 °C to 120 °C. More interestingly, the p-DTS(FBTTh2)2:ICBA system is also less susceptible to a variation in the donor:acceptor (D:A) ratio. We varied the D:A ratio from 1.5:1 to 2.3:1 resulting in a virtually constant PCE of 4.95% and 4.94%, respectively, as shown in Table 2. Based on the photovoltaic performance, we conclude that the p-DTS(FBTTh2)2:ICBA system is less sensitive to the processing conditions compared to other BHJ systems.
The J–V characteristics under AM 1.5G irradiation at 100 mW cm−2 and the corresponding external quantum efficiency (EQE) spectra of the champion devices fabricated under different processing conditions are shown in Fig. 2. The calculated JSC obtained by integrating the EQE data convoluted with the AM 1.5G solar spectrum deviates only by 1.5% from the experimentally determined value. The maximum EQE of ∼60% is obtained between 570 nm and 700 nm. A decrease in EQE at 550 nm and below can be assigned to the poor absorption of C60-based fullerene in the visible region compared to C70-based fullerenes. The J–V characteristics of the other devices are displayed in Fig. S2–S4, ESI.†
 | ||
| Fig. 2 (a) J–V characteristics under AM 1.5G irradiation at 100 mW cm−2 and (b) EQE spectra of the champion cells fabricated under different processing conditions: (i) D:A = 1.5:1, 0.4% DIO and annealed at 120 °C (black square), (ii) D:A = 1.5:1, 0% DIO and annealed at 100 °C (red circle) and (iii) D:A = 2.3:1, 0% DIO and annealed at 100 °C (blue triangle). | ||
2.2. Morphological characterization of BHJ films
The interpenetration of the acceptor and donor is an important factor in determining the efficiency of a BHJ solar cell. Thus, the nanomorphology of the p-DTS(FBTTh2)2:ICBA BHJ obtained under different processing conditions was studied by tapping mode Atomic Force Microscopy (AFM). Fig. 3 presents the AFM topographic and phase images of as-cast films and films processed with DIO and/or annealing. The topographic and phase images of as-cast films are featureless with a surface roughness of only ∼1 nm (Fig. 3a and d). No obvious sign of phase separation can be identified implying intimate donor and acceptor mixing. The use of DIO and/or thermal annealing resulted in significant changes of the surface topography. Overall, the films processed with DIO and/or annealing reveal rather fine and evenly distributed domains of a size of tens of nanometers in conjunction with continuous interpenetrating networks without any large-scale aggregation of either the donor or the acceptor with a slight increase in the surface roughness (∼1.4 nm, Fig. 3b and c). From the phase images (Fig. 3e and f), one observes fiber-like network formation for films processed with DIO and/or thermally annealed films. It is widely accepted that the phase separation must be sufficiently large to create percolation pathways for charge carrier transport, yet small enough to form a large interfacial area for efficient exciton dissociation and charge separation (typically on the order of tens of nanometers). It is likely that the formation of interpenetrating networks of acceptor and donor compounds without large-scale aggregation by the use of DIO and/or annealing fulfils the above conditions, and hence leads to an improved JSC, FF, and PCE. | ||
| Fig. 3 Taping mode AFM topography (top) and phase (bottom) images of p-DTS(FBTTh2)2:ICBA films fabricated under different processing conditions: as-cast (a & d), 0.4% DIO and annealed at 120 °C (b & f), and 0% DIO and annealed at 100 °C (c & g). D:A ratio is 1.5:1 for all films. The scan size is 2 μm × 2 μm. | ||
Since AFM reveals information limited to the surface of the film only, we also probed the morphology of the bulk film by grazing incidence wide angle X-ray scattering (GIWAXS). Fig. 4 presents 2D GIWAXS patterns of as-cast films and films processed with DIO and/or annealing atop of PEDOT:PSS-coated substrates. As shown in Fig. 4, 2D GIWAXS patterns of as-cast films as well as films processed with DIO and/or annealing exhibit a (100) peak as well as higher order scattering peaks ((200) and (300)) along the qz (normal to the substrate) axis due to a lamella-like layered structure, and the (010) peak along the qxy (parallel to the substrate) axis due to π–π interchain stacking. This implies that p-DTS(FBTTh2)2:ICBA BHJ films have highly ordered edge-on orientation with side chains sitting perpendicular to the substrate and the π-stacking direction is parallel to the substrate, even for the as-cast conditions. The (100) peak at qz = 0.288 Å−1 and (010) peak at qxy = 1.744 Å−1 correspond to the alkyl stacking distance of 21.8 Å and π–π stacking distance of 3.6 Å, respectively (note: the intense peak at qxy ∼ 2.16 Å−1 is caused by scattering from the underlying PEDOT:PSS layer). However, the films processed with DIO and/or annealing have a higher scattering intensity, especially the higher order scattering peaks (200) and (300), associated with both lamella-like layers and π–π stacking, respectively than as-cast films, suggesting that the crystallinity of the film is further improved by using the co-solvent DIO and/or annealing. The crystal correlation length (CCL) which is the estimated crystal size of the films processed with DIO and/or annealing, calculated from the peak width, is ∼17 nm, which is in good agreement with the AFM images.
 | ||
| Fig. 4 2D GIWAXS patterns of p-DTS(FBTTh2)2:ICBA films fabricated on the PEDOT:PSS coated substrate under different processing conditions: as-cast (a), 0.4% DIO and annealed at 120 °C (b), 0% DIO and annealed at 100 °C (c). The 2D GIWAXS patterns of the PEDOT:PSS film is shown in (d). | ||
2.3. Comparison with PC70BM-based blends
The p-DTS(FBTTh2)2:ICBA system exhibits a PCE of ∼5% with a high VOC of ∼1 V under optimized conditions. Compared to our previously reported p-DTS(FBTTh2)2:PC70BM system, which showed a PCE of ∼8% with JSC = 14.2 mA cm−2, VOC = 0.775 V and FF = 72.8%, the PCE of p-DTS(FBTTh2)2:ICBA is still lower even under optimized preparation conditions, despite the more than 0.2 V increase in VOC. The decrease in PCE originates from a low JSC (∼10 mA cm−2) as well as moderate FF (∼50%). It is straightforward to understand that a lower absorption of the p-DTS(FBTTh2)2:ICBA photoactive layer compared to that of p-DTS(FBTTh2)2:PC70BM, due to the lack of the absorption of ICBA in the visible region, causes a decrease in JSC (Fig. S5 and S6, ESI†). However, the origin of the lower FF is not so clear. The dark J–V curve of a p-DTS(FBTTh2)2:ICBA device exhibited a high rectification ratio and low leakage current in turn ensuring that there is a high quality interface between the BHJ photoactive layer and the electrodes and that the low FF is not due to the interfacial layers (Fig. S7, ESI†). Thus, to gain insight into the origin of the low FF in the p-DTS(FBTTh2)2:ICBA system, we studied the excited states dynamics and related charge carrier recombination mechanisms of these two systems by ultrafast and ns to μs transient absorption spectroscopy.2.4. Charge generation in p-DTS(FBTTh2)2:ICBA and p-DTS(FBTTh2)2:PC70BM
All samples were excited at 700 nm, that is into the absorption band of the p-DTS(FBTTh2)2 donor molecules. The TA spectra of both blends are compared in Fig. 5. All TA spectra exhibit a ground-state bleach present immediately after excitation. In addition to the ground-state bleach, both films show a negative feature peaking at 1250 nm at early delay times, which we assigned to exciton-induced absorption of the singlet excited-state of p-DTS(FBTTh2)2. This assignment is further confirmed by TA measurements on a neat p-DTS(FBTTh2)2 film (Fig. S8, ESI†). In both films, a photoinduced absorption at shorter wavelengths, precisely between 900 and 1100 nm, appears on a timescale of tens to hundreds of picoseconds, which we assigned to the charge carrier-induced absorption of p-DTS(FBTTh2)2 molecules (see Fig. 5). | ||
| Fig. 5 Spectra of (a) p-DTS(FBTTh2)2:ICBA and (b) p-DTS(FBTTh2)2:PC70BM after excitation at 700 nm with 8.1/2.4 μJ cm−2 (a) and 4.1/2.3 μJ cm−2 (b), respectively. | ||
A noteworthy difference between the two investigated blends is the occurrence of a peak at 720 nm. This is attributed to electro-absorption (EA) as reported and discussed recently by Friend and co-workers.35 They demonstrated that a large EA signal is caused by long-range charge separation across the donor–acceptor interface and is therefore an indication of the formation of free charge carriers. Clearly, this feature is less pronounced in p-DTS(FBTTh2)2:ICBA blends compared to p-DTS(FBTTh2)2:PC70BM blends. Thus, it appears that blends containing PC70BM exhibit more efficient generation of spatially separated (free) charges compared to ICBA blends. We analyzed the TA data by means of multivariate curve resolution (MCR) analysis as recently reviewed by us36 and also applied to other donor:acceptor systems.37 The transition of the initial excitonic state (component 1) to the charge-separated state (component 2) can be clearly seen as shown in Fig. 6. Fitting the concentration profiles obtained by MCR analysis showed an inverse rate constant between 10 and 40 ps, depending on the excitation intensity used.
 | ||
| Fig. 6 (a) Spectra and (b) concentration profiles according to MCR-ALS analysis of p-DTS(FBTTh2)2:PC70BM. | ||
This is consistent with TA measurements in the near-infrared (NIR) spectral region on the ps to ns timescale, where the ICBA sample showed a fast and intensity-independent decay in the spectral region around 1050 nm, which is related to charge-induced absorption as shown in the upper panel of Fig. 7. A straightforward explanation for this observation is the geminate recombination of tightly bound CT states at the interface, which did not manage to split into free charge carriers. In contrast, the PC70BM sample showed a rather constant TA signal at low excitation intensities. This is further supported by MCR analysis of the NIR TA data, which is presented in Fig. S9, ESI.† Component 1 is assigned to singlet exciton-induced absorption in agreement with measurements on the pristine donor material (see Fig. S8, ESI†). Component 2 is assigned to charge-induced absorption according to spectra obtained from a chemically oxidized p-DTS(FBTTh2)2 film (see Fig. S10, ESI†). From the MCR analysis it appears that only a small fraction of charges recombine on the early timescale up to 4 ns at low excitation densities in the p-DTS(FBTTh2)2:PC70BM blend. However, we note that the ground-state bleach does not remain constant on the same timescale. This indicates that either a fraction of the singlet excitons decay without being quenched at the interface or during the charge transfer process at the interface or alternatively that a negative charge-induced absorption signal is superimposed on the ground-state bleach and hence reduces the positive ground-state bleach signal. This interpretation is supported by MCR analysis of the visible data as shown in Fig. 6. Here, component 2 is assigned to the spatially separated charges, as the EA signal could clearly be observed. Component 1 is assigned to p-DTS(FBTTh2)2 excitons with a ground-state bleach and additionally a strong contribution from the stimulated emission ranging from 750–850 nm. In contrast to the rather constant signal observed for p-DTS(FBTTh2)2:PC70BM, the concentration profile of the second (charge carrier-related) component in p-DTS(FBTTh2)2:ICBA decreases by 50–70% on the short timescale.
 | ||
| Fig. 7 Kinetics of p-DTS(FBTTh2)2:ICBA (upper panel) and p-DTS(FBTTh2)2:PC70BM (lower panel) tracked at 1025–1075 nm (charge induced absorption). | ||
The TA data also allowed us to draw some conclusions on the nanoscale morphology of the investigated samples. The evolution of the spectra at the 0–0-transition on the short timescale (see lower panels of Fig. S11, ESI†) as well as the evolution of the charge-induced absorption peak obtained by MCR analysis from both the visible and the NIR data (Fig. 6 and S9 ESI,† lower panels, grey solid lines) implies that exciton diffusion plays a more dominant role in p-DTS(FBTTh2)2:PC70BM blends compared to p-DTS(FBTTh2)2:ICBA, as the respective maxima are reached after a longer delay time in the PC70BM containing blends. A further indication is the amplitude of the charge carrier-induced absorption observed directly after excitation and obtained by MCR analysis (lower panels of Fig. S9, ESI†). The initial carrier-induced absorption in p-DTS(FBTTh2)2:PC70BM is below 25% with respect to the maximum charge carrier concentration at later times, whereas in p-DTS(FBTTh2)2:ICBA blends more than 50% of the signal is obtained from the very beginning suggesting a more intimate mixing of donor and acceptor domains and thus a larger fraction of ultrafast charge transfer. This is supported by the AFM images and GIWAXS experiments as presented above. In fact, the domain size in the p-DTS(FBTTh2)2:ICBA system is ∼17 nm, whereas p-DTS(FBTTh2)2:PC70BM blends show domain sizes of up to 40 nm as reported recently.38 This can be explained by the stronger tendency of PC70BM to cluster and crystallize as the steric hindrance introduced by the side groups is less pronounced than in ICBA. We note also that Gelinas et al. recently observed two charge generation pathways for p-DTS(FBTTh2)2:PC70BM blends – an ultrafast component contributing about 70% weight with an inverse rate constant of ∼82 fs and a second component contributing 30% of the amplitude, which was diffusion-limited and had an inverse rate constant of ∼22 ps. A very similar inverse rate constant of 26.6 ps is also observed in our TA measurements, however, only at the highest excitation fluence, while lower excitation fluences resulted in values as high as 44.4 ps. This is indicative of some exciton-exciton annihilation. The faster femtosecond component could not be resolved by our setup, as it is below the temporal resolution of ∼200 fs. However, MCR analysis suggested a smaller fraction of ultrafast charge generation, as the initial signal amplitude related to charges is below 25%.
2.5. Charge recombination in p-DTS(FBTTh2)2:ICBA and p-DTS(FBTTh2)2:PC70BM
On the ns to μs timescale the TA spectra exhibit similar features as on the ps to ns timescale, specifically the EA signal is also observed (see Fig. 8). The EA signal is still more pronounced in the case of p-DTS(FBTTh2)2:PC70BM blends, again indicating that a higher fraction of free charge carriers contribute to the signal in the more efficient device. | ||
| Fig. 8 Spectra of (a) p-DTS(FBTTh2)2:ICBA and (b) p-DTS(FBTTh2)2:PC70BM after excitation with 532 nm (9.5 μJ cm−2 and 5.5 μJ cm−2 respectively). | ||
Furthermore, the TA signal of p-DTS(FBTTh2)2:ICBA in the spectral range between 1055 and 1080 nm is significantly longer-lived (up to 10 μs) and its decay is only weakly intensity dependent over the entire dynamic range (Fig. 9, upper panel). In contrast, the TA signal of p-DTS(FBTTh2)2:PC70BM is vanished after 1 μs and shows a strongly intensity dependent decay (Fig. 9, lower panel). It has been reported previously that ICBA blends tend to form trapped CT states at the interface that are loosely bound, but in which charges still experience their mutual coulombic attraction.39 Decay times between 60 and 100 ns were reported for this type of geminate recombination. Additionally, the reduced tendency to aggregate, which is inherent to ICBA compared to PCBM, can lead to the formation of small isolated fullerene domains. CT states formed within these domains also decay via a quasi-geminate recombination mechanism.40 Aggregated fullerene domains have also been assigned to be “energetic sinks” that drive charge separation in donor–acceptor blends. ICBA largely lacks this type of thermodynamic driving force thus reducing efficient charge generation.41 Taking the extended lifetime into account, losses via recombination of trapped CT states appear to be in p-DTS(FBTTh2)2:ICBA blends.
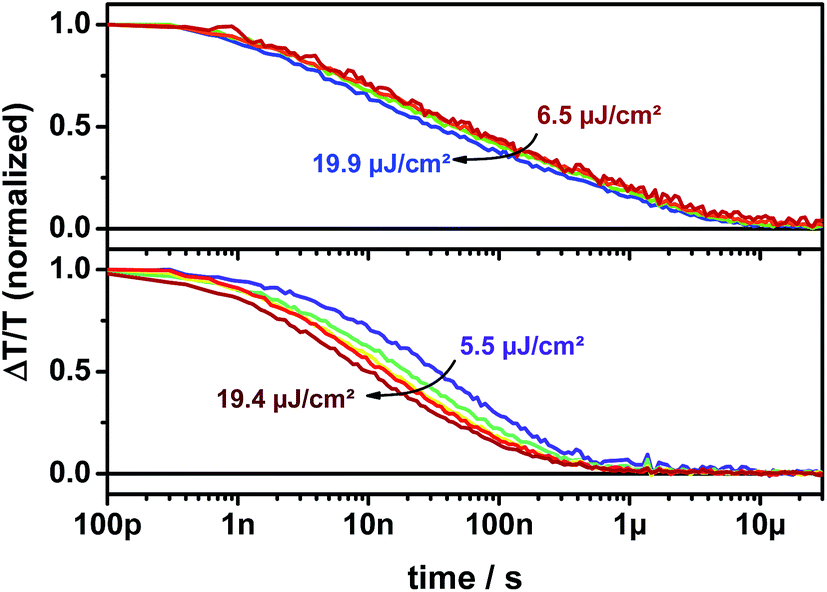 | ||
| Fig. 9 Kinetics of p-DTS(FBTTh2)2:ICBA (upper panel) and p-DTS(FBTTh2)2:PC70BM (lower panel) films tracked at 1055–1080 nm. | ||
Nonetheless, both blends produce a relatively high amount of extractable charge carriers as confirmed by a PCE exceeding 5%. This is supported by the dynamics of the photo-induced absorption (PIA) between 720 and 1000 nm (see lower panels of Fig. S12, ESI†). Here, both blends show intensity dependent dynamics. The discrepancy between intensity dependent and intensity independent dynamics observed for different spectral regions might result from convoluted free as well as bound charge-induced absorption spectra. Interestingly, both blends show only a weak intensity dependence of the dynamics of the ground-state bleaching (see the upper panel of Fig. S12, ESI†).
The ns to μs data of the p-DTS(FBTTh2)2:PC70BM blend was further analyzed using a previously reported two-pool model that combines an intensity independent geminate decay of coulombically bound CT states (first pool) and an intensity dependent non-geminate decay of spatially separated charges (second pool). The fit results are displayed in Fig. 10, where the open symbols represent the experimentally measured data and the solid lines correspond to the fits of the data according to the two pool model. However, this model could not be applied to the p-DTS(FBTTh2)2:ICBA. While some intensity dependence was observed in the range of 900–950 nm, a signal offset was also observed, indicating that the formation of trapped CT states influences the kinetics (see the lower panel of Fig. S12, ESI†) in this spectral range. Therefore, an analysis using only two pools would not be meaningful due to the likely superposition of spectral features from different species with unknown concentrations and cross-sections.
 | ||
| Fig. 10 Fit of the ns to μs data of p-DTS(FBTTh2)2:PC70BM (1055–1080 nm) with a two-pool model based on concomitant geminate and non-geminate recombination. | ||
The results obtained for p-DTS(FBTTh2)2:PC70BM blends show that a large fraction of free charge carriers are present in the sample after excitation, precisely ∼85%, that can, in principle, contribute to the device photocurrent. We note that the fraction of free charge carrier formation of 85% is in line with the high IQE of the blend of around 85% indicating that those charges can be extracted as photocurrent. Furthermore, the inverse geminate recombination rate is determined to be ∼2 ns, which is very similar to previously reported lifetimes of geminate pairs in polymer–fullerene blends as they were observed for example in samples prepared with P3HT,42 PCDTBT,43 PCPDTBT,44 and PPE–PPV.45 The fits also yield an effective bimolecular recombination (BMR) coefficient of 1.25 × 10⁻¹¹ cm3 s−1 obtained by recalculating the extracted non-geminate recombination coefficient to a bimolecular recombination coefficient at a charge carrier density of 5 × 1015 cm−3. This value is rather high compared to other polymer:fullerene blends, such as P3HT:PC60BM or PCDTBT:PC60BM,43 which have BMR coefficients about two to one order of magnitude lower, respectively. Interestingly, charge carrier mobility measurements using the space charge limited current (SCLC) model revealed a rather high and balanced electron and hole mobility of 1.08 × 10⁻³ cm2 V−1 s−1 and 1.20 × 10⁻³ cm2 V−1 s−1, respectively, in the p-DTS(FBTTh2)2:PC70BM blends. In fact, mobilities reported for PCDTBT and P3HT are in the range of 10−5 cm2 V−1 s−1,46,47 and thus two orders of magnitude lower than the hole mobility of p-DTS(FBTTh2)2. This could very well explain the larger effective BMR coefficient in p-DTS(FBTTh2)2:PC70BM blends as, in principle, charge carriers with a higher mobility more often encounter the donor–acceptor interface where they can recombine. However, the comparably high mobility of charges also explains why the solar cells still exhibit decent efficiencies, despite fast non-geminate recombination. In fact, the high mobility allows fast carrier extraction from the photoactive layer in operating solar cells, thereby shifting the competition between charge carrier extraction and non-geminate recombination towards carrier extraction.
3. Conclusions
We demonstrate high VOC (∼1 V) BHJ solar cells with a PCE of ∼5% using the p-DTS(FBTTh2)2:ICBA system. While compared to the previously reported p-DTS(FBTTh2)2:PC70BM system a more than 0.2 V improvement in VOC was achieved, the overall PCE remains lower than that of the p-DTS(FBTTh2)2:PC70BM system. Transient spectroscopic experiments on p-DTS(FBTTh2)2 blended with either PC70BM or ICBA revealed that using PC70BM as an acceptor leads to more efficient generation of free charges. In addition, soft modeling of the TA data by MCR analysis suggested that charge separation is not only ultrafast but also in large part diffusion-limited. We note that the MCR analysis also provides limited information about the sample morphology and domain sizes, which are in line with AFM and XRD studies on these blends. Furthermore, we find that the charge carriers in p-DTS(FBTTh2)2:PC70BM decay via an intensity-dependent recombination, while the dynamics in p-DTS(FBTTh2)2:ICBA blends are only weakly intensity-dependent implying the recombination of long-lived CT states and trapped charges in the latter. A closer analysis of the ns to μs recombination dynamics of photogenerated charges in the p-DTS(FBTTh2)2:PC70BM based devices by a two-pool model suggests that about 85% of the charges are free and can potentially contribute to the photocurrent, which is in line with the internal quantum efficiency of these blends.All in all, the measurements provide insight into the question why blends consisting of p-DTS(FBTTh2)2 and PC70BM outperform those using ICBA as an acceptor with PCEs of 8.01% and 5.07%, respectively. Moreover, the present study supports recent findings that aggregated (crystalline) fullerene domains are beneficial for charge separation at the donor–acceptor interface.39,41 In contrast, blends containing ICBA form smaller domains giving rise to long-lived CT states and carrier trapping. Whilst previous work suggests that one crystalline component is sufficient to oppress the formation of bound states, we found that although 2D-GIWAXS experiments suggest a pronounced crystallinity of ICBA, it is not sufficient to generate as many free charges as in PCBM blends. Further experiments are required to better understand the initial charge separation such as ultrafast mobility measurements using different fullerene derivatives to evaluate the role of the initial carrier mobility of different acceptors in the charge separation process.
4. Experimental
4.1. Device fabrication and characterization
The ITO-coated glass was first cleaned by detergent, acetone and isopropyl alcohol with ultra-sonication sequentially, followed by the UV/ozone treatment for 10 min. The hole transport material of PEDOT:PSS (Clevious PH) was spin-coated at 5000 rpm for 40 s to obtain a film thickness of ∼30 nm. The p-DTS(FBTTh2)2:ICBA blend solution was prepared from a total of 35 mg mL−1 in chlorobenzene with various DIO amounts. The solution is dissolved at 60 °C overnight. Before spin-casting, the solution was heated at 90 °C for 15 min. The BHJ film was obtained from spin-casting the solution at 2000 rpm for 45 s. The films were baked to 80 °C for 10 min to evaporate residual solvent and then annealed between 100 °C and 130 °C for 5 min. The thickness of the BHJ film is ∼100 nm as determined using a profilometer. Then, the Ca layer was thermally evaporated with a thickness of 20 nm, and the Al cathode was continuously deposited to ∼80 nm under the vacuum condition of 4 × 10⁻⁶ Torr. The fabricated solar cells were encapsulated with epoxy and cover glass. The J–V characteristics of the solar cells were measured using a Keithley 2400 source meter unit. The light source was calibrated by using silicon reference cells with an AM 1.5G solar simulator with an intensity of 100 mW cm−2. During the testing, an aperture with an area of 4.5 mm2 was used to accurately measure the performance of solar cells. All solar cells were tested in ambient air. The EQE was measured using a QE measurement system (PV measurements, Inc.) after monochromatic power calibration to confirm the JSC value.4.2. Thin film characterization
The nano-morphology of the pristine p-DTS(FBTTh2)2 film and p-DTS(FBTTh2)2:PC70BM BHJ film were investigated by AFM (AFM Asylum MFP3D) to characterize the surface morphology. 2D grazing-incidence wide-angle X-ray scattering (GIWAXS) measurements were performed at the Stanford Synchrotron Radiation Lightsource (SSRL) on Beamline 11-3, with a MAR345 image plate area detector, at 12.7 keV incident photon energy, and at incident angles of 0.10–0.12°. Thin film illumination occurred in a helium atmosphere to minimize X-ray beam damage. The films were spin cast on PEDOT:PSS coated glass for AFM and GIWAXS measurements.4.3. Transient absorption spectroscopy
Transient absorption (TA) measurements were performed with a home-built pump–probe setup. To measure in the time range of 1–4 ns with a resolution of ∼100 fs, the output of a commercial titanium:sapphire amplifier (Coherent LIBRA-HE, 3.5 mJ, 1 kHz, 100 fs) was split into two beams that pumped two independent commercial optical parametric amplifiers (Coherent OPerA Solo). One optical parametric amplifier (OPA) was used to generate the tunable excitation pulses in the visible range, while the second OPA was used to generate the seed beam for white-light generation. For measurements in the spectral range between 550 and 1100 nm a 1300 nm seed of a few μJ was focused into a c-cut 3 mm thick sapphire window for white-light generation. Mostly reflective elements were used to guide the probe beam to the sample to minimize chirp. The excitation pulse was chopped at 500 Hz, while the white-light pulses were dispersed onto a linear silicon photodiode array, which was read out at 1 kHz by home-built electronics. Adjacent diode readings corresponding to the transmission of the sample after an excitation pulse and without an excitation pulse were used to calculate ΔT/T.For measurements in the time range between 1 ns and 1 ms with a resolution of 600 ps, the excitation pulse was provided by an actively Q-switched Nd:YVO4 laser (AOT Ltd. MOPA) at 532 nm. In this case, the delay between the pump and probe was controlled by an electronic delay generator (Stanford Research Systems DG535). TA measurements were performed at room temperature under a dynamic vacuum of <10−5 mbar.
For TA measurements in the NIR spectral range covering 1100–2000 nm, a 2100 nm seed was used to generate white-light in an yttrium vanadate window. Furthermore, a dichroic mirror was used to separate the residual seed beam (idler of the OPA at 2100 nm) from the broadband NIR supercontinuum. The NIR pulses were dispersed onto a Peltier-cooled 512 pixel long linear extended InGaAs array (Entwicklungsbüro Stresing) and read out as described above.
MCR-ALS analysis is a soft-modeling technique that decomposes a three-dimensional data matrix into spectra and the corresponding concentration profiles. The data here can be described by two components unraveled by singular-value decomposition (SVD).
Acknowledgements
The authors are grateful to support from the Office of Naval Research and A*STAR SERC TSRP grant (Grant #102 170 0137). TQN thanks the Camille Dreyfus Teacher Scholar Award program. F.L. thanks the Max Planck Society for funding the Max Planck Research Group of Organic Optoelectronics and the Deutsche Forschungsgemeinschaft (DFG) for funding in the framework of the priority program SPP1355 “Elementary Processes in Organic Photovoltaics”. A.K.K.K. thanks BMBF for funding “Green Talents-Research Stay in Germany”. D.G. acknowledges a Kekulé scholarship of the Fonds der Chemischen Industrie (FCI). Use of the Stanford Synchrotron Radiation Lightsource, SLAC National Accelerator Laboratory, is supported by the U.S. Department of Energy, Office of Science, Office of Basic Energy Sciences under Contract no. DE-AC02-76SF00515.Notes and references
- A. J. Bard and M. A. Fox, Acc. Chem. Res., 1995, 28, 141–145 CrossRef CAS.
- S. Esiner, H. van Eersel, M. M. Wienk and R. A. J. Janssen, Adv. Mater., 2013, 25, 2932–2936 CrossRef CAS PubMed.
- M. G. Walter, E. L. Warren, J. R. McKone, S. W. Boettcher, Q. Mi, E. A. Santori and N. S. Lewis, Chem. Rev., 2010, 110, 6446–6473 CrossRef CAS PubMed.
- T. R. Cook, D. K. Dogutan, S. Y. Reece, Y. Surendranath, T. S. Teets and D. G. Nocera, Chem. Rev., 2010, 110, 6474–6502 CrossRef CAS PubMed.
- I. D. Parker, J. Appl. Phys., 1994, 75, 1656–1666 CrossRef CAS PubMed.
- V. D. Mihailetchi, P. W. M. Blom, J. C. Hummelen and M. T. Rispens, J. Appl. Phys., 2003, 94, 6849–6854 CrossRef CAS PubMed.
- J. Liu, Y. Shi and Y. Yang, Adv. Funct. Mater., 2001, 11, 420–424 CrossRef CAS.
- J. Brabec, A. Cravino, D. Meissner, N. S. Sariciftci, T. Fromherz, M. T. Rispens, L. Sanchez and J. C. Hummelen, Adv. Funct. Mater., 2001, 11, 374–380 CrossRef.
- G. Li, C.-W. Chu, V. Shrotriya, J. Huang and Y. Yang, Appl. Phys. Lett., 2006, 88, 253503 CrossRef PubMed.
- C. Zhang, S. W. Tong, C. Zhu, C. Jiang, E. T. Kang and D. S. H. Chan, Appl. Phys. Lett., 2009, 94, 103305 CrossRef PubMed.
- K. Vandewal, K. Tvingstedt, A. Gadisa, O. Inganas and J. V. Manca, Nat. Mater., 2009, 8, 904–909 CrossRef CAS PubMed.
- N. Li, B. E. Lassiter, R. R. Lunt, G. Wei and S. R. Forrest, Appl. Phys. Lett., 2009, 94, 023307 CrossRef PubMed.
- M. C. Scharber, D. Mühlbacher, M. Koppe, P. Denk, C. Waldauf, A. J. Heeger and C. J. Brabec, Adv. Mater., 2006, 18, 789–794 CrossRef CAS.
- G. Li, Y. Yao, H. Yang, V. Shrotriya, G. Yang and Y. Yang, Adv. Funct. Mater., 2007, 17, 1636–1644 CrossRef CAS.
- A. K. K. Kyaw, X. W. Sun, C. Y. Jiang, G. Q. Lo, D. W. Zhao and D. L. Kwong, Appl. Phys. Lett., 2008, 93, 221107 CrossRef PubMed.
- S. H. Park, A. Roy, S. Beaupre, S. Cho, N. Coates, J. S. Moon, D. Moses, M. Leclerc, K. Lee and A. J. Heeger, Nat. Photonics, 2009, 3, 297–302 CrossRef CAS.
- E. Wang, L. Hou, Z. Wang, S. Hellström, F. Zhang, O. Inganäs and M. R. Andersson, Adv. Mater., 2010, 22, 5240–5244 CrossRef CAS PubMed.
- Y. He, H.-Y. Chen, J. Hou and Y. Li, J. Am. Chem. Soc., 2010, 132, 1377–1382 CrossRef CAS PubMed.
- Y.-J. Cheng, C.-H. Hsieh, Y. He, C.-S. Hsu and Y. Li, J. Am. Chem. Soc., 2010, 132, 17381–17383 CrossRef CAS PubMed.
- X. Fan, C. Cui, G. Fang, J. Wang, S. Li, F. Cheng, H. Long and Y. Li, Adv. Funct. Mater., 2012, 22, 585–590 CrossRef CAS.
- S.-H. Liao, Y.-L. Li, T.-H. Jen, Y.-S. Cheng and S.-A. Chen, J. Am. Chem. Soc., 2012, 134, 14271–14274 CrossRef CAS PubMed.
- Z. Sun and S. Stafström, J. Chem. Phys., 2013, 138, 164905 CrossRef PubMed.
- M. Muntwiler, Q. Yang, W. A. Tisdale and X. Y. Zhu, Phys. Rev. Lett., 2008, 101, 196403 CrossRef.
- X. Y. Zhu, Q. Yang and M. Muntwiler, Acc. Chem. Res., 2009, 42, 1779–1787 CrossRef CAS PubMed.
- A. Rao, P. C. Y. Chow, S. Gelinas, C. W. Schlenker, C.-Z. Li, H.-L. Yip, A. K. Y. Jen, D. S. Ginger and R. H. Friend, Nature, 2013, 500, 435–439 CrossRef CAS PubMed.
- X. Gong, M. Tong, F. G. Brunetti, J. Seo, Y. Sun, D. Moses, F. Wudl and A. J. Heeger, Adv. Mater., 2011, 23, 2272–2277 CrossRef CAS PubMed.
- D. Yang, Q. Yang, L. Yang, Q. Luo, Y. Huang, Z. Lu and S. Zhao, Chem. Commun., 2013, 49, 10465–10467 RSC.
- J. Yuan, Z. Zhai, H. Dong, J. Li, Z. Jiang, Y. Li and W. Ma, Adv. Funct. Mater., 2013, 23, 885–892 CrossRef CAS.
- A. K. K. Kyaw, D. H. Wang, V. Gupta, W. L. Leong, L. Ke, G. C. Bazan and A. J. Heeger, ACS Nano, 2013, 7, 4569–4577 CrossRef CAS PubMed.
- T. S. van der Poll, J. A. Love, T.-Q. Nguyen and G. C. Bazan, Adv. Mater., 2012, 24, 3646–3649 CrossRef CAS PubMed.
- Y. Kim, S. A. Choulis, J. Nelson, D. D. C. Bradley, S. Cook and J. R. Durrant, Appl. Phys. Lett., 2005, 86, 063502 CrossRef PubMed.
- G. Li, V. Shrotriya, Y. Yao and Y. Yang, J. Appl. Phys., 2005, 98, 043704 CrossRef PubMed.
- Z. M. Beiley, E. T. Hoke, R. Noriega, J. Dacuña, G. F. Burkhard, J. A. Bartelt, A. Salleo, M. F. Toney and M. D. McGehee, Adv. Energy Mater., 2011, 1, 954–962 CrossRef CAS.
- B. Walker, A. B. Tamayo, X.-D. Dang, P. Zalar, J. H. Seo, A. Garcia, M. Tantiwiwat and T.-Q. Nguyen, Adv. Funct. Mater., 2009, 19, 3063–3069 CrossRef CAS.
- S. Gélinas, A. Rao, A. Kumar, S. L. Smith, A. W. Chin, J. Clark, T. S. van der Poll, G. C. Bazan and R. H. Friend, Science, 2014, 343, 512–516 CrossRef PubMed.
- I. A. Howard, H. Mangold, F. Etzold, D. Gehrig and F. Laquai, in Ultrafast Dynamics in Molecules, Nanostructures and Interfaces, pp. 53–78, DOI:10.1142/9789814556927_0004.
- D. W. Gehrig, S. Roland, I. A. Howard, V. Kamm, H. Mangold, D. Neher and F. Laquai, J. Phys. Chem. C, 2014, 118, 20077–20085 CAS.
- J. A. Love, C. M. Proctor, J. Liu, C. J. Takacs, A. Sharenko, T. S. van der Poll, A. J. Heeger, G. C. Bazan and T.-Q. Nguyen, Adv. Funct. Mater., 2013, 23, 5019–5026 CrossRef CAS.
- S. Shoaee, S. Subramaniyan, H. Xin, C. Keiderling, P. S. Tuladhar, F. Jamieson, S. A. Jenekhe and J. R. Durrant, Adv. Funct. Mater., 2013, 23, 3286–3298 CrossRef CAS.
- M. A. Faist, S. Shoaee, S. Tuladhar, G. F. A. Dibb, S. Foster, W. Gong, T. Kirchartz, D. D. C. Bradley, J. R. Durrant and J. Nelson, Adv. Energy Mater., 2013, 3, 744–752 CrossRef CAS.
- F. C. Jamieson, E. B. Domingo, T. McCarthy-Ward, M. Heeney, N. Stingelin and J. R. Durrant, Chem. Sci., 2012, 3, 485–492 RSC.
- I. A. Howard, R. Mauer, M. Meister and F. Laquai, J. Am. Chem. Soc., 2010, 132, 14866–14876 CrossRef CAS PubMed.
- F. Etzold, I. A. Howard, R. Mauer, M. Meister, T.-D. Kim, K.-S. Lee, N. S. Baek and F. Laquai, J. Am. Chem. Soc., 2011, 133, 9469–9479 CrossRef CAS PubMed.
- F. Etzold, I. A. Howard, N. Forler, D. M. Cho, M. Meister, H. Mangold, J. Shu, M. R. Hansen, K. Müllen and F. Laquai, J. Am. Chem. Soc., 2012, 134, 10569–10583 CrossRef CAS PubMed.
- H. Mangold, A. A. Bakulin, I. A. Howard, C. Kastner, D. A. M. Egbe, H. Hoppe and F. Laquai, Phys. Chem. Chem. Phys., 2014, 16, 20329–20337 RSC.
- T. Wang, A. J. Pearson, A. D. F. Dunbar, P. A. Staniec, D. C. Watters, H. Yi, A. J. Ryan, R. A. L. Jones, A. Iraqi and D. G. Lidzey, Adv. Funct. Mater., 2012, 22, 1399–1408 CrossRef CAS.
- R. Mauer, M. Kastler and F. Laquai, Adv. Funct. Mater., 2010, 20, 2085–2092 CrossRef CAS.
Footnotes |
| † Electronic supplementary information (ESI) available: Further details are given in Fig. S1–S12. See DOI: 10.1039/c4ta06256f |
| ‡ These authors contributed equally to this work. |
| This journal is © The Royal Society of Chemistry 2015 |