 Open Access Article
Creative Commons Attribution 3.0 Unported Licence
Phosphorus–carbon nanocomposite anodes for lithium-ion and sodium-ion batteries
Thrinathreddy
Ramireddy
a,
Tan
Xing
a,
Md Mokhlesur
Rahman
a,
Ying
Chen
a,
Quentin
Dutercq
ab,
Daniel
Gunzelmann
a and
Alexey M.
Glushenkov
*ac
aInstitute for Frontier Materials, Deakin University, Waurn Ponds, 3216 Victoria, Australia. E-mail: alexey.glushenkov@deakin.edu.au
bUniversité de Nantes, Polytech Nantes, Institut des Matériaux Jean Rouxel, CNRS, Rue Christian Pauc, BP 50609, 44306 Nantes Cedex 3, France
cMelbourne Centre for Nanofabrication, 151 Wellington Rd, Clayton, VIC 3168, Australia
First published on 5th February 2015
Abstract
With the expected theoretical capacity of 2596 mA h g−1, phosphorus is considered to be the highest capacity anode material for sodium-ion batteries and one of the most attractive anode materials for lithium-ion systems. This work presents a comprehensive study of phosphorus–carbon nanocomposite anodes for both lithium-ion and sodium-ion batteries. The composite electrodes are able to display high initial capacities of approximately 1700 and 1300 mA h g−1 in lithium and sodium half-cells, respectively, when the cells are tested within a larger potential windows of 2.0–0.01 V vs. Li/Li+ and Na/Na+. The level of demonstrated capacity is underpinned by the storage mechanism, based on the transformation of phosphorus to Li3P phase for lithium cells and an incomplete transformation to Na3P phase for sodium cells. The capacity deteriorates upon cycling, which is shown to originate from disintegration of electrodes and their delamination from current collectors by post-cycling ex situ electron microscopy. Stable cyclic performance at the level of ∼700 and ∼350–400 mA h g−1 can be achieved if the potential windows are restricted to 2.0–0.67 V vs. Li/Li+ for lithium and 2–0.33 vs. Na/Na+ for sodium half-cells. The results are critically discussed in light of existing literature reports.
Introduction
Phosphorus is a non-metallic element, which is known to have three common allotropes – white, red and black.1 White phosphorus is volatile and unstable; it bursts into flames when it is exposed to natural atmosphere. Red phosphorus is usually amorphous in nature and is widely commercially available. Black phosphorus is a crystalline phase, thermodynamically stable below 550 °C and transforming to red (amorphous) phosphorus at higher temperature.1,2 Among various applications, the use of phosphorus in anodes of lithium-ion and sodium-ion batteries attracts attention due to its high theoretical capacity (2596 mA h g−1).3 Specifically, red and black forms of phosphorus have been considered as candidates for anode materials.4–11In lithium-ion batteries phosphorus is considered as a possible high capacity alternative to the conventional graphitic anode (theoretical capacity of only 372 mA h g−1). The theoretical capacity of phosphorus is much higher than that and is inferior only to Si (4200 mA h g−1)3,12 among the materials that can electrochemically alloy with lithium. Due to the limitations of electronic conductivity and significant volume changes upon operation in a lithium-ion battery, the practical electrochemical performance of bulk red or black phosphorus has been found unsatisfactory, with either poor reversibility and Coulombic efficiency4–6 or problematic cyclic stability.7 The current consensus opinion is that phosphorus-based battery anodes should be prepared in the form of nanocomposites in which the phosphorus component is finely dispersed in the carbon component.4,5,8–11 Composites of amorphous phosphorus8 as well as red4,9 and black5,8,10 crystalline forms with carbon have been demonstrated. Reasonably stable capacity retention over up to 100 cycles with high Coulombic efficiencies has been reported by Wang et al.11 and Qian et al.8 These two recent manuscripts claim the stable capacity in the phosphorus component of the composites in excess of 2000 mA h g−1, utilising 92.8 and 90.7% of the theoretical capacity of phosphorus, respectively. Sun et al. have suggested that the formation of stable P–C bonds may be responsible for the stability of ball milled phosphorus–carbon nanocomposites in lithium-ion battery anodes.13
In sodium-ion batteries the anode materials conventionally considered for lithium-ion batteries such as graphite, Ge or Si are either inactive or able to display only small capacities.14 As a result, Sb, Sn and P have emerged as possible high-capacity anode materials operating via an alloying–dealloying mechanism.15–18 Among them, phosphorus has the highest theoretical capacity, which makes it a very interesting material to study. Recently, phosphorus has been tested as an anode for Na-ion battery. Kim et al. have estimated that amorphous red phosphorus–carbon composite could deliver a capacity of 1890 mA h g−1 at a current rate of 143 mA g−1 (ref. 18) at a slightly elevated temperature of 30 °C. Qian et al. have reported amorphous phosphorus–carbon composite with a capacity of 1750 mA h g−1 at a current rate of 250 mA g−1 at room temperature.19 Subsequently, Li et al. have prepared red phosphorus–carbon nanotube composite by hand grinding in an agate mortar, and the composite demonstrates an initial reversible capacity of 1530 mA h g−1 when tested at current density of 143 mA g−1.20 The capacity was monotonously deteriorating upon cycling, in contrast to the previous report,19 in which deterioration initiated after the first 40 cycles of stable performance. Black phosphorus–carbon composites have not been studied much in conjunction with sodium-ion batteries, with only limited data presented in Supporting Information of paper by Qian et al.19 Phosphorus-based electrodes for sodium-ion batteries have also been assessed by Yabuuchi et al.,21 and it has been revealed that adding fluoroethylene carbonate to the electrolyte is critical for the stability of phosphorus-based anodes.
Herein we present the synthesis of phosphorus–carbon nanocomposites and their systematic evaluation as lithium-ion and sodium-ion anode materials. The structural analysis indicates that the composites contain black (orthorhombic) phosphorus either in the form of crystalline nanoparticles or in significantly disordered state. Discussion of data and correlation with previously published results are presented. Phase changes in the electrode upon discharge and charge of lithium and sodium half-cells are analysed, and the structural integrity of phosphorus-based electrodes cycled within full (2.0–0.01 V vs. Li/Li+ or Na/Na+) or restricted potential windows is studied. We expect that our results will stimulate further important developments of phosphorus-based anode materials for metal-ion batteries.
Experimental
Material synthesis
Red phosphorus powder (100 mesh, 98.9% purity, Alfa Aesar) was used as a starting material. Black phosphorus was prepared by milling 6 grams of red phosphorus in a stainless steel jar using Fritsch Pulverisette 5 planetary ball mill for 25 h under Ar atmosphere (200 kPa excess pressure above atmospheric). The ball to powder ratio was 110![[thin space (1/6-em)]](https://www.rsc.org/images/entities/char_2009.gif) :
:![[thin space (1/6-em)]](https://www.rsc.org/images/entities/char_2009.gif) 1 (ten balls with a diameter of 25.4 mm were used). Rotation speed was 200 rpm. The obtained black phosphorus was mixed with graphite (Sigma Aldrich, 282863, <20 μm) in a 7
1 (ten balls with a diameter of 25.4 mm were used). Rotation speed was 200 rpm. The obtained black phosphorus was mixed with graphite (Sigma Aldrich, 282863, <20 μm) in a 7![[thin space (1/6-em)]](https://www.rsc.org/images/entities/char_2009.gif) :
:![[thin space (1/6-em)]](https://www.rsc.org/images/entities/char_2009.gif) 3 weight ratio and the mixture was milled in two types of ball mills. Phosphorus–carbon composite C-1 was produced by milling 6 g of the mixture for 25 h in Fritsch Pulverisette 5 planetary ball mill under the conditions similar to those used for preparing black phosphorus. Phosphorus–carbon composite C-2 was produced by milling 5 g of the mixture in a magneto-ball mill.22 Four stainless steel balls (25.4 mm in diameter) were loaded into the vial, and the milling was conducted for 100 h at 160 rpm. The milling was performed under Ar atmosphere at a pressure of 100 kPa above atmospheric in the presence of an external magnet at a 45° position. The milling mode is similar to the ball milling mode C described in ref. 23. The ball to powder ratio in this experiment was 52.8
3 weight ratio and the mixture was milled in two types of ball mills. Phosphorus–carbon composite C-1 was produced by milling 6 g of the mixture for 25 h in Fritsch Pulverisette 5 planetary ball mill under the conditions similar to those used for preparing black phosphorus. Phosphorus–carbon composite C-2 was produced by milling 5 g of the mixture in a magneto-ball mill.22 Four stainless steel balls (25.4 mm in diameter) were loaded into the vial, and the milling was conducted for 100 h at 160 rpm. The milling was performed under Ar atmosphere at a pressure of 100 kPa above atmospheric in the presence of an external magnet at a 45° position. The milling mode is similar to the ball milling mode C described in ref. 23. The ball to powder ratio in this experiment was 52.8![[thin space (1/6-em)]](https://www.rsc.org/images/entities/char_2009.gif) :
:![[thin space (1/6-em)]](https://www.rsc.org/images/entities/char_2009.gif) 1.
1.
Characterization
X-ray diffraction (XRD) patterns of materials and electrodes were obtained by using a PANalytical X'Pert Pro instrument with a Cu Kα radiation source (λ = 1.54181 Å). The XRD patterns were collected over the range of 20–80° by keeping the step size of 0.02 at a scan rate of 2 s per step. The phases in the obtained patterns were analysed using X'Pert High Score Plus software. The cycled electrodes for the XRD analysis were covered with Kapton tape to prevent reacting with moisture and oxygen after being extracted from the lithium and sodium half-cells in an Ar-filled glove box. The TEM characterization was done using a JEOL JEM-2100F instrument operated at 200 kV. Energy-filtered TEM (EFTEM) elemental maps were obtained using a Gatan Quantum ER 965 Imaging Filter and the three-window method.Raman spectroscopic characterisation was performed using a Renishaw inVia micro-Raman system. A laser with 514 nm wavelength was used during the experiment. The power of laser was 2.5 mW (5% of max power) and the accumulation time was 60 s. 20× lens was used in the experiment. The final spectra were formed by accumulating two scans.
Solid-state NMR spectra were acquired using Bruker Avance3 300 and 500 spectrometers, operating at 7.05 and 11.4 T. All samples were handled and packed into standard zirconia magic angle spinning (MAS) rotors in a glove box with argon atmosphere. The samples of red and black P were packed into 2.5 mm MAS rotors, mounted into a triple resonance MAS probe and measured under magic-angle-spinning (MAS) at a speed of 32.5 kHz and a resonance frequency of 202.4 MHz. Due to problems with achieving comparable spinning speeds the nanocomposite samples were packed into 4 mm zirconia MAS rotors and measured at 6 kHz spinning speed at 121.5 MHz resonance frequency. Spectra were acquired using a Solid-Echo pulse sequence with excitation frequencies of 102–143 kHz. All 31P shifts are given relative to 85% H3PO4 solution. The recycle delays were set to 4T1, long enough to guarantee a full spin relaxation according to the T1 relaxation time constants, which were measured independently for each sample. The spectrum of red P was acquired by sampling 64 scans with a recycle delay of 360 s. The spectrum of black P was acquired by sampling 32 scans with a recycle delay of 40 s. The spectrum of composite C-1 was acquired by sampling 64 scans with a delay of 3 s. The composite C-2 was acquired by sampling 320 scans with 180 s recycle delay.
Scanning electron microscopy (SEM) imaging has been done with a Supra 55VP field emission scanning electron microscope. The accelerating voltage was 5 kV and the working distance was about 5 mm. An In-lens detector was used during the experiment to provide images with good signal/noise ratio. The electrodes for SEM imaging were extracted from lithium and sodium half-cells after cycling for a large number of cycles.
Electrochemical characterization
The composite materials were mixed with Super P Li™ (Timcal Ltd.) and sodium carboxymethyl cellulose (CMC) binder (in a weight ratio of 80![[thin space (1/6-em)]](https://www.rsc.org/images/entities/char_2009.gif) :
:![[thin space (1/6-em)]](https://www.rsc.org/images/entities/char_2009.gif) 10
10![[thin space (1/6-em)]](https://www.rsc.org/images/entities/char_2009.gif) :
:![[thin space (1/6-em)]](https://www.rsc.org/images/entities/char_2009.gif) 10) in de-ionized water to form a homogenous slurry. The slurry was then coated onto copper foil substrates and heated in vacuum overnight at 90 °C. All electrodes had a standard size of 1 × 1 cm2 and the weight of active material (phosphorus–carbon composite) was controlled in the range between 0.92 and 1.05 mg. Lithium and sodium half-cells were assembled in the form of CR2032 coin cells inside the Ar-filled glove box (Innovative Technology, USA) using a CR2032 coin cell. Li and Na metal pieces were used as a counter electrodes. The electrolyte for lithium half-cells was 1 M LiPF6 in a 1
10) in de-ionized water to form a homogenous slurry. The slurry was then coated onto copper foil substrates and heated in vacuum overnight at 90 °C. All electrodes had a standard size of 1 × 1 cm2 and the weight of active material (phosphorus–carbon composite) was controlled in the range between 0.92 and 1.05 mg. Lithium and sodium half-cells were assembled in the form of CR2032 coin cells inside the Ar-filled glove box (Innovative Technology, USA) using a CR2032 coin cell. Li and Na metal pieces were used as a counter electrodes. The electrolyte for lithium half-cells was 1 M LiPF6 in a 1![[thin space (1/6-em)]](https://www.rsc.org/images/entities/char_2009.gif) :
:![[thin space (1/6-em)]](https://www.rsc.org/images/entities/char_2009.gif) 1
1![[thin space (1/6-em)]](https://www.rsc.org/images/entities/char_2009.gif) :
:![[thin space (1/6-em)]](https://www.rsc.org/images/entities/char_2009.gif) 1 (by volume) mixture of ethylene carbonate (EC), diethyl carbonate (DEC) and dimethyl carbonate (DMC). The electrolyte for sodium half-cells was 1 M NaClO4 in propylene carbonate (PC) with 2% fluoroethylene carbonate (FEC) additive. Polyethene separators (MTI Corp., USA) and Whatman GF/F microfiber glass separators (Sigma Aldrich) were used for lithium and sodium cells, respectively. The lithium half-cells were galvanostatically charged–discharged between 2.0–0.01 or 2.0–0.67 V vs. Li/Li+ at a current rate of 100 mA g−1 using LAND battery testers (Wuhan LAND Corporation, China). The sodium half-cells were galvanostatically charged–discharged between 2.0–0.01 or 2.0–0.33 V vs. Na/Na+ using the same instruments. All capacities were calculated per total weight of the composites (including both phosphorus and carbon components).
1 (by volume) mixture of ethylene carbonate (EC), diethyl carbonate (DEC) and dimethyl carbonate (DMC). The electrolyte for sodium half-cells was 1 M NaClO4 in propylene carbonate (PC) with 2% fluoroethylene carbonate (FEC) additive. Polyethene separators (MTI Corp., USA) and Whatman GF/F microfiber glass separators (Sigma Aldrich) were used for lithium and sodium cells, respectively. The lithium half-cells were galvanostatically charged–discharged between 2.0–0.01 or 2.0–0.67 V vs. Li/Li+ at a current rate of 100 mA g−1 using LAND battery testers (Wuhan LAND Corporation, China). The sodium half-cells were galvanostatically charged–discharged between 2.0–0.01 or 2.0–0.33 V vs. Na/Na+ using the same instruments. All capacities were calculated per total weight of the composites (including both phosphorus and carbon components).
Results and discussion
Black phosphorus used for the preparation of the composites was synthesized mechanochemically in our laboratory from commercially available red amorphous phosphorus, similarly to the previously used approach.5 Two phosphorus–carbon composites were prepared by high energy ball milling of mixtures of as-produced black (orthorhombic) phosphorus and graphite using two ball mills, a planetary one and a magneto-ball mill. For the purpose of clarity, we refer to the composite prepared by the planetary ball mill as C-1 and the composite prepared by a magneto-ball mill as C-2.Characterisation of samples
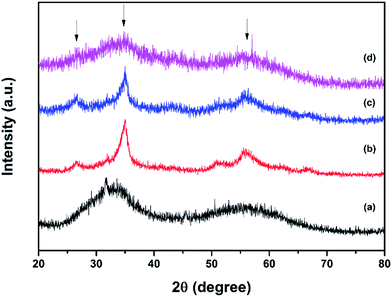
The XRD patterns of red and black phosphorus and the phosphorus–carbon composites are shown in Fig. 1. Red P is amorphous, as expected (Fig. 1a). Its XRD pattern is dominated by two broad humps at 25–38 and 47–65 degrees. In contrast, the XRD pattern of black P (Fig. 1b) displays a number of crystalline peaks, consistent with a standard powder diffraction file (JCPDS #00-009-0020). Similar diffraction patterns for black phosphorus obtained by ball milling were reported previously by Park and Sohn.5 The composite C-1 (Fig. 1c) retains the same crystalline nature of the phosphorus component that can be seen in Fig. 1b for the pure black phase. The phosphorus in the composite C-2 is clearly more disordered, displaying broad X-ray signals (Fig. 1d). A very weak increase in intensities around the positions of the three strongest peaks of the black orthorhombic P (highlighted with arrows) can, however, still be noticed, indicating that some nanocrystalline black P may remain in the composite. The graphitic peaks are not visible in the XRD patterns of either composites C-1 or C-2.Fig. 2a shows the Raman spectra of the red phosphorus and mechanochemically obtained black phosphorus. The Raman signature of the red amorphous phosphorus is consistent with that in other reports.8,11,18 After ball milling, three unambiguous Raman bands appear at about 363, 438 and 467 cm−1, which are the typical Raman fingerprints of black phosphorus7,13 corresponding to the A1g, B2g and A2g modes. These results are consistent with the XRD data and confirm that mechanochemical treatment of red amorphous phosphorus resulted in the formation of the black, orthorhombic phase of phosphorus. Fig. 2b shows the Raman spectra of ball milled phosphorus–carbon composites C-1 and C-2. The phosphorus bands cannot be seen in either sample. The carbon component shows two strong bands at about 1350 and 1600 cm−1, typically referred to in the literature as D and G bands of graphite,24 in both nanocomposites. The D and G bands in the composite C-2 have much larger FWHMs comparing with those in the composite C-1, which reveals a more disordered in-plane structure.25,26 For example, the FWHM of the D band is 120 cm−1 for the composite C-2, comparing with only 70 cm−1 in the composite C-1, indicating a much higher degree of in-plane distortion and disordering in the graphitic structure in the composite C-2.
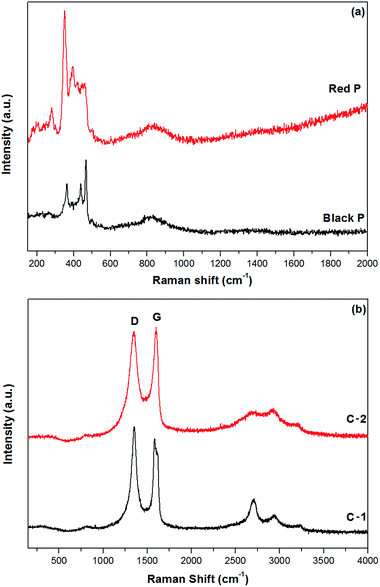 | ||
| Fig. 2 Raman spectra of samples of red and black phosphorus (a) and phosphorus–carbon composites C-1 and C-2 (b). | ||
The 31P NMR spectra of red amorphous phosphorus, black phosphorus and phosphorus–carbon composites C-1 and C-2 are shown in Fig. 3. The spectra of red phosphorus (Fig. 3a) shows very broad signals around δ = −80, +60 and +150 ppm, indicating a highly inhomogeneous, amorphous environment for the 31P nuclei in this material. The measured chemical shifts match the shifts of red and violet phosphorus samples observed by Bytchkov et al.27 The black P (Fig. 3b) spectrum shows a strong signal at δ = 22 ppm with a weaker, broad shoulder at about 10-0 ppm. The observed chemical shift is in agreement with a black phosphorus spectrum acquired by Lange et al.28 whereas the smaller line width indicates a more homogeneous environment for the 31P nuclei in this material with a higher crystallinity when compared to the red phosphorus sample. A similar trend can be observed for the respective phosphorus–carbon nanocomposites, but with the main signal in the composite C-2 (Fig. 3d) showing a very broad signal shifted to around δ = 10 ppm, very similar to the signal of composite C-1 (Fig. 3c). The even broader line width of C-2 is also indicating a very inhomogeneous, amorphous environment, but with the chemical shift and thus an electronic environment and structure closer to black P.
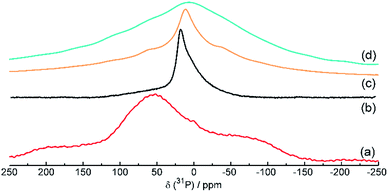 | ||
| Fig. 3 31P solid-state NMR spectra of red amorphous phosphorus (a), mechanochemically produced black phosphorus (b), phosphorus–carbon composite C-1 (c) and phosphorus–carbon composite C-2 (d). | ||
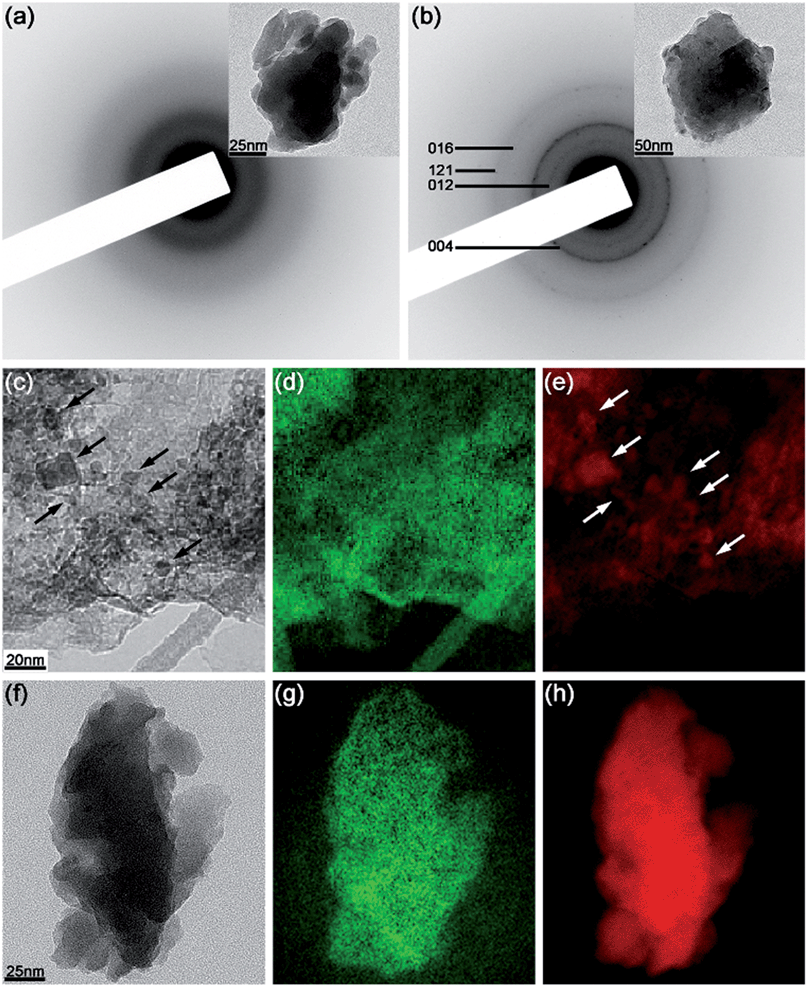
The results of TEM analysis of phosphorus and composite samples are shown in Fig. 4. The electron diffraction pattern of the commercial red phosphorus (Fig. 4a; a bright-field image is also shown as an inset) displays only diffuse rings, consistent with the amorphous nature of this sample. In contrast, the diffraction pattern of black phosphorus (Fig. 4b) displays a set of polycrystalline rings that can be indexed in accordance with the expected orthorhombic phase. In particular, rings corresponding to the (012), (004), (016) and (121) lattice planes can be distinguished.
Energy-filtered TEM was employed to understand the differences in the structure of the composites C-1 and C-2. Fig. 4c and f show elastic images of the two composites, their carbon elemental maps are depicted in Fig. 4d and g, and the phosphorus elemental maps are depicted in Fig. 4e and h. There is a clear difference between the carbon and phosphorus maps of the composite C-1. These maps are not identical, and, furthermore, nanoparticles can be observed in the phosphorus elemental map of C-1 (some of them highlighted with white arrows in Fig. 4e). After a careful inspection of the elastic image (Fig. 4c), the same nanoparticles can be seen as the areas with darker contrast (highlighted with arrows). Taking into account the nanocrystalline peaks of orthorhombic phosphorus in the XRD pattern of C-1 (Fig. 1c), the TEM data are consistent with the presence of crystalline phosphorus nanoparticles in the carbon host in the composite C-1.
In contrast, the elastic image, carbon and phosphorus maps of the composite C-2 (Fig. 4f–h) are essentially identical. No clear nanoparticles are visible in Fig. 4h, and the phosphorus and carbon maps repeat each other. It can be concluded that the phosphorus and carbon are distributed much more homogeneously in the composite C-2. As the spacial resolution of the EFTEM technique is 1–2 nm, our interpretation of the acquired data suggests the presence of very small nanoparticles or nanoclusters of phosphorus with a typical size of 1 nm or less, homogeneously distributed within the carbon component of the composite C-2. In accordance with the XRD and NMR data, these nanoclusters are significantly disordered but may retain the local environment of the black orthorhombic phosphorus.
It is worthwhile to compare our characterisation results with those of other groups for phosphorus–carbon nanocomposites prepared by ball milling.5,8,13,18,19 The differences and similarities in the composition and structure of the composites may shed light on the differences and similarities in their electrochemical performance. As we pointed out, the phosphorus in the composites C-1 and C-2 described here is in the form of black, orthorhombic phase (either crystalline or somewhat disordered). This is likely to originate from the “history” of preparation because the powder of black phosphorus was initially produced and subsequently used for preparing the composites. It is likely that the phosphorus component in the composites inherits at least the local environments of the black, orthorhombic parent phase. It is important to note that the composites prepared by Qian et al.8,19 for both lithium-ion and sodium-ion anodes were also produced via the formation of an intermediate black phase of phosphorus in the composite (refer to the manuscripts and related Supporting Information). Although these authors have described their composites as “amorphous phosphorus/carbon nanocomposites”, it seems that at least some of their materials may be still in the form of black phosphorus (which is evident from the presence of crystalline spots in electron diffraction patterns (ref. 19 and Fig. 1b)) and weak Raman bands at 466 and 437 cm−1 (ref. 8 and Fig. 1b). Due to the similarity of preparation method and the presence of the intermediate black phase, the structure of their material may be close to the structure of our composite C-2 although differences in Raman signatures exist (next paragraph). We believe that our another composite, C-1, is, on the other hand, structurally similar to that produced by Park and Sohn,5 who ball milled carbon black and black phosphorus directly to prepare a composite.
As explained, the Raman spectra do not reveal the presence of the phosphorus bands for the composites C-1 and C-2. Similar lack of Raman signatures has been observed by Kim et al.18 Qian et al.,8,19 in contrast, have observed weak bands at 437 and 466 cm−1, typical for black phosphorus in the Raman spectra of their composites. Sun et al.13 have also detected the presence of Raman bands of black phosphorus in their composite. The presence or lack of phosphorus Raman signals may reflect some differences in the structure of these composites. A Raman feature at about 600–750 cm−1 was assigned to P–C bonds by Sun et al.13 This Raman signature as well as a high-resolution TEM image of a phosphorus–carbon boundary and some XPS data have been used by these researchers as evidence for the presence of phosphorus–carbon bonds, which, according to the manuscript, lead to an improved performance of the material in the lithium-ion battery. Although the formation of phosphorus–carbon bonds or compounds is indeed possible in nanocomposites and is an important consideration, further research is warranted in this area to confirm conclusions about the formation of phosphorus–carbon bonding or any phosphorus–carbon phases.
Information on the distribution of phosphorus in the composites is currently limited. Efforts in systematic mapping of phases by transmission electron microscopy techniques are required to understand this further. Kim et al.18 have presented energy-dispersive X-ray maps of phosphorus and carbon but the resolution of the scans was somewhat limited to pinpoint the differences in the distribution of elements. Another possible problem with the energy-dispersive X-rays maps is a low sensitivity of this method to light elements. Mapping methods based on the energy loss of electrons could be more suitable due to their higher sensitivity to C and P. In this work, we have used energy-filtered elemental mapping and were able to demonstrate that the distributions of the phosphorus component in the composite C-1 and C-2 are quite different. Further efforts in characterising the composites may be focused on the applications of electron energy loss spectrum imaging in the scanning TEM mode.
Electrochemical performance in the 2.0–0.01 V potential window vs. Li/Li+ and Na/Na+
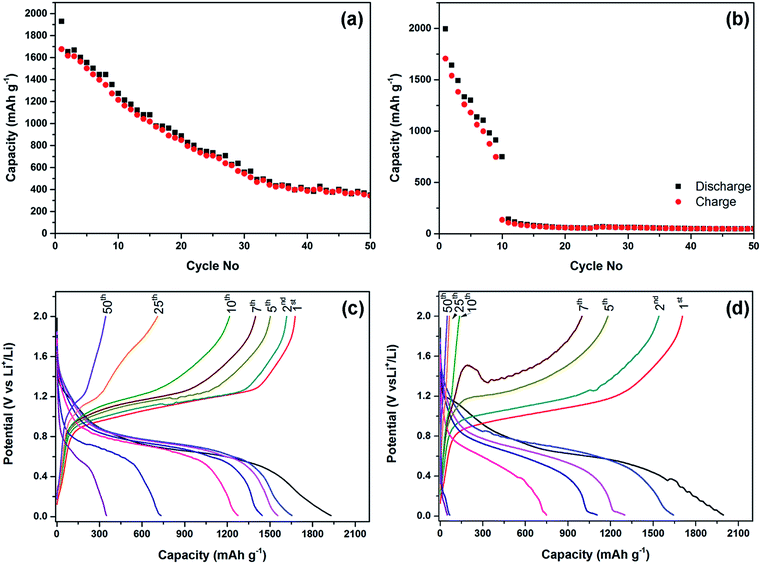
The electrochemical performance of the phosphorus–carbon nanocomposites in lithium half-cells is shown in Fig. 5. The initial discharge capacity (1930 mA h g−1) and Coulombic efficiency (86.9%) of the composite C-1 are quite attractive, although the capacity declines monotonously in the following cycles (Fig. 5a). The discharge capacities measured in the second, seventh and 50th cycles are 1654, 1446 and 349 mA h g−1, respectively. The electrochemical stability of the composite C-2 is inferior to that of the composite C-1 (Fig. 5b). Specifically, the electrode of C-2 demonstrates a steep decline in capacity, with discharge capacities of 1995, 1642, 748 and 49 mA h g−1 measured in the first, second, seventh and 50th cycles, respectively. An interesting observation in the composite C-2 was a sudden drop of capacity in the tenth cycle, in which the charge capacity was dramatically lower than the discharge capacity. The initial Coulombic efficiency of the composite C-2 in the first cycle was similar to that of C-1 (85.5%). Overall, both composites demonstrate declining capacities upon progressive cycling, while the decline appears to be gradual for the composite C-1 and quite abrupt for the composite C-2.The charge–discharge curves of the composites C-1 and C-2 are shown in Fig. 5c and d. The first discharge curves of the composites are different from the subsequent ones and have an irreversible hump at about 1.3–0.95 and 1.2–0.85 V vs. Li/Li+, for the composites C-1 and C-2, respectively. A similar irreversible hump at around the same potentials was observed for the phosphorus–carbon composites by Park and Sohn5 and Qian et al.8 Similarly to the previous reports, composites C-1 and C-2 uptake most of lithium within potential windows 0.95–0.45 V and 0.85–0.4 V vs. Li/Li+, respectively. In the course of the charge of the half-cells the composites C-1 and C-2 release most of lithium within the potential windows of 0.9–1.25 V and 0.8–1.2 V vs. Li/Li+. Polarisation of the charge–discharge curves increases rapidly upon cycling for both composites, and this phenomenon is more pronounced for the composite C-2.
Before discussing the electrochemical results in lithium cells and comparing them with literature, it is important to mention that different authors calculate the reported capacity differently, and this complicates the process of comparing data. In particular, some authors neglect the capacity of the carbon component completely (all measured capacity was attributed to the phosphorus component),4,8,10 some estimated the capacity of the phosphorus component11 and some measured the capacity per total mass of the composite (this work and ref. 11 and 13). Another important consideration is the use of different active material loadings in the electrodes by different authors, and the electrodes with thinner coating of active materials might be, in general, showing better electrochemical performances. In some case, the active material loadings have not been reported. The available experimental results for the phosphorus–carbon composites are summarised in Table 1.
| Sample | Active material loading, mg cm−2 | Initial discharge/charge capacity, mA h g−1 | Cyclic performance | Reference |
|---|---|---|---|---|
| a Capacity is calculated per total weight of the phosphorus–carbon composite. b All capacity is assigned to the phosphorus component, the capacity of carbon components is neglected as minor contribution. c Estimated. Working electrode was prepared by mixing black phosphorus, acetylene black and solid electrolyte. | ||||
| C-1 | 0.92–1.05 | 1930/1677a | Declining gradually. Capacity of 349 mA h g−1 in the 50th cycles. | This work |
| C-2 | 0.92–1.05 | 1995/1706a | Declining more abruptly. Capacity of only 49 mA h g−1 in the 50th cycle. | This work |
| Amorphous phosphorus–carbon composite | ∼3 | 2651/2355b | Minor decline. 90% of capacity is reported to remain after 100 cycles | 8 |
| Activated phosphorus–carbon composite | Not reported | 3289/1385b | Declining. 900 mA h g−1 capacity after 20 cycles | 4 |
| Black phosphorus–acetylene black mixture in a solid-state cell | About 3.1c | 1962/1746b | Declining. Capacity of about 500 mA h g−1 after 150 cycles | 10 |
| Black phosphorus–carbon composite | 2.5 | 2010/1814a | Declining. Capacity of about 200 mA h g−1 after 30 cycles | 5 |
| Nanostructured red phosphorus–carbon composite | Not reported | 1200/840a | Relatively stable capacity. Minor decline. 745 mA h g−1 after 50 cycles | 11 |
| Black phosphorus–graphite composite | 2.0–2.8 | 2786/2382a | Minor decline. 80% Of capacity is reported to remain after 100 cycles | 13 |
The results reported in the literature for lithium cells can be broadly classified into two groups. One group of results suggests a gradual and significant deterioration in the performance in phosphorus–carbon composites. For example, activated amorphous phosphorus–carbon composite with the component ratio of 1![[thin space (1/6-em)]](https://www.rsc.org/images/entities/char_2009.gif) :
:![[thin space (1/6-em)]](https://www.rsc.org/images/entities/char_2009.gif) 1 synthesised by Marino et al. displayed capacity retention of 64.9% at the end of 20th cycle.4 The capacity of black phosphorus–acetylene black electrode in a solid-state cell declined from 1746 to about 500 mA h g−1 after 150 cycles.10 The capacity of black phosphorus–carbon composite prepared by ball milling by Park and Sohn5 dropped from 1814 to about 200 mA h g−1 after 30 cycles within a potential window of 2.0–0.01 V vs. Li/Li+. The latter material, as we expect, is structurally similar to our composite C-1. In the case of our C-1 composite, the cyclic behaviour was similar at a qualitative level to that for the composite in ref. 5 but a better capacity retention was observed (349 mA h g−1 after 50 cycles). This can be correlated with a lighter active material loading (1 mg cm−2 instead of 2.5 mg cm−2) and a more suitable binder (sodium carboxymethyl cellulose instead of polyvinylidene fluoride). Taking these difference into account, the behaviour of our composite C-1 was consistent with the behaviour of the black P–carbon composite reported by Park and Sohn.5
1 synthesised by Marino et al. displayed capacity retention of 64.9% at the end of 20th cycle.4 The capacity of black phosphorus–acetylene black electrode in a solid-state cell declined from 1746 to about 500 mA h g−1 after 150 cycles.10 The capacity of black phosphorus–carbon composite prepared by ball milling by Park and Sohn5 dropped from 1814 to about 200 mA h g−1 after 30 cycles within a potential window of 2.0–0.01 V vs. Li/Li+. The latter material, as we expect, is structurally similar to our composite C-1. In the case of our C-1 composite, the cyclic behaviour was similar at a qualitative level to that for the composite in ref. 5 but a better capacity retention was observed (349 mA h g−1 after 50 cycles). This can be correlated with a lighter active material loading (1 mg cm−2 instead of 2.5 mg cm−2) and a more suitable binder (sodium carboxymethyl cellulose instead of polyvinylidene fluoride). Taking these difference into account, the behaviour of our composite C-1 was consistent with the behaviour of the black P–carbon composite reported by Park and Sohn.5
Three other reports have claimed only moderate declines in capacity and attractive cyclic stabilities over many cycles. Nanostructured phosphorus–porous carbon composite prepared by Wang et al.11 has demonstrated capacity retention of 87% at the end of 55th cycle. However, the phosphorus content in the composite was around 32.6%, very low, which might be a reason behind the excellent cycling stability of the electrodes in this work.11 Due to the high content of the carbon component, the capacity per total weight of the composite was moderate, only at a level of 740–840 mA h g−1. Sun et al.13 have reported 80% retention of capacity in the ball milled black phosphorus–graphite composite, while Qian et al.8 have reported 90% retention of capacity in their amorphous phosphorus–carbon composite (both after 100 cycles). The last two reports demonstrate significantly better cyclic performance of the phosphorus–carbon nanocomposites prepared by ball milling. It is not clear at this stage what leads to such an improvement. Sun et al. have suggested that the formation P–C bonds in their composite played an important role in the improvement of cyclic stability, and the cyclic performance was also a function of the carbon material used as a precursor to create a composite.13 Qian et al. have indicated that the milling time was an important parameter for the performance of their composites. The composites milled for either 6 and 12 h have shown deteriorating cyclic performance with increasing polarisation in the charge–discharge curves while the composite milled for 24 h has demonstrated dramatically improved cyclic performance. The preparation methods used in this work and in ref. 5, 8 and 13 are quite similar. Further research will be required to understand the origin of significant differences observed in the electrochemical performances.
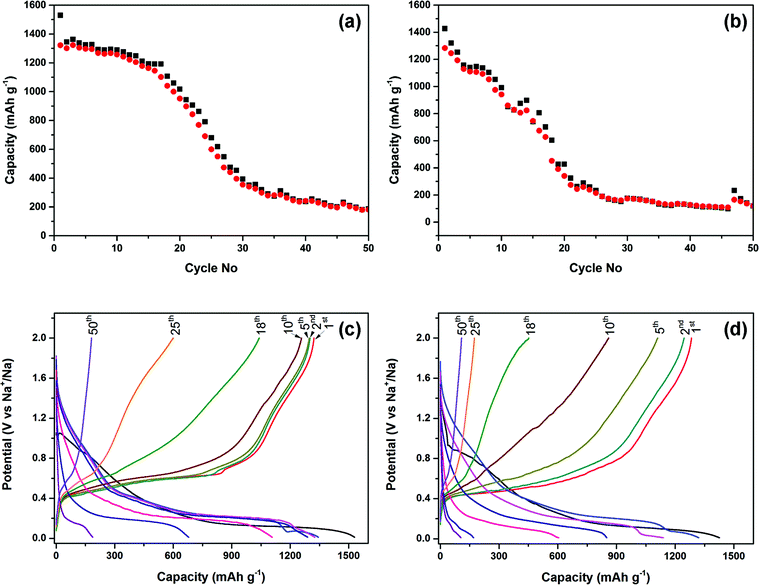
The electrochemical performance of the phosphorus–carbon nanocomposites C-1 and C-2 in sodium half-cells is shown in Fig. 6. The initial discharge capacity of the composite C-1 was 1530 mA h g−1 and its measured Coulombic efficiency was 86.4%. After a minor decline in capacity in the first 15 cycles to 1193.9 mA h g−1, the capacity drop accelerates afterwards and a capacity of 187 mA h g−1 can be measured in the 50th cycle (Fig. 6a). The cyclic performance of the composite C-2 is again inferior to that of C-1. The electrode demonstrates a steeper decline in capacity (Fig. 6b), and the discharge capacities measured in the first, second, tenth and 50th cycles are 1427, 1321, 991 and 119 mA h g−1. The initial Coulombic efficiency was 89.9%. The high Coulombic efficiency emphasises that, in principle, the studied phosphorus–carbon composites may be highly reversible sodium anodes if the deficiencies in their cyclic performance are addressed.
The charge–discharge curves of the composites C-1 and C-2 are shown in Fig. 6c and d. The first discharge curves of the composites are different from the subsequent ones and have an irreversible hump at about 1.1–0.65 and 0.95–0.65 V vs. Na/Na+, for the composites C-1 and C-2, respectively. The second and subsequent discharge curves of the composites were different to the first discharge. There are three voltage regions in the corresponding discharge cycle (i) a sharp slope down to 0.5 V vs. Na/Na+, (ii) a sloping plateau (or, possibly, a series of plateaus) in the range of 0.5–0.15 V vs. (Na/Na+), and (iii) a minor plateau at around 0.07–0.11 V vs. Na/Na+, which disappears after a few cycles. Most of sodium release takes place between 0.4–0.8 V vs. Na/Na+. The observed behaviour of the charge–discharge curves is similar to that observed elsewhere.18,19 After comparing the exact behaviour of the composites C-1 and C-2, we can also note the appearance of a small plateau, which disappears after a few cycles, at about 0.6 V vs. Na/Na+ during charging of the half cell with the composite C-1.
Literature data on the performance on phosphorus–carbon composite electrodes are presented in Table 2. Promising performance of phosphorus–carbon nanocomposites has been previously highlighted by Kim et al.18 and Qian et al.19 The former report demonstrates the electrochemical performance at a slightly elevated temperature of 30 °C and relatively stable cyclability (with only 7% of capacity drop) is shown for 30 cycles. It is not clear if the performance remains stable after 30 cycles in this report. In the latter report,19 the cyclic performance has been evaluated for 60 cycles and, although stable for the first 35 cycles, the capacity has been found to decline dramatically between 35th and 60th cycles. These authors have also reported that the addition of 10% of fluoroethylene carbonate (FEC) to the electrolyte is capable of improving the cyclic performance, and electrochemical performance with slow continuous decline in capacity for 140 cycles has been demonstrated. Similar observation about the role of FEC has been reported by Yabuuchi et al.,21 suggesting that the addition of FEC improves electrode reversibility. Declining cyclic performance has been reported by Li et al.20 In their work, the reversible capacity has been shown to decline 23.4% after only 10 cycles but the composite was prepared by simple grinding of red phosphorus and carbon nanotubes by hand. Our results indicate that the composite C-1 is capable of sustaining high capacity for the first 15 cycles, with accelerating decline afterwards (the electrolyte with 2% FEC in it was used). It seems to be generally consistent with other reports, where high capacity could be sustained for a number of cycles and accelerated degradation was observed afterwards.
| Sample | Active materials loading, mg cm−2 | Initial discharge/charge capacity, mA h g−1 | Cyclic performance | Reference |
|---|---|---|---|---|
| a Capacity is calculated per total weight of the phosphorus–carbon composite. b All capacity is assigned to the phosphorus component, the capacity of carbon components is neglected as minor contribution. | ||||
| C-1 | 0.92–1.05 | 1530/1322a | Slowly declining in the first 15 cycles and faster afterward. Capacity of 187 mA h g−1 in the 50th cycle | This work |
| C-2 | 0.92–1.05 | 1427/1283a | Declining. Capacity of 119 mA h g−1 in the 50th cycles | This work |
| Amorphous red phosphorus–carbon composite | 1.4–2.1 | 2223/1890b | Minor decline. 93% of capacity is retained after 30 cycles | 18 |
| Amorphous carbon–phosphorus composite | 3 | 2015/1764b | Stable cyclic performance for 35 cycles with accelerating decline afterwards. Monotonous slow decline in the electrolyte with added FEC | 19 |
| Red phosphorus–carbon nanotube composite | Not reported | 2210/1675b | Declining. 76.6% Of capacity is retained after 10 cycles | 20 |
| Red phosphorus–acetylene black mixture | 0.4–0.46 | Reversible capacity of about 2150b | Declining. Capacity of about 800 remains after 10 cycles | 21 |
While discussing the performance of phosphorus–carbon composites in sodium half-cells, it is important to point out that various researchers use different electrolytes (salts and solvents) for testing as there is still no commonly accepted electrolyte for this new type of batteries. We used 1 M NaClO4 in propylene carbonate (PC) with 2% FEC in this work. Similar electrolyte was used by Yabuuchi et al.21 A combination of ethylene carbonate (EC) and diethyl carbonate (DEC) as a solvent with either NaPF6 of NaClO4 salt and with or without FEC was used by Li et al.,20 Kim et al.18 and Qian et al.19
Another important variable that affects the cyclic performance in both lithium and sodium cells is obviously the choice of a binder used in the electrodes. Polyvinylidene fluoride (PVDF),5,13,21 (sodium) carboxymethyl cellulose (CMC),4,8,9,19 polyacrylic acid (PAA),18 polyacrylonitrile11 and sodium polyacrylate (PANa)21 were used in phosphorus–carbon composite electrodes in lithium and sodium cells. CMC was used as a binder in the present work. Future systematic study is required to understand the most suitable binder for this type of electrode material, the available information is not adequate to choose the optimal binder reliably. The general view is that the conventional PVDF is a poor choice of a binder for phosphorus-based electrodes and gives inferior performance. For example, an electrode with PANa binder has been shown to provide a much better performance than that of the electrode with PVDF binder in sodium cells in ref. 21. Intriguingly, one of the best electrochemical performances in lithium cells13 was claimed in a study using PVDF as a binder.
Electrochemical performance in the restricted potential windows vs. Li/Li+ and Na/Na+
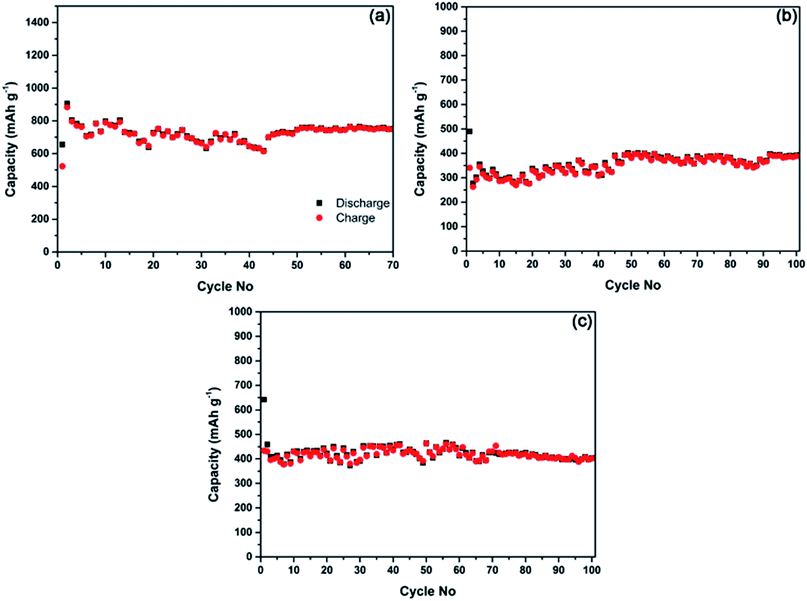
It is commonly accepted that the deteriorating cyclic performance observed within the potential window of 2.0–0.01 V vs. Li/Li+ or Na/Na+ (Fig. 5 and 6) is likely to originate from significant volume changes during the lithium and sodium alloying and de-alloying processes in the phosphorus component.5,8,19,21 For example, volume change of almost 300% (ref. 21) is expected in phosphorus in the course of its reaction with sodium. The dramatic volume change may impact the integrity of the electrodes during the repetitive cycling. Park and Sohn5 have previously pointed out that a stable cyclic behaviour in electrodes based on black phosphorus can be achieved in a lithium half-cell if the operating potential window is restricted (to 2.0–0.78 V vs. Li/Li+ in their case). If the operating potential is restricted to 2.0–0.78 V vs. Li/Li+, black phosphorus transforms reversibly into the LiP phase, and the associated volume change is significantly reduced, leading to a stable capacity of the electrode.5 We have attempted to re-check these finding for the lithium cells and evaluate if similar stabilisation of capacity may happen in the case of sodium half-cells.Fig. 7a shows the cycling stability of the composite C-1 in the potential window of 2.0–0.67 V vs. Li/Li+ in a lithium half-cell. Relatively stable capacity of slightly above 700 mA h g−1 can be observed. Some variations in the capacity visible in the graphs in Fig. 7 are due to the temperature variations in our laboratory over the course of an Australian winter. It can be concluded from the measured data that, in line with earlier findings by Park and Sohn5 stable capacity can be achieved in black phosphorus–carbon composites in a restricted potential window in lithium half-cells. The measured capacity in this study was somewhat higher than that in the previous work (∼600 mA h g−1)5 because of a lower cut-off potential used in the present work.
Our measurements indicate (Fig. 7b and c), that similar stable cyclic behaviour can be achieved in sodium half-cells if the potential window is restricted to 2.0–0.33 V vs. Na/Na+. Indeed, both composite C-1 (Fig. 7b) and composite C-2 (Fig. 7c) are able to demonstrate rather stable capacity of about 400 mA h g−1. The cut-off potential used for sodium cells is lower than that for lithium half-cells as the electrochemical reactivity of phosphorus-based electrodes with sodium happens at lower potentials. To sum up, phosphorus–carbon electrodes were able to deliver stable capacities (approximately 700 and 400 mA h g−1) in lithium and sodium half-cells in restricted potential windows.
Insights into the charge storage and failure mechanisms
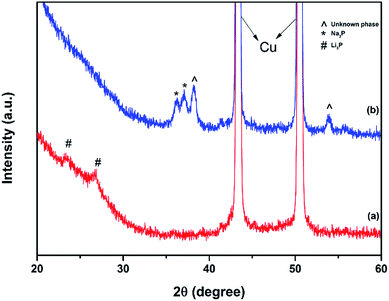
In order to investigate the charge storage mechanisms, ex situ XRD measurements were conducted on the C-1 composite electrodes extracted from lithium or sodium half-cells after their first discharge to 0.01 V vs. Li/Li+ or Na/Na+. Fig. 8a shows that Li3P phase forms after the first discharge of the C-1 electrode in a lithium-cell. There are no peaks of black P observed in Fig. 8a, suggesting that almost all the phosphorus in the electrode reacts with lithium to yield Li3P. Such an electrochemical reaction agrees well with previous reports5,7,10 on the use of black phosphorus in Li-ion systems, and the charge is suggested to happen predominantly via a reversible phase change of P to Li3P and back. In contrast, the XRD pattern of the C-1 electrode after the discharge in a sodium half-cell indicates that two phases are present in the electrode (Fig. 8b). One phase corresponds to Na3P and the second phase is unidentified. The authors were not able to match it with a standard powder diffraction record, possibly due to the limited available diffraction data on sodium–phosphorus compounds.The presence of two phases in the XRD pattern is consistent with the fact that the initial capacity of the C-1 electrode in a sodium half-cell was well below the expected value for the electrode. Indeed, based on the assumption of the reversible transformation between P and Na3P and the expectation of the capacity of carbon component of about 100 mA h g−1 (measured independently), the expected capacity of the C-1 electrode in a sodium half-cell was 1847 mA h g−1. However, the first discharge capacity of the cell was only 1530 mA h g−1. We estimate that not more than 2.4 sodium ions per one phosphorus atom (instead of 3 sodium ions) got incorporated into the electrode during the first discharge of the half-cell. Interestingly, our results with electrodes incorporating black phosphorus are somewhat different from those by Yabuuchi et al.,21 who have observed a single Na3P phase forming in amorphous phosphorus–carbon electrodes by synchrotron XRD. Their experiment was, however, conducted with thinner electrodes. Also, differences between the reaction mechanisms of amorphous phosphorus and black orthorhombic phosphorus are possible. Kim et al. have also presented an ex situ XRD pattern of a discharged electrode.18 Two features were resolved in the range of 35–38° in the pattern (Fig. 3b in ref. 18) and were assigned to be peaks of Na3P. We note however, that the right-hand side peak is noticeably shifted from the expected position of Na3P while the left-hand side feature is unusually broad. It is, in our view, possible that the two peaks of Na3P were not resolved in their experiment and were recorded as one broader feature. Consequently, the right-hand side peak may belong to the same unexpected phase we observe at about 38° (Fig. 8b, this work).
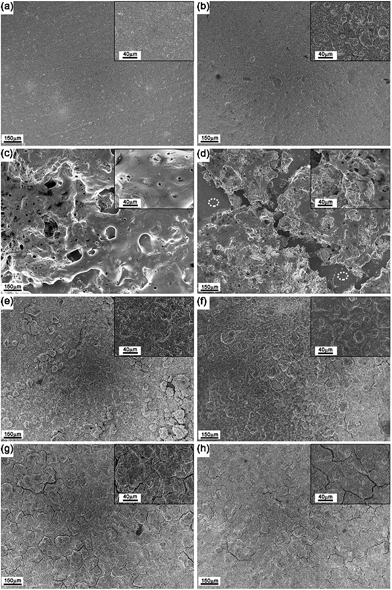
Fig. 9 depicts SEM images of the as-prepared C-1 and C-2 electrodes as well as SEM images of the electrodes cycled in lithium and sodium half-cells. As-prepared electrodes C-1 and C-2 are shown in Fig. 9a and b. There are no visible cracks on the surface of both electrodes. The electrodes cycled within the potential window of 2.0–0.01 V vs. Li/Li+ for a large number of cycles (Fig. 9c and d) are obviously damaged, displaying signs of deformation and disintegration, accompanied by delamination from the current collector. The cycled electrodes are also covered by a kind of film (this is particularly obvious in Fig. 9c), which we assign to the solid electrolyte interface or polymeric layers formed through the polymerisation of the electrolyte solvents. Fig. 9d also directly shows areas with the exposed copper current collector (marked by placing white elliptical markers on the corresponding areas) due to the delamination of the electrode's active layer. Similar electrode evolution after significant cycling in the broad potential window (2.0–0.01 V vs. Na/Na+) was detected for the electrodes extracted from sodium half-cells. The performance of the electrodes degrades gradually due to their mechanical disintegration and, possibly, the insulating nature of the organic layers that build up on the electrode (contribution from such a mechanism is widely suggested for the Si anodes for Li-ion batteries).
Fig. 9e and f shows the SEM images of the C-1 and C-2 electrodes cycled within a restricted potential window of 2.0–0.67 V vs. Li/Li+. The surfaces of the electrodes retain their shapes and look similar to the surfaces of the as-prepared electrode with the exception of the some minor cracks and an increased roughness of the surfaces. The C-1 and C-2 electrodes cycled in sodium half-cell within a potential window of 2.0–0.33 V vs. Na/Na+ display similar appearance (Fig. 9g and h).
The major difference with the lithium cells is more pronounced cracking in the electrode, possibly due to a larger expansion of the film upon sodium insertion. Another interesting observation is a reduced formation of gel-like polymeric layers on the electrodes in sodium cells, which can be correlated with a different solvent (PC) and the presence of FEC as a stabilising additive. Despite some cracking, the electrode films retain good overall stability. We suggest that, similarly to the reactivity with lithium, the volume change in the electrode is reduced when the bottom cut-off potential is restricted to 0.33 vs. Na/Na+ in sodium cells, leading to an improved stability of the electrode and attractive cyclic stability demonstrated in Fig. 7.
Conclusions
In summary, nanocomposites of black (orthorhombic) phosphorus with carbon have been evaluated in this report. It is found that, based on the use of a particular ball milling unit, composites with either nanoparticles of black phosphorus or well-dispersed phosphorus in a significantly disordered state can be manufactured. The composites have been subsequently assessed in both lithium and sodium electrochemical half-cells. It is found that the composites can display impressive initial capacities at the level of approximately 1700 and 1300 mA h g−1 (per total weights of the composites) for lithium and sodium cells, respectively, and the capacity gradually deteriorates when the cycling is performed within potential windows of 2.0–0.01 V vs. Li/Li+ or Na/Na+. The composite with crystalline nanoparticles of black P displays a better cyclic stability. Attractive stable cyclic performances at the level of 700 (lithium cells) and 350–400 mA h g−1 (sodium cells) can be observed if the potential windows are restricted to 2.0–0.67 vs. Li/Li+ and 2.0–0.33 V vs. Na/Na+. Ex situ XRD and SEM analyses have been performed to provide insights into the charge storage and failure mechanisms of electrodes. The XRD studies demonstrate that the redox chemistry of phosphorus in lithium half-cells is based on the reversible transformation to the Li3P phase while the transformation to Na3P phase in sodium half-cells is incomplete, leading to a smaller than expected practical capacity observed in the experimental tests. The post-cycling SEM studies reveal that electrodes gradually disintegrate and delaminate from current collectors when the electrochemical testing is done within larger potential windows of 2.0–0.01 V vs. Li/Li+ or Na/Na+. Such an effect is absent for the restricted potential windows of 2.0–0.67 vs. Li/Li+ and 2.0–0.33 V vs. Na/Na+, leading to stable cyclic performances for all tested electrodes in these restricted potential windows.Acknowledgements
Financial support from Central Research Grants Scheme of Deakin University and a Discovery grant of the Australian Research Council is acknowledged. The Australian Research Council is also acknowledged for funding Deakin University's Magnetic Resonance Facility, JEOL JEM-2100F transmission electron microscope and combined FTIR/Raman microspectroscopic instrument through LIEF grants LE110100141, LE100100195 and LE120100166. The authors thank Timcal Ltd. for providing a sample of Super P Li™ carbon black and acknowledge the use of facilities in the Victorian Node of the Australian National Fabrication Facility (ANFF).Notes and references
- Chemistry of the Elements, ed. N. N. Greenwood and A. Earnshaw, Butterworth Heinemann, 1997 Search PubMed.
- R. Hultgren, N. S. Gingrich and B. E. Warren, J. Chem. Phys., 1935, 3, 351 CrossRef CAS PubMed.
- C.-M. Park, J.-H. Kim, H. Kim and H.-J. Sohn, Chem. Soc. Rev., 2010, 39, 3115 RSC.
- C. Marino, A. Debenedetti, B. Fraisse, F. Favier and L. Monconduit, Electrochem. Commun., 2011, 13, 346 CrossRef CAS PubMed.
- C. M. Park and H. J. Sohn, Adv. Mater., 2007, 19, 2465 CrossRef CAS.
- M. C. Stan, J. v. Zamory, S. Passerini, T. Nilges and M. Winter, J. Mater. Chem. A, 2013, 1, 5293 CAS.
- L.-Q. Sun, M.-J. Li, K. Sun, S.-H. Yu, R.-S. Wang and H.-M. Xie, J. Phys. Chem. C, 2012, 116, 14772 CAS.
- J. Qian, D. Qiao, X. Ai, Y. Cao and H. Yang, Chem. Commun., 2012, 48, 8931 RSC.
- C. Marino, L. Boulet, P. Gaveau, B. Fraisse and L. Monconduit, J. Mater. Chem., 2012, 22, 22713 RSC.
- M. Nagao, A. Hayashi and M. Tatsumisago, J. Power Sources, 2011, 196, 6902 CrossRef CAS PubMed.
- L. Wang, X. He, J. Li, W. Sun, J. Gao, J. Guo and C. Jiang, Angew. Chem., Int. Ed., 2012, 51, 9034 CrossRef CAS PubMed.
- W.-J. Zhang, J. Power Sources, 2011, 196, 13 CrossRef CAS PubMed.
- J. Sun, G. Zheng, H.-W. Lee, N. Liu, H. Wang, H. Yao, W. Yang and Y. Cui, Nano Lett., 2014, 14, 4573 CrossRef CAS PubMed.
- V. L. Chevrier and G. Ceder, J. Electrochem. Soc., 2011, 158, A1011 CrossRef CAS PubMed.
- Y. Xu, Y. Zhu, Y. Liu and C. Wang, Adv. Energy Mater., 2013, 3, 128 CrossRef CAS.
- Y. Xu, J. Guo and C. Wang, J. Mater. Chem., 2012, 22, 9562 RSC.
- A. Darwiche, C. Marino, M. Sougrati, B. Fraisse, L. Stievano and L. Monconduit, J. Am. Chem. Soc., 2012, 134, 20805 CrossRef CAS PubMed.
- Y. Kim, Y. Park, A. Choi, N.-S. Choi, J. Kim, J. Lee, J. H. Ryu, S. M. Oh and K. T. Lee, Adv. Mater., 2013, 25, 3045 CrossRef CAS PubMed.
- J. Qian, X. Wu, Y. Cao, X. Ai and H. Yang, Angew. Chem., Int. Ed., 2013, 52, 4633 CrossRef CAS PubMed.
- W.-J. Li, S.-L. Chou, J.-Z. Wang, H.-K. Liu and S.-X. Dou, Nano Lett., 2013, 13, 5480 CrossRef CAS PubMed.
- N. Yabuuchi, Y. Matsuura, T. Ishikawa, S. Kuze, J.-Y. Son, Y.-T. Cui, H. Oji and S. Komaba, ChemElectroChem, 2014, 1, 580 CrossRef CAS.
- A. Calka and A. P. Radlinski, Mater. Sci. Eng., A, 1991, 134, 1350 CrossRef.
- T. Ramireddy, M. M. Rahman, T. Xing, Y. Chen and A. M. Glushenkov, J. Mater. Chem. A, 2014, 2, 4282 CAS.
- S. Reich and C. Thomsen, Philos. Trans. R. Soc., A, 2004, 362, 2271 CrossRef CAS PubMed.
- T. Xing, L. H. Li, L. Hou, X. Hu, S. Zhou, R. Peter, M. Petravic and Y. Chen, Carbon, 2013, 57, 515 CrossRef CAS PubMed.
- A. C. Ferrari, Solid State Commun., 2007, 143, 47 CrossRef CAS PubMed.
- A. Bytchkov, F. Fayon, D. Massiot, L. Hennet and D. L. Price, Phys. Chem. Chem. Phys., 2010, 12, 1535 RSC.
- S. Lange, P. Schmidt and T. Nilges, Inorg. Chem., 2007, 46, 4028 CrossRef CAS PubMed.
| This journal is © The Royal Society of Chemistry 2015 |

