 Open Access Article
Stable TiO2–USY zeolite composite coatings for efficient adsorptive and photocatalytic elimination of geosmin from water
Lik H.
Wee†
*a,
Nikki
Janssens†
a,
Jeori
Vercammen
b,
Lorenzo
Tamaraschi
c,
Leen C. J.
Thomassen
c and
Johan A.
Martens
*a
aCentre for Surface Chemistry and Catalysis, KU Leuven, Kasteelpark Arenberg 23, B3001, Heverlee, Leuven, Belgium. E-mail: likhong.wee@biw.kuleuven.be; johan.martens@biw.kuleuven.be; Fax: +32 1632 1998; Tel: +32 1632 1637
bIS-X, Av. J. E. Lenoir 2, 1348, Louvain-la-Neuve, Belgium
cLab4U, Sustainable Chemical Process Technology TC, KU Leuven Campus, 3590, Diepenbeek, Belgium
First published on 27th November 2014
Abstract
Geosmin is an unpleasant tasting germacranoid sesquiterpene to which human taste buds are sensitive even at the parts per trillion (ppt) level. The elimination of this molecule from water is a great scientific challenge due to the extremely low concentration needing to be removed. In this paper, we report simple fabrication of stable titania (TiO2) and Y zeolite composite coatings via a layer-by-layer dip-coating approach for efficient adsorptive and photocatalytic elimination of geosmin up to 99% from 100 ppt geosmin aqueous solution within 120 minutes at 35 °C under UV light. Zeolite coatings are also found to be highly efficient for adsorptive elimination of geosmin at a minute concentration of 4 ppt, the typical concentration level found in aquaculture water. Geosmin concentrations in the ppt range were determined by the headspace solid phase microextraction (HS-SPME) technique in combination with gas chromatography-mass spectrometry (GC-MS). This study demonstrates the potential of a composite coating comprising zeolite Y for concentrating, and TiO2 photocatalyst for eliminating geosmin in drinking water production and aquaculture water purification.
Introduction
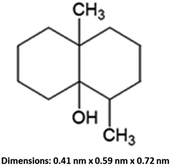
Geosmin (trans-1,10-dimethyl-trans-9-decalol, Fig. 1) is a bicyclic tertiary alcohol produced by cyanobacteria and actinomycetes in an aqueous environment.1,2 This earthy-muddy tasting and odorous compound occurs naturally. Although geosmin is non-toxic, its presence in drinking water causes an unpleasant taste and complaints from consumers even at very low concentration levels of ng L−1, which is equivalent to ppt and lower. Geosmin can be detected by human taste buds at an extremely low concentration level of <10 ppt. Utility water companies and beverage manufacturers must regulate the geosmin concentrations below 4 ppt.3 In aquaculture systems with water recirculation, geosmin and the related 2-methylisoborneol can be problematic due to microbial activity especially in the presence of abundant nutrients and warm temperature.4 Moreover, geosmin is a lipophilic organic compound that is readily incorporated into lipid-rich tissue of fish through their gills and orally which causes fish to be unmarketable, and its removal from the contaminated fish is difficult. In the United States catfish aquaculture industry, an estimated 30% of the profits are lost due to geosmin and other odorous and unpleasant-tasting compounds.5,6 Geosmin is of great concern to water purification plants, commercial fish farming and aquaculture industries. Elimination of geosmin from water is a scientific challenge due to its extremely low concentration.Several strategies to abate geosmin in water have already been attempted. Because of its extremely low concentration, conventional water treatment processes such as coagulation, sedimentation, filtration and chlorination are less effective.4,7 Moreover, the presence of other natural organic matter in water at higher concentration than geosmin will compete for adsorption sites which causes a decrease in geosmin adsorption capacity.7,8 Adsorption on activated carbon followed by oxidation with ozone, and hydrogen peroxide assisted photodegradation under UV light have been proven to be effective for geosmin removal. However, the addition of oxidants and application of ozone can result in the formation of hazardous by-products.8–11 Photodegradation of geosmin by anatase TiO2 particles under UV light radiation has been shown to be an effective means of geosmin removal at a high concentration level ranging from 0.2–5 ppb.12–16 Alternative electrochemical and biodegradation of geosmin have also been reported.17,18
Few studies were devoted to geosmin abatement at the relevant ppt concentration level.19,20 Activated carbon was reported to remove geosmin from drinking water via adsorption.21–23 Zeolites are popular selective adsorbents for the removal of heavy metals, radioactive elements, dyes and anions.24–29 Ultrastable Y zeolite (USY) has been demonstrated to be efficient in geosmin capturing at a concentration of 96 ppt. TiO2 is a well-known photoactive semiconductor material useful for photocatalytic oxidation of various environmental pollutants owing to their strong oxidizing power, nontoxicity and long-term photo-reactivity.30–32 Development of TiO2 photocatalysts anchored on supporting materials with large specific surface areas is of paramount significance for concentrating the diluted pollutant close to the vicinity of the active photoactive species, which would further enhance its photodegradation activity especially in the effort of geosmin photodegradation at the 100 ppt level.33–38 To the best of our knowledge, the use of TiO2–zeolite composite coatings on the wall of vessels for the removal of geosmin from aqueous solution has not been reported in the literature. Herein, we present a convenient layer-by-layer dip-coating fabrication of stable TiO2–USY zeolite composite coatings useful for adsorptive and photocatalytic removal of geosmin. These zeolite coatings approached the adsorption performance of the suspended zeolite particles at 100 ppt concentration. The zeolite coatings were found to be promising for industrially relevant applications in reducing an initial geosmin concentration of 4 ppt present in aquaculture water obtained from a fish farm down to a 1.2 ppt concentration level.
Experimental section
Chemicals and materials
Geosmin (100 μg mL−1 in methanol, Sigma-Aldrich) and USY zeolite (CBV 780 provided by International Zeolyst, BET surface area = 780 m2 g−1) were used. P25 TiO2 (Evonik), sodium chloride (Acros), biphenyl-d10 (ABCR), absolute ethanol (VWR), 0.1 M hydrogen chloride (37% VWR), and Pluronic triblock copolymer (P123 Aldrich) were used. Milli-Q water has a resistivity of 18.2 MΩ cm.Zeolite coatings on quartz tubes
Zeolite coatings were prepared via dip-coating using a suspension prepared as follows: 5 g of the selected zeolite powder were suspended in 100 mL ethanol and 2.5 mL of 0.1 M HCl and 5 g of P123 triblock copolymer were added. The suspension was vigorously stirred overnight at room temperature. Coatings were deposited on the outer surface of a quartz tube (13 mm outer diameter and 13 cm length) via layer-by-layer dip-coating. Prior to the coating, the quartz surface was cleaned using concentrated nitric acid. A beaker was filled with the coating suspension and the closed end of the quartz tube was immersed into the solution. After 5 minutes, the tube was removed and dried in an ambient atmosphere for an additional 5 minutes. The coatings were repeated 5 times in order to obtain smooth zeolite coatings on the outer surface of the quartz tube. The coated quartz tubes were heated at 60 °C overnight to evaporate solvents and subsequently calcined at 350 °C for 5 h at a heating rate of 1 °C min−1. TiO2 and zeolite Y composite coatings were prepared via a similar approach but with addition of 5 g of P25 TiO2.Characterization of USY zeolite coatings
The zeolite coatings were characterised using a scanning electron microscope (SEM, Philips XL-30 FEG equipped with a tungsten filament), a powder X-ray diffractometer (XRD, STOE StadiP diffractometer in high-throughput transmission mode employing Cu Kα1 radiation) and an attenuated total reflection-infrared spectrometer (ATR-IR, Bruker Bruker, Alpha) equipped with a platinum diamond.Adsorption of geosmin by zeolite powder and coatings
Photodegradation of geosmin
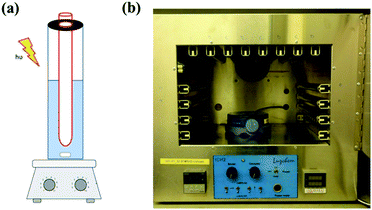
Photocatalytic experiments were carried out in a Luzchem photoreactor with a rotating sample carousel, equipped with 14 UV-A lamps (Hitachi, FL8BL-B, 8 W), 8 of which positioned at the top and 3 each sideway of the reactor compartment. In experiments with coatings, a coated quartz tube is submersed in 25 mL of aqueous solutions of 100 ppt geosmin in a wider closed quartz tube (50 mL volume, 24 mm diameter, 15 cm length). Agitation was carried out using a magnetic stir bar. The temperature in the reactor was controlled at 35 °C.HS-SPME-GC-MS analysis of geosmin
An aquaculture water sample was taken from a recirculating aquaculture system (RAS) of Jade Perch Scortum barcoo.39 In order to prevent evaporation, the sample was stored in a refrigerator at 4 °C prior to the experiment. The analysis of geosmin present in aquaculture water was accomplished by combining GC-MS with headspace solid-phase micro-extraction (HS-SPME). Geosmin analysis was performed on a TSQ 8000 triple quadrupole GC-MS (Thermo Scientific) coupled with a Trace 1300 GC (Thermo Scientific) and a Triplus RSH Autosampler (Thermo Scientific). All separations were performed using a 0.18 mm × 20 m XLB-GC-column (Restek) with a 0.18 μm thick stationary film, and injection was in splitless mode. Helium was used as a carrier gas at a flow of 1.5 mL min−1. Column temperature programming was as follows: 40 °C for 1 min, heating at 25 °C min−1 to 325 °C and 6 min at this temperature plateau. The geosmin analysis protocol was developed using commercially available geosmin solution diluted to a concentration of 1 μg L−1. 10 mL geosmin solution was introduced into a 22 mL capacity vial. After the addition of 3 g sodium chloride (NaCl) followed by 50 μL of the internal standard stock solution (500 ng L−1 biphenyl-d10), the vial was closed with a PTFE silicone rubber septum. NaCl was added to increase the ionic strength of the solution which leads to a lower solubility of geosmin and an improvement of the extraction efficiency. Before extraction, the vial was incubated in the external bath of the autosampler, where it was agitated and heated at 60 °C. After 30 minutes, the HSPME-syringe was pierced through the septum and the fibre inserted into the headspace of the vial, while the vial still was agitated and heated. The fibre was exposed for adsorption of the volatilized compound to be analysed. After 30 min, the fibre was retracted and immediately inserted into the inlet port of the GC-MS to allow desorption for 2 min. The injection port temperature was 250 °C. After sample desorption, the fibre was conditioned at 250 °C for another 15 min to remove residual geosmin. First a 50/30 μm DVB/CAR/PDMS (divinylbenzene/carboxen/polydimethylsiloxane) fibre (Supelco) was used. This DVB/CAR/PDMS fibre is widely applicable because of its wide polarity range and pore size. The fibre was conditioned according to the instructions (1 h at 270 °C). A major disadvantage was encountered using this fibre. A significant fraction of the geosmin sample estimated at ca. 10% remained adsorbed on the fibre, even after the conditioning, and this amount interfered with subsequent sample analyses. Therefore, a fibre coated with a polymer having lower affinity for geosmin was needed. A PDMS coated fibre was selected. Fibres coated with PDMS (100 μm fibre, Supelco) showed somewhat lower geosmin adsorption than DVB/CAR/PDMS but they were reliable and, importantly, no residual geosmin was detected after desorption in the GC injection port. For this reason the PDMS fibre has been used in the reported analyses. The geosmin elution time was 6.38 min. The most intense MS precursor signal of geosmin is at m/z 112. The product ions of precursor ion m/z 112 are those with m/z 83 and 97. The optimization of the collision energies was as follows. We selected the m/z 112 precursor ion, and the 2 product ions at m/z 97 and 83. The AutoSRM module defined the optimum energy. For both transitions (m/z 112 → 97 and m/z 112 → 83), 8 eV was the optimum energy. The internal biphenyl-d10 standard eluted after 6.19 min. The two most intense transitions of biphenyl-d10 were m/z 162 → 160.2 and m/z 164 → 162.2, the detection of which was optimized at 15 eV.Results and discussion
Characterization of zeolite and TiO2–USY zeolite coatings
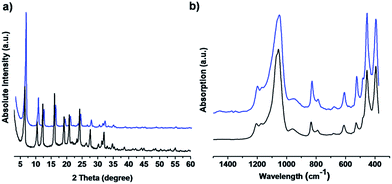
The USY zeolite powder was used for the fabrication of USY zeolite coating. It was combined with a P123 triblock copolymer and deposited via 5 consecutive layer-by-layer dip-coatings, and a final calcination at 350 °C. The USY zeolite coatings were characterized by XRD, ATR-IR and SEM, as presented in Fig. 2 and 3. The XRD patterns (Fig. 2a) of the USY zeolite film and parent powder confirmed that the zeolite structure was preserved. The vibration bands at 1055 cm−1 with a shoulder at 1068 cm−1 are attributed to the asymmetric stretching vibrations of T–O bonding (T = Si or Al).40 The ATR-IR spectra were characteristic of the faujasite zeolite. Vibration modes at 680 and 788 cm−1 are attributed to symmetric stretching vibrations of T–O bonding. The vibration bands at 611 cm−1 are associated with the double 6 ring (D6R) secondary structures that connect the sodalite cages.40 A TO4 bending vibration occurs at 455 cm−1 (Fig. 2b). The morphology of the USY zeolite coatings was investigated by SEM (Fig. 3). The top view SEM images showed that the zeolite coatings were homogeneous comprising densely packed USY zeolite crystals with particle sizes ranging between 500 and 1000 nm in diameter (Fig. 3a and b). Cross-sectional SEM images (Fig. 3c) revealed that the USY zeolite coating has a film thickness of about 14 μm.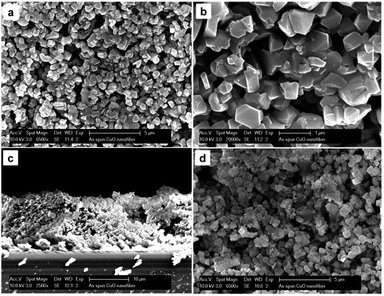 | ||
| Fig. 3 (a and b) Top and (c) cross-sectional view SEM images of USY zeolite coatings. (d) Top view SEM image of USY zeolite coating after the geosmin adsorption test revealing robustness. | ||
We further attempted the layer-by-layer dip-coating method for the fabrication of TiO2 and zeolite Y composite coatings. A similar method to that used for zeolite Y coatings was applied but with addition of 50 wt% P25 TiO2 into the suspension. According to SEM imaging, continuous and homogeneous TiO2–USY zeolite composite coatings were obtained as shown in Fig. 4 (left). At higher magnification as depicted in Fig. 4 (right), TiO2 nanoparticles with sizes ranging from 20–40 nm in diameter were uniformly distributed in the matrix and also on the surface of zeolite Y crystals. The XRD patterns of the scratched TiO2 and zeolite Y composites revealed the presence of the anatase phase as indicated by the peaks at 2θ = 25.3°, 37.7°, 48°, 54.8°, and 62.5° (Fig. 5).41 A relatively small quantity of rutile phase ca. 2.2% was observed as indicated by the peaks at 2θ = 27.4° and 53.8° (Fig. 5).42
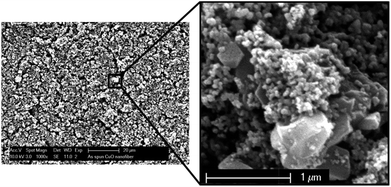 | ||
| Fig. 4 SEM images of TiO2–USY zeolite composite coating viewed at low (left) and higher (right) magnifications. | ||
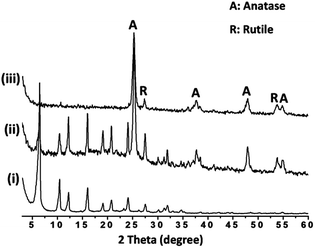 | ||
| Fig. 5 XRD patterns of (i) scratched zeolite Y coating, (ii) scratched TiO2–USY zeolite composite coating and (iii) TiO2 powder. | ||
HS-SPME-GC-MS analysis of geosmin
Research on geosmin elimination at the ppt concentration level is very demanding and requires very sensitive analytical equipment.43,44 HS-SPME-GC-MS was used in this study for the measurement of geosmin at very low concentration. Solid-phase micro-extraction is a simple and inexpensive solvent free extraction technique. This technique uses a fused silica fiber coated with a polymer extracting phase which is introduced into the head-space above the liquid sample. Volatile organic compounds are extracted onto the fiber and then transferred to a GC, where the volatile organics are thermally desorbed in the hot injection port. Geosmin analysis by HS-SPME-GC-MS was validated at 10 concentration levels, from 1 ppt to 1 ppb. The geosmin calibration curve showed a linear response with a correlation coefficient R2 = 0.998 (Fig. 6). SPME provides a reliable geosmin detection, even at the ppt concentration level. The standard deviation (RSD) of geosmin determination at 1 ppt showed variable RSD values of 1.7–6.9% (n = 3 and n = 4) for different working days. These variability precision ranges were found to be similar to previously reported studies.45 The lowest geosmin concentration determined was 0.1 ppt.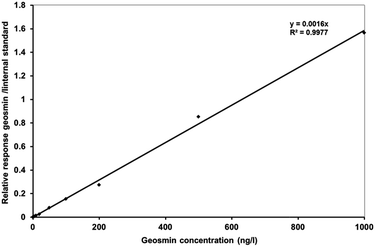 | ||
| Fig. 6 Relative response of geosmin to internal standard (biphenyl-d10) versus geosmin concentrations obtained from the HS-SPME-GC-MS analysis. | ||
Adsorptive removal of geosmin by zeolite coatings
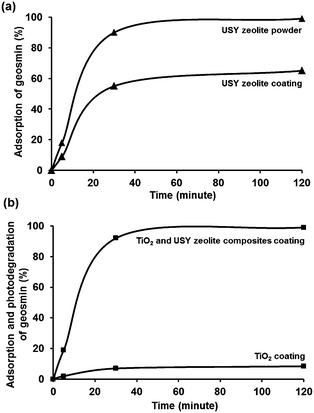
The adsorption performance of USY zeolite powder was evaluated using 100 ppt aqueous geosmin concentration at 35 °C (Fig. 7a). Using 30 mg of suspended zeolite powder, 90% of the dissolved geosmin was adsorbed after 30 minutes, and 99% after 2 h in full agreement with the excellent geosmin adsorption properties of USY zeolite powder reported in the literature.20 The adsorbed amount corresponded to 50 pggeosmin/mgzeolite, far below the saturation capacity, which for a pore volume of 450 μL g−1 should be around 450 μg mg−1 based on the pore volume and density of liquid geosmin. USY zeolite contains micropores of 1.2 nm wide interconnected through 0.74 nm wide pore windows. Its internal channels run in three directions forming a large cavity at the intersection of the channels. It contains mesopores of various dimensions as a consequence of the ultrastabilization process. The SiO2/Al2O3 molar ratio of the zeolite is 80. The polarity of zeolites is dependent on the SiO2/Al2O3 ratio. Al atoms introduce cation exchange capacity and polarity. The higher this ratio, the more apolar the zeolite is. Considering that geosmin is hydrocarbon-like and apolar (Fig. 1), the apolar USY zeolites showed excellent geosmin adsorption properties.For many applications, the use of functional nanopowders is less convenient because of the involvement of separation/filtration procedures. Particulate suspensions are less suitable for continuous processes. Thus, the development of stable zeolite coating is of great significance avoiding the disadvantages of dealing with a suspension of fine particles.46–48 In a similar adsorption experiment using USY zeolite coating (6.0 mg), 55% of geosmin was adsorbed after 30 minutes, and adsorption increased to 65% after 2 h. This rate of geosmin adsorption was slower than on USY zeolite powder, on which after 2 h already 99% adsorption was reached (Fig. 7a). In the experiment with coating, the quantity of the zeolite was 6 mg, and in the experiment with powder it was 30 mg. This difference in zeolite quantity is not expected to change the adsorption capacity in view of experiments in the literature showing quantitative adsorption of geosmin over a much wider range of USY adsorbent concentrations.20 The different behavior of the film and powder therefore could be due to diffusional limitation at the coating–water interface.49 The final loading corresponded to 244 pggeosmin/mgzeolite, which is only a minute fraction of the estimated adsorption capacity of the zeolite. The stability of the USY zeolite coating was confirmed by the mass balance of the zeolite layer before and after adsorption testing which revealed no loss of zeolite. SEM imaging of the zeolite coatings before and after geosmin adsorption revealed no signs of film detachment (Fig. 3d). The coatings could be reused 3 times and showed very similar geosmin adsorption behavior.
The promising USY zeolite coatings prompted further investigation for the removal of geosmin present in aquaculture water. A contaminated water sample was obtained from a Jade Perch recirculating aquaculture system (RAS). The determined initial geosmin concentration in the aquaculture water was 4 ppt according to HS-SPME-GE-MS analysis. The USY zeolite coating lowered the geosmin concentration from 4 ppt down to 1.2 ppt after 2 h. This practical experiment revealed an eliminative adsorption by ca. 70%, similar to the experiment with the film in commercial geosmin solution (Fig. 7a). The capability of the USY zeolite coatings to adsorb geosmin at extremely low concentration under conditions relevant to practical applications is promising and the combination with photocatalytic elimination is an attractive idea. Aquaculture water contains natural organic matter. The competitive adverse effect of natural organic matter on the adsorption capacity of the USY zeolite to geosmin is a potential problem. A submicron-sized active carbon material does not discriminate. The characteristics of the competing natural organic matter and the competition with geosmin have been previously studied and reported by Matsushita and co-workers.23 The results suggest that the natural organic matter with a large molecular weight of >2 kDa does not compete for the adsorption sites for geosmin as they are only adsorbed onto the external surfaces rather than the inner region of adsorbent particles such as zeolites.23
Adsorption and photocatalytic elimination of geosmin by TiO2–USY zeolite composite coatings
The TiO2–USY zeolite composite coatings (6 mg of zeolite + 4 mg of TiO2) were investigated for photodegradation of geosmin under UV-A light performed in a photocatalytic reactor as demonstrated in Fig. 8. Samples were taken at the interval of 5, 30 and 120 min under UV light illumination. Monitoring of the geosmin elimination revealed that 99% of geosmin elimination was achieved after 2 h (Fig. 7b). To discriminate geosmin adsorption from photodegradation, the suspension was magnetically stirred for 2 h in the dark to achieve adsorption/desorption equilibrium. Maximum adsorption of geosmin was limited to ca. 65% which confirmed that 34% of geosmin was photodegraded. It should be mentioned that pure TiO2 coatings (4 mg) only showed photodegradation of geosmin up to 8.4% after 2 h under similar experimental conditions as shown in Fig. 7b. The robustness of the composite coatings was confirmed through three consecutive reuses. The geosmin elimination performance was maintained. The removal of geosmin in the third reuse amounted to 97.5%. The results showed the advantages of adsorption and photodegradation synergism between zeolite and TiO2. The photocatalytic degradation rate depends greatly on the adsorption behavior of the zeolite to geosmin and TiO2 photocatalyst. The absorbed diluted geosmin molecules next to the TiO2 nanoparticles significantly enhanced the photocatalytic activity. Fixation of TiO2 onto stable zeolite support is essential in view of future practical applications in environmental remediation.Conclusions
In conclusion, we demonstrated facile preparation of stable TiO2–USY zeolite composite coatings via the layer-by-layer dip-coating method for efficient adsorptive and photocatalytic removal of geosmin at the ppt concentration level. Adsorption of the geosmin in the matrix bed of zeolite Y containing TiO2 nanoparticles further enhanced the efficiency of geosmin photodegradation. The zeolite coatings also show significant potential for removal of extremely low geosmin concentrations present in aquaculture water. The separation of the nanosized adsorbents/catalysts from solutions, one of the most important drawbacks of photocatalysis, could be overcome by the development of stable composite coatings as demonstrated in this study. In particular, the typical features of the coated adsorbent and photocatalyst composite on the vessel wall of the quartz tubes would make it a very suitable configuration and efficient photoreactor simply via insertion of a UV light tube for simultaneous adsorption and photodegradation of geosmin applicable for utility and drinking water production.Acknowledgements
This work was supported by the Flemish Industrial Research Fund (IOF). Lik H. Wee thanks the FWO-Vlaanderen for a postdoctoral research fellowship (12M1415N). JAM acknowledges the Flemish Government for long-term structural funding (Methusalem). Stijn Van Hoestenberghe is acknowledged for providing the aquaculture water. We are grateful to Dr Yanbo Li for ATR-IR spectroscopy.Notes and references
- C. S. Tucker, Rev. Fish. Sci., 2000, 8, 45–88 CrossRef CAS.
- G. Izaguirre, C. J. Hwang, S. W. Krasner and M. J. McGuire, Appl. Environ. Microbiol., 1982, 43, 708–714 CAS.
- R. Srinivasan and G. A. Sorial, J. Environ. Sci., 2011, 23, 1–13 CrossRef CAS.
- M. Antonopoulou, E. Evgenidou, D. Lambropoulou and I. Konstantinou, Water Res., 2014, 53, 215–234 CrossRef CAS PubMed.
- N. N. Gerber and H. A. Lechevalier, Appl. Microbiol., 1965, 13, 935–938 CAS.
- J. L. Smith, G. L. Boyer and P. V. Zimba, Aquacult, 2008, 280, 5–20 CrossRef CAS PubMed.
- D. Bruce, P. Westerhoff and A. Brawley-Chesworth, J. Water Supply: Res. Technol.--AQUA, 2002, 51, 183–197 CAS.
- M. R. Graham, R. S. Summer, M. R. Simpson and B. W. MacLeod, Water Res., 2000, 34, 2291–2300 CrossRef CAS.
- L. Meunier, S. Canonica and U. von Gunten, Water Res., 2006, 40, 1864–1876 CrossRef CAS PubMed.
- D. Cook, G. Newcombe and P. Sztajnbok, Water Res., 2001, 35, 1325–1333 CrossRef CAS.
- G. Chen, B. W. Dussert and I. H. Suffet, Water Res., 1997, 31, 1155–1163 CrossRef CAS.
- L. A. Lawton, P. K. J. Robertson, R. F. Robertson and F. G. Bruce, Appl. Catal., B, 2003, 44, 9–13 CrossRef CAS.
- E. E. Bamuza-Pemu and E. M. N. Chirwa, Water SA, 2012, 38, 689–695 CrossRef CAS.
- E. Bellu, L. A. Lawton and P. K. J. Robertson, J. Adv. Oxid. Technol., 2008, 11, 384–388 CAS.
- P. K. J. Robertso, D. W. Bahnemann, L. A. Lawton and E. Bellu, Appl. Catal., B, 2011, 108–109, 1–5 CrossRef PubMed.
- C. J. Pestana, P. K. J. Robertson, C. Edwards, W. Wilhelm, C. McKenzie and L. A. Lawton, Chem.–Eng. J., 2014, 235, 293–298 CrossRef CAS PubMed.
- Q. Xue, M. Lia, K. Shimizu, M. Utsumi, Z. Zhang, C. Feng, Y. Gao and N. Sugiur, Desalination, 2011, 265, 135–139 CrossRef CAS PubMed.
- B. Zhou, R. Yuan, C. Shi, L. Yu, J. Gu and C. Zhang, J. Environ. Sci., 2011, 23, 816–823 CrossRef CAS.
- C. Ng, J. N. Losso, W. E. Marshall and R. M. Rao, Bioresour. Technol., 2002, 84, 177–185 CrossRef CAS.
- J. Ellis and W. Korth, Water Res., 1993, 27, 535–539 CrossRef CAS.
- Y. Matsui, S. Nakao, T. Taniguchi and T. Matsushita, Water Res., 2013, 47, 2873–2880 CrossRef CAS PubMed.
- K. Zoschke, C. Engel, H. Börnick and E. Worch, Water Res., 2011, 45, 4544–4550 CrossRef CAS PubMed.
- Y. Matsui, S. Nakao, T. Yoshida, T. Taniguchi and T. Matsushita, Sep. Purif. Technol., 2013, 113, 75–82 CrossRef CAS PubMed.
- S. Babel and T. A. Kurniawan, J. Hazard. Mater., 2003, 97, 219–243 CrossRef CAS.
- M. Rafatullah, O. Sulaiman, R. Hashim and A. Ahmad, J. Hazard. Mater., 2010, 177, 70–80 CrossRef CAS PubMed.
- A. Sachse, A. Merceille, Y. Barré, A. Grandjean, F. Fajula and A. Galarneau, Microporous Mesoporous Mater., 2012, 164, 251–258 CrossRef CAS PubMed.
- L. Gómez-Hortigüela, J. Pérez-Pariente, R. García, Y. Chebude and S. Díaz, Sep. Purif. Technol., 2013, 120, 224–229 CrossRef PubMed.
- L. Tosheva and V. Valtchev, Chem. Mater., 2005, 17, 2494–2513 CrossRef CAS.
- V. Valtchev and L. Tosheva, Chem. Rev., 2013, 113, 6734–6760 CrossRef CAS PubMed.
- A. Fujishima and K. Honda, Nature, 1972, 238, 37–38 CrossRef CAS.
- B. Oregan and M. Grätzel, Nature, 1991, 353, 737–740 CrossRef CAS.
- M. Pelaez, N. T. Nolan, S. C. Pillai, M. K. Seery, P. Falaras, A. G. Kontos, P. S. M. Dunlop, J. W. J. Hamilton, J. A. Byrne, K. O'Shea, M. H. Entezari and D. D. Dionysiou, Appl. Catal., B, 2012, 125, 331–349 CrossRef CAS PubMed.
- Y. J. Acosta-Silva, R. Nava, V. Hernández-Morales, S. A. Macías-Sánchez, M. L. Gómez-Herrera and B. Pawelec, Appl. Catal., B, 2011, 110, 108–117 CrossRef CAS PubMed.
- M. N. Ghazzal, H. Kebaili, M. Joseph, D. P. Debecker, P. Eloy, J. De Coninck and E. M. Gaigneaux, Appl. Catal., B, 2012, 115–116, 276–284 CrossRef CAS PubMed.
- H. Hidaka, K. Ajisaka, S. Horikoshi, T. Oyama, J. Zhao and N. Serpone, Catal. Lett., 1999, 60, 95–98 CrossRef CAS.
- H. Yamashita, Y. Ichihashi, M. Harada, M. A. Fox and M. Anpo, J. Catal., 1996, 158, 97–101 CrossRef CAS.
- H. Yamashita, M. Honda, M. Harada, Y. Ichihashi, M. Anpo, T. Hirao, N. Itoh and N. Iwamoto, J. Phys. Chem. B, 1998, 102, 10707–10711 CrossRef CAS.
- H. Yamashita, S. Kawasaki, Y. Ichihashi, M. Harada, M. Takeuchi, M. Anpo, M. A. Fox, C. Louis and M. Che, J. Phys. Chem. B, 1998, 102, 5870–5875 CrossRef CAS.
- S. V. Hoestenberghe, I. Roelants, D. Vermeulen and B. M. Goddeeris, J. Agric. Sci. Technol. B, 2013, 3, 385–398 Search PubMed.
- B. A. Holmberg, H. Wang, J. M. Norbeck and Y. Yan, Microporous Mesoporous Mater., 2003, 59, 13–28 CrossRef CAS.
- H. Yamashita, M. Harada, A. Tanii, M. Honda, M. Takeuchi, Y. Ichihashi, M. Anpo, N. Iwamoto, N. Itoh and T. Hirao, Catal. Today, 2000, 63, 63–69 CrossRef CAS.
- J. Yan, G. Wu, N. Guan, L. Li, Z. Li and X. Cao, Phys. Chem. Chem. Phys., 2013, 15, 10978–10988 RSC.
- S. W. Lloyd, J. M. Lea, P. V. Zimba and C. C. Grimm, Water Res., 1998, 32, 2140–2146 CrossRef CAS.
- S. B. Watson, B. Brownlee, T. Satchwill and E. E. Hargesheimer, Water Res., 2000, 34, 2818–2828 CrossRef CAS.
- Y. H. Sung, T. Y. Li and S. D. Huang, Talanta, 2005, 65, 518–524 CrossRef CAS PubMed.
- A. K. Ray, Chem. Eng. Sci., 1999, 54, 3113–3125 CrossRef CAS.
- M. P. Pina, R. Mallada, M. Arruebo, M. Urbiztondo, N. Navascués, O. de la Iglesia and J. Santamaria, Microporous Mesoporous Mater., 2011, 144, 19–27 CrossRef CAS PubMed.
- J. Gascon, F. Kapteijn, B. Zornoza, V. Sebastián, C. Casado and J. Coronas, Chem. Mater., 2012, 24, 2829–2844 CrossRef CAS.
- A. K. Zander, J.-S. Chen and M. J. Semmens, Water Res., 1992, 26, 129–137 CrossRef CAS.
Footnote |
| † These authors contributed equally to this work. |
| This journal is © The Royal Society of Chemistry 2015 |

