 Open Access Article
Creative Commons Attribution 3.0 Unported Licence
1-Butanol absorption in poly(styrene-divinylbenzene) ion exchange resins for catalysis
M. A.
Pérez-Maciá
*a,
D.
Curcó
*a,
R.
Bringué
a,
M.
Iborra
a,
F.
Rodríguez-Ropero
b,
N. F. A.
van der Vegt
b and
Carlos
Aleman
*cd
aDepartament d'Enginyeria Química, Facultad de Química, Universitat de Barcelona, Martí i Franqués 1, Barcelona E-08028, Spain. E-mail: perez.macia@ub.edu; dcurco@ub.edu
bEduard-Zintl-Institut für Anorganische und Physikalische Chemie and Center of Smart Interfaces, Technische Universität Darmstadt, Alarich-Weiss-Straße 10, 64287, Darmstadt, Germany
cDepartament d'Enginyeria Química, E.T.S. d'Enginyers Industrials de Barcelona, Universitat Politécnica de Catalunya, Diagonal 647, Barcelona E-08028, Spain. E-mail: carlos.aleman@upc.edu
dCenter for Research in Nano-Engineering, Universitat Politécnica de Catalunya, Campus Sud, Edifici C', C/Pascual I Vila s/n, Barcelona E-08028, Spain
First published on 16th September 2015
Abstract
The swelling behaviour of poly(styrene-co-divinylbenzene), P(S-DVB), ion exchange resins in 1-butanol (BuOH) has been studied by means of atomistic classical molecular dynamics simulations (MD). The topological characteristics reported for the resin in the dry state, which exhibited complex internal loops (macropores), were considered for the starting models used to examine the swelling induced by BuOH contents ranging from 10% to 50% w/w. Experimental measurements using a laser diffraction particle size analyzer indicate that swelling causes a volume variation with respect to the dry resin of 21%. According to MD simulations, such a volume increment corresponds to a BuOH absorption of 31–32% w/w, which is in excellent agreement with the indirect experimental estimation (i.e. 31% w/w). Simulations reveal that, independently of the content of BuOH, the density of the swelled resin is higher than that of the dry resin, evidencing that the alcohol provokes important structural changes in the polymeric matrix. Thus, BuOH molecules cause a collapse of the resin macropores when the content of alcohol is ≤20% w/w. In contrast, when the concentration of BuOH is close to the experimental value (∼30% w/w), P(S-DVB) chains remain separated by pores faciliting the access of the reactants to the reaction centers. On the other hand, evaluation of both bonding and non-bonding interactions indicates that the mixing energy is the most important contribution to the absorption of BuOH into the P(S-DVB) resin. Overall, the results displayed in this work represent a starting point for the theoretical study of the catalytic conversion of BuOH into di-n-butyl ether in P(S-DVB) ion exchange resins using sophisticated electronic methods.
Introduction
Poly(styrene-co-divinylbenzene), P(S-DVB), ion exchange resins are used for a wide range of industrial processes, for example waste water treatments (i.e. removal of pollutants and ion exchange processes), hydrogen storage, hydrometallurgy, and separation of biomolecules.1–9 In addition, P(S-DVB) resins are also being utilized for important catalytic processes, as they offer potentially much higher capacity for the supported functionality than the conventional inorganic carriers.10–16 In most of these technological applications ion-exchange resins operate in a partially or entirely swollen state.The pore structure of catalytic P(S-DVB) resins (and consequently their catalytic performance, activity and selectivity) is greatly dependent upon the swelling characteristics of their polymeric network.17 Swelling creates free spaces within the resin and allows ready access and exploitation of the inner part of the network in chemical reactions. Thus, in order to rationalize the catalytic performance of ion exchange catalysts, it is essential to understand their swelling behaviour and structural properties in the reaction medium.
Several physico-chemical techniques have been used to characterize swollen polymers. A valuable review of these techniques was reported by Corain et al.17 Although experimental results have significantly improved the information about the character of the reaction environment inside swollen polymers, knowledge of microscopic details at the molecular level for ion exchange catalysts is still lacking. The aim of this work is to study the swelling behaviour of a sulfonated P(S-DVB) resin in 1-butanol (BuOH) by means of classical molecular dynamics (MD) simulations and offer a first contribution to the understanding of the molecular details of the structure of swollen P(S-DVB). It should be remarked that BuOH swells P(S-DVB) ion exchange resins and is a fundamental reactant for the synthesis of di-n-butyl ether, which has been identified as a candidate biofuel.18,19
Theoretical model: resin topology
Commercial Amberlyst 15®, a monosulfonated, highly crosslinked (19–20 DVB% w/w) macroreticular resin, was used as a reference to model P(S-DVB) (i.e. DVB content and functionalization capacity with sulfonic acid). The resin was represented considering an all-atom model constituting 2141 and 358 monomers of styrene and divinylbenzene, respectively.Almost all the styrene units (i.e. 2120 units) were functionalized with a sulfonic group located in the -meta or, preferentially, -para position of the aromatic ring since the ortho substitution is sterically hindered. The construction of the crosslinked network was reported in previous work.20 The polymer matrix presented a complex topology characterized by a very heterogeneous distribution of both the crosslinks and the length of polymer segments as well as by the existence of internal loops (i.e. closed polymer chains) of different sizes. Thus, in addition to “simple-crosslinks”, which consist of a monomer of DVB connecting two polymer chains, the selected model also contained:
– 14 “super-crosslinks”, which can be described as internal loops that appear when two or more simple-crosslinks give rise to a closed polymer chain;
– 2 “inter-crosslinks”, each one consisting of a DVB monomer connecting two polymer chains, one pertaining to the macromolecule and the other to its own periodic image.
It should be emphasized that such topological characteristics were found to be essential to reproduce satisfactorily the experimental morphological parameters (i.e. apparent density, porosity and pore volume) in the dry state.20
BuOH molecules were randomly introduced at sterically accessible positions of the equilibrated dry resin. Seven resin/solvent systems, which differ in the amount of BuOH (10%, 15%, 20%, 26%, 30%, 40% and 50% w/w), were considered for the simulations described in this work. It should be noted that the same snapshot of the dry resin was used for the construction of the seven resin/BuOH systems, independently of the amount of BuOH. Thus, after the generation of the system with the lowest amount of BuOH (i.e. 10% w/w), more alcohol molecules were inserted at sterically accessible positions until the amount desired for the second system (i.e. 20% w/w) was reached. This process was systematically repeated until the last system (i.e. that with 50% w/w BuOH) was constructed.
Computational methods
All Molecular Dynamic (MD) simulations were performed using the GROMACS 4.6.5 program.21–23 The energy was calculated using the following force-field expression: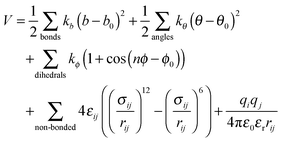 | (1) |
(1) The bond stretching term, represented by a harmonic potential, in which the stretching force constant (kb) and the distance between two bonded atoms and their equilibrium bond distance (b and b0, respectively) are included;
(2) The angle bending term, represented by a harmonic potential, including the bending force constant (kθ) and the angle between three consecutive atoms and their equilibrium value (θ and θ0, respectively);
(3) The torsional term, represented by a Fourier series expansion, containing a dihedral constant (kϕ) which sets the energy barrier for the rotation profile, the actual dihedral angle and the equilibrium one (ϕ and ϕ0, respectively) and the dihedral multiplicity, n;
(4) The van der Waals non-bonded term, a mathematical model following the Lenard-Jones potential that takes into account the attractive and repulsive forces between two atoms with rij being the distance between them, εij the depth of the potential well for the interaction of atoms i and j, and σij the distance where the Lennard-Jones potential is exactly zero;
(5) The electrostatic term described by a Coulombic potential, where qi and qj are the point charges of atoms i and j, respectively, ε0 is the electric constant and εr is the effective dielectric constant. All simulations were performed using εr = 1. Thus, the required dielectric of each system will be produced on its accord with both the resin and the alcohol that were explicitly described. Furthermore, the force field was parametrized considering such a value and, therefore, its alteration may seriously compromise, even invalidate, the model.
The Lennard-Jones parameters between pairs of different atoms were derived from the Lorentz-Berthelot mixing rules, in which εij values are based on the geometric mean of εi and εj and σij values are based on the arithmetic mean of σi and σj. For 1–4 interactions (those between atoms separated by three chemical bonds), the strength of the Lennard-Jones and electrostatic interactions were scaled down by a factor of 0.5 and 0.8333, respectively.
Force-field parameters were taken from the General Amber Force Field (GAFF)24 for both resin and 1-butanol (BuOH). Atomic charges for sulfonated P(S-DVB) resin were taken from our previous work.20 Atomic charges for BuOH were taken from a data base25 and scaled (c = 0.71) to reflect that the polarization in condensed media is smaller than that in the gas-phase.26,27
Before MD trajectories, the initial structures of the polymer network and absorbed BuOH were equilibrated using the following strategy. First, 10![[thin space (1/6-em)]](https://www.rsc.org/images/entities/char_2009.gif) 000 steps of energy minimization using the steepest descent algorithm were applied to relax conformational and structural tensions. Next, NVT-MD at 300 K was performed for all the microstructures for 500 ps. Afterwards, NPT-MD at 300 K and 1 atm was run for 500 ps. For the highest BuOH concentration it was necessary to integrate Newton's equation of motion using a numerical integration step of 0.5 fs for the first 10 ps. After this thermalization process, NPT-MD productive trajectories were run at 300 K and 1 atm for 10 ns. Fig. 1 shows the temporal evolution of the volume along the last 8 ns for the different calculated systems. As it can be seen, the volume, which increases with the amount of BuOH, remained stable at the equilibrium value during this period.
000 steps of energy minimization using the steepest descent algorithm were applied to relax conformational and structural tensions. Next, NVT-MD at 300 K was performed for all the microstructures for 500 ps. Afterwards, NPT-MD at 300 K and 1 atm was run for 500 ps. For the highest BuOH concentration it was necessary to integrate Newton's equation of motion using a numerical integration step of 0.5 fs for the first 10 ps. After this thermalization process, NPT-MD productive trajectories were run at 300 K and 1 atm for 10 ns. Fig. 1 shows the temporal evolution of the volume along the last 8 ns for the different calculated systems. As it can be seen, the volume, which increases with the amount of BuOH, remained stable at the equilibrium value during this period.
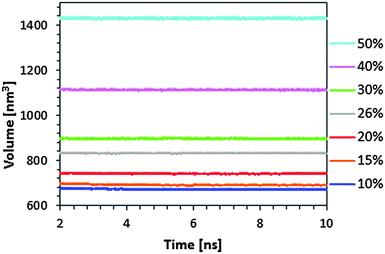 | ||
| Fig. 1 Temporal evolution of the volume of the simulation box during NPT-MD productive trajectory runs for seven resin/solvent systems calculated in this work (i.e. those with 10%, 15%, 20%, 26%, 30%, 40% and 50% w/w BuOH). The average volume of the dry resin is 759.55 nm3 (see ref. 20). | ||
In all MD simulations periodic boundary conditions were applied. Newton's equations of motion were integrated by the leap-frog algorithm using a numerical integration step of 1 fs, except in the case aforementioned. van der Waals interactions were computed using an atom pair distance cut-off of 14.0 Å. Beyond such a cut-off distance, electrostatic interactions were calculated by using the Particle Mesh Ewald method, with a point grid density of the reciprocal space of 1 Å.28,29 Temperature and pressure were controlled using a Nosé-Hoover thermostat30,31 (with a relaxation time of 0.5 ps) and a Parrinello-Rahman barostat32 (with an oscillation period of 1 ps), respectively.
Results and discussion
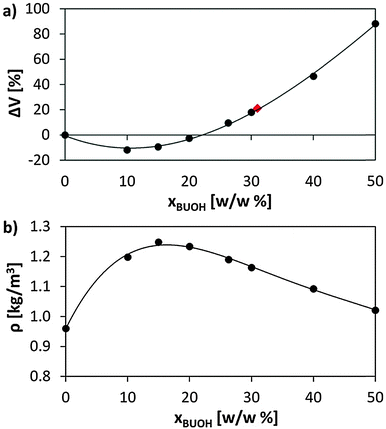
The swelling of Amberlyst 15 in BuOH was experimentally determined using a laser diffraction particle size analyser (Beckman Coulter, LS 13 320). Previously dried resin samples (110 °C at 10 mbar for 24 h) were placed in BuOH for 2 days to ensure that resins were completely swollen.Fig. 2a represents the volume variation (ΔV), calculated with respect to the dry resin volume, against the concentration of absorbed BuOH, as well as the experimentally determined volume increase of Amberlyst 15 swollen in BuOH, ΔV = 21.1%. Low concentrations of alcohol lead to resin shrinkage, the highest volume reduction corresponding to 10% w/w of BuOH (ΔV = −11.8%). After such a point, ΔV experiences a gradual increase, slight at the beginning and more pronounced from 20% w/w. The early shrinkage of the resin (added to the mass system increment) entails a significant increase of the density (Fig. 2b). However, for concentrations of BuOH higher than 20%, the important swelling experienced by the system results in a progressive reduction of the whole density.
The results shown in Fig. 2a indicate that the maximum amount of BuOH absorbed by the resin that causes a volume increase equivalent to that experimentally determined (ΔV = 21.1%) corresponds to a concentration of 31–32% w/w. This value matches that indirectly estimated (31% w/w) from experimental measurements (Table 1) of particle size in the dry state (dp,d) and swollen in BuOH (dp,s), porosity of the dry resin (θd) and resin skeletal density (ρs,). It should be mentioned that the direct experimental estimation of ΔV was not possible because of both the high hygroscopicity of P(S-DVB) and the apparition of a BuOH layer covering the surface of the sample.
| Property | Value |
|---|---|
| a Determined by laser diffraction. b Calculated as θd = Vg/(Vg + 1/ρs), where Vg is the pore volume per mass of resin determined by N2 adsorption at 77 K and P/P0 = 0.99 and ρs is the skeletal density. c Determined by helium displacement. | |
| d p,d [μm] | 650.1a |
| d p,s [μm] | 692.9a |
| θ d [%] | 31.72b |
| ρ s [g cm−3] | 1.416c |
In order to provide a rough thermodynamic description of the absorption of BuOH in the P(S-DVB) resin, expressed as
| Resin(dry) + nOH BuOH ⇆ Resin (χOH%), | (2) |
Thus, ΔE was estimated as indicated in eqn (3):
| ΔE = EResin(χOH%) − EResin(dry) − nOH·EBuOH | (3) |
Fig. 3 represents the variation of ΔE against the amount of absorbed BuOH. The minimum of the profile indicates the maximum amount of BuOH that the P(S-DVB) matrix can absorb. This equilibrium composition, which corresponds to a BuOH concentration of ∼34% w/w, agrees very well with the value derived from Fig. 2 (31–32%) and indirectly with the experimental value (31%). For higher concentrations of BuOH, ΔE increases due to the fact that the matrix is not able to accommodate all the alcohol molecules, forcing them to be closer (i.e. increasing the non-bonding contribution).
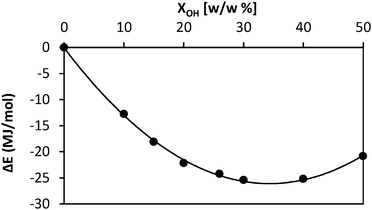 | ||
| Fig. 3 Variation of the energy change (ΔE) from the dried resin system to the resin/BuOH system against the concentration of absorbed alcohol. | ||
In order to examine at the molecular level the impact of BuOH on the structure of the P(S-DVB) network, the simulation box was divided into 1000 cells. The cell volume depended on the volume of the simulation box, which was derived from NPT MD simulation. Accordingly, the cell axis used for the different evaluated systems was:
Dry P(S-DVB) resin: 9.124 nm
P(S-DVB) + 10% BuOH: 8.751 nm
P(S-DVB) + 15% BuOH: 8.828 nm
P(S-DVB) + 20% BuOH: 9.044 nm
P(S-DVB) + 26.6%BuOH: 9.407 nm
P(S-DVB) + 30% BuOH: 9.641 nm
P(S-DVB) + 40% BuOH: 10.365 nm
P(S-DVB) + 50% BuOH: 11.267 nm
For each cell, the local apparent density of the resin (ρa) was calculated without considering BuOH molecules and, subsequently, cells were ranked following an increasing ρa criterion. Fig. 4a displays the average (among 100 snapshots) ρa value of the ranked cells for several resin/solvent systems with different amounts of BuOH.
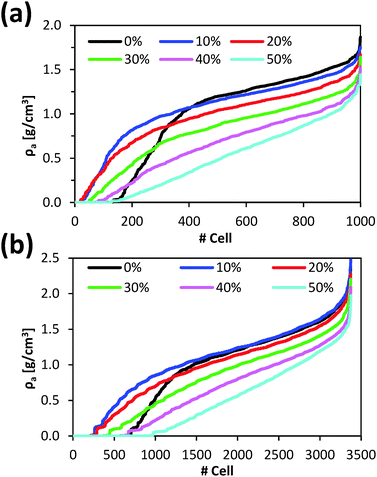 | ||
| Fig. 4 Local apparent density (ρa) for the (a) 1000 and (b) 3375 cells in which microstructures were divided. Cells were ranked following a growing local density order. | ||
Significant structural differences exist among the studied systems. Dry resin presents an important number of cells (>10%) with negligible ρa. This fact is clearly reflected in Fig. 5a, which represents the frequency histogram of ρa values. These void cells form the network of macropores characteristic of macroreticular resins. However, dry resin also presents a considerable number of cells with ρa ≥ 1.5 g cm−3 corresponding to a very dense polymer mass hardly accessible. These observations are consistent with the known structure of highly crosslinked macroreticular resins.33
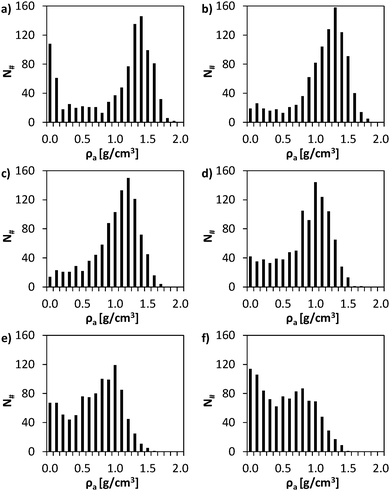 | ||
| Fig. 5 Frequency histograms for local apparent density (ρa) of: (a) 0%; (b) 10%; (c) 20; (d) 30%; (e) 40%; and (f) 50% w/w of absorbed BuOH. | ||
For systems with 10% and 20% of absorbed BuOH, the number of cells with negligible ρa remarkably decreases (Fig. 5b and c). This reduction is mainly attributed to the shrinkage of the P(S-DVB) matrix observed in Fig. 2a, indicating that 10% or 20% w/w of BuOH is not enough to fill the macropores. In these cases alcohol molecules exert an attractive effect on the polymer chains leading to the collapse of the matrix. Thus, the resin with a 10% w/w of absorbed BuOH is apparently denser than the dry resin (ρa = 1.054 and 0.961 g cm−3, respectively). However, if the local structure is taken into account, it can be observed that the high-density resin zones (with ρa > 1.5 g cm−3) decrease with increasing amount of adsorbed BuOH. Therefore, small amounts of alcohol provoke the collapse of the macropores. Comparison between Fig. 5a–c indicates that the maximum frequency moves to less dense regions. For the dry resin the maximum frequency corresponds to ρa = 1.4 g cm−3 whereas for the systems with 10% and 20% w/w of BuOH the maximum frequencies correspond to ρa = 1.3 and 1.2 g cm−3, respectively.
For the system with an amount of absorbed BuOH close to the experimental value (30% w/w), the number of cells void of resin was higher than that corresponding to the systems with 10% and 20% w/w of BuOH. However, it was still lower than that corresponding to the dry resin. Most importantly, the number of cells with relatively low ρa values (< 1.0 g cm−3) increased whereas very dense zones (ρa≥ 1.5 g cm−3) were barely detected. These features indicate that a significant part of the matrix presents important spaces between polymer chains due to the presence of alcohol molecules, resulting in a more easily accessible catalyst.
Finally, the profiles gathered in Fig. 4a for the systems with 40% and 50% of BuOH show the practical disappearance of the slope change observed for other systems. In order to prove that such a variation is not an artefact caused by the dimensions of cells used to evaluate ρa, the calculation was repeated dividing the simulation box into 3375. Fig. 4b shows the average ρa value of the ranked cells following the same criterion as in Fig. 4a. As it can be seen, the resolution of the analysis provokes small variations in the profiles, even though main trends discussed above were maintained in all cases. These results corroborate the drastic increase in the porosity of the systems with 40% and 50% BuOH. This is clearly reflected in the corresponding frequency histograms (Fig. 5e and f). Thus, in those systems, a large number of BuOH molecules were entered at sterically accessible positions (without initially considering intermolecular interactions). Once relaxed, the excess of alcohol with respect to the equilibrium concentration provoked an over-swelling effect, resulting in a stretched matrix.
On the other hand, BuOH molecules tend to locate close to the sulfonic groups, independent of the alcohol concentration. This can be clearly inferred from the radial distribution function between the hydrogen atom of the sulfonic group and the oxygen atom of butanol, gHx–OH(r). Fig. 6 displays the gHx–OH profiles for selected systems. For all profiles, the very high and sharp peak centered at ∼1.9 Å corresponds to BuOH molecules located in front of the sulfonic groups, whereas the wide shoulder at ∼5 Å captures the alcohol molecules arranged in the second shell.
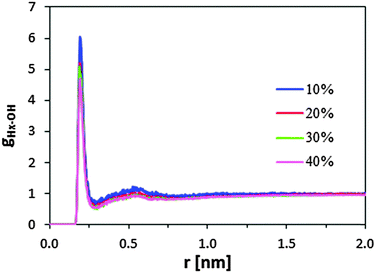 | ||
| Fig. 6 Radial distribution functions of the Hx–OH pair where Hx refers to the hydrogen atom of the sulfonic group and OH refers to the oxygen atom of 1-butanol. | ||
Conclusions
In summary, we have studied, by means of MD simulations, the macroscopic and microscopic swelling of a highly crosslinked macroreticular resin. The macroscopic swelling value predicted by the model agrees quite well with the experimental results validating the performance of the atomistic description. The microscopic study has allowed us to characterize and quantify the structure of the polymeric network at the molecular level and to confirm that alcohol molecules tend to interact with the sulfonic groups of the resin. The results obtained in this work are being used as a starting point for the study of the catalytic reaction in the P(S-DVB) resin using quantum mechanics/molecular mechanics methods.Acknowledgements
The present work was financially supported by MINECO and FEDER (MAT2012-34498), the FPI grant (FPI: BES-2011-048815), and Generalitat de Catalunya (XRQTC). The authors are in debt to CESCA for computational facilities.Notes and references
- C. Pacurariu, G. Mihoc, A. Popa, S. G. Muntean and R. Ianos, Chem. Eng. J., 2013, 222, 218–227 CrossRef CAS PubMed.
- J. H. Huang, X. F. Wu, H. W. Zha, B. Yuan and S. G. Deng, Chem. Eng. J., 2013, 218, 267–275 CrossRef CAS PubMed.
- S. Sharma, M. Dinda, C. R. Sharma and P. K. Ghosh, J. Membr. Sci., 2014, 459, 122–131 CrossRef CAS PubMed.
- Z. W. Tang, S. F. Li, W. N. Yang and X. B. Yu, J. Mater. Chem., 2012, 22, 12752–12758 RSC.
- S. Boussetta, C. Branger, A. Margaillan, J. L. Boudenne and B. Coulomb, React. Funct. Polym., 2008, 68, 775–786 CrossRef CAS PubMed.
- S. Eeltink, S. Dolman, F. Detobel, G. Desmet, R. Swart and M. Ursem, J. Sep. Sci., 2009, 32, 2504–2509 CrossRef CAS PubMed.
- Q. A. Acton, Ion Exchange Resins, Scholarly Editors, Advances in Research and Application, Atlanta, GA, 2013 Search PubMed.
- T. Zhang, Z. Dong, F. Qu, F. Ding, X. Peng, H. Wang and H. Gu, J. Hazard. Mater., 2014, 279, 597 CrossRef CAS PubMed; L. Alvarado, I. Rodríguez-Torres and A. Chen, Sep. Purif. Technol., 2013, 105, 55 CrossRef PubMed.
- S. Fekete, A. Beck, J. L. Veutheya and D. Guillarme, J. Pharm. Biomed. Anal., 2015, 113, 43–45 CrossRef CAS PubMed.
- P. Barbaro and F. Liguori, Chem. Rev., 2009, 109, 515 CrossRef CAS PubMed.
- M. A. Harmer and Q. Sun, Appl. Catal., A, 2001, 221, 45 CrossRef CAS.
- D. K. Mishra, A. A. Dabbawala and J. S. Hwang, Catal. Commun., 2013, 41, 52–55 CrossRef CAS PubMed.
- V. Parvulescu, V. Niculescu, R. Ene, A. Popa, M. Mureseanu, C. D. Ene and M. Andruh, J. Mol. Catal. A: Chem., 2013, 366, 275–281 CrossRef CAS PubMed.
- B. Wang and R. Weili, Chem. Eng. Commun., 2012, 199, 1236–1250 CrossRef CAS PubMed.
- L. Ronchin, G. Quartarone and A. Vavasori, J. Mol. Catal. A: Chem., 2012, 353, 192–203 CrossRef PubMed.
- G. Z. Fan, C. J. Liao, T. Fang, M. Wang and G. S. Song, Fuel Process. Technol., 2013, 116, 142–148 CrossRef CAS PubMed.
- B. Corain, M. Zecca and K. Jerábek, J. Mol. Catal. A: Chem., 2001, 177, 3 CrossRef CAS.
- L. Cai, A. Sudholt, D. J. Lee, F. N. Egolfopoulos, H. Pitsch, C. K. Westbrook and S. M. Sarathy, Combust. Flame, 2014, 161, 798 CrossRef CAS PubMed.
- M. A. Pérez, R. Bringué, M. Iborra, J. Tejero and F. Cunill, Appl. Catal., A, 2014, 482, 38 CrossRef PubMed.
- M. A. Pérez-Maciá, D. Curcó, R. Bringué, M. Iborra and C. Alemán, Soft Matter, 2015, 11, 2251 RSC.
- E. Lindahl, B. Hess and D. van der Spoel, J. Mol. Model., 2001, 7, 306 CAS.
- D. van der Spoel, E. Lindahl, B. Hess, G. Groenhof, A. E. Mark and H. J. C. Berendsen, J. Comput. Chem., 2005, 26, 1701 CrossRef CAS PubMed.
- B. Hess, C. Kutzner, D. van der Spoel and E. Lindahl, J. Chem. Theory Comput., 2008, 4, 435 CrossRef CAS.
- J. Wang, R. M. Wolf, J. W. Caldwell, P. A. Kollman and D. A. Case, J. Comput. Chem., 2004, 25, 1157 CrossRef CAS PubMed.
- http://virtualchemistry.org, accessed May, 2015.
- M. Anisimov, G. Lamoureux, I. V. Vorobyov, N. Huang, B. Roux and A. D. MacKerell Jr., J. Chem. Theory Comput., 2005, 1, 153 CrossRef.
- I. Vorobyov, V. M. Anisimov, S. Greene, R. M. Venable, A. Moser, R. W. Pastor and A. D. MacKerell Jr., J. Chem. Theory Comput., 2007, 3, 1120 CrossRef CAS.
- T. Darden, D. York and L. Pedersen, J. Chem. Phys., 1993, 98, 10089 CrossRef CAS PubMed.
- U. Essmann, L. Perera, M. L. Berkowitz, T. Darden, H. Lee and L. G. Pedersen, J. Chem. Phys., 1995, 103, 8577 CrossRef CAS PubMed.
- S. Nosé, J. Chem. Phys., 1984, 81, 511 CrossRef PubMed.
- W. G. Hoover, Phys. Rev. A: At., Mol., Opt. Phys., 1985, 31, 1695 CrossRef.
- M. Parrinello and A. Rahman, J. Appl. Phys., 1981, 52, 7182 CrossRef CAS PubMed.
- D. C. Sherrington, Chem. Commun., 1998, 2275 RSC.
| This journal is © The Royal Society of Chemistry 2015 |

