 Open Access Article
Creative Commons Attribution 3.0 Unported Licence
Why does high pressure destroy co-non-solvency of PNIPAm in aqueous methanol?
Tiago E.
de Oliveira
ab,
Paulo A.
Netz
ab,
Debashish
Mukherji
*a and
Kurt
Kremer
*a
aMax-Planck Institut für Polymerforschung, Ackermannweg 10, 55128 Mainz, Germany. E-mail: mukherji@mpip-mainz.mpg.de; kremer@mpip-mainz.mpg.de
bUniversidade Federal do Rio Grande do Sul, Porto Alegre, Brazil
First published on 27th August 2015
Abstract
It is well known that poly(N-isopropylacrylamide) (PNIPAm) exhibits an interesting, yet puzzling, phenomenon of co-non-solvency. Co-non-solvency occurs when two competing good solvents for PNIPAm, such as water and alcohol, are mixed together. As a result, the same PNIPAm collapses within intermediate mixing ratios. This complex conformational transition is driven by preferential binding of methanol with PNIPAm. Interestingly, co-non-solvency can be destroyed when applying high hydrostatic pressures. In this work, using a large scale molecular dynamics simulation employing high pressures, we propose a microscopic picture behind the suppression of the co-non-solvency phenomenon. Based on thermodynamic and structural analysis, our results suggest that the preferential binding of methanol with PNIPAm gets partially lost at high pressures, making the background fluid reasonably homogeneous for the polymer. This is consistent with the hypothesis that the co-non-solvency phenomenon is driven by preferential binding and is not based on depletion effects.
1 Introduction
Poly(N-isopropylacrylamide) (PNIPAm) is a so-called smart polymer that responds to a wide range of external stimuli, such as temperature, cosolvents, ionic strengths, and pressures. One of the most fascinating and puzzling phenomena of PNIPAm is its ability to exhibit co-non-solvency.1–7 When a sample of PNIPAm is dissolved in mixtures of water and alcohol under ambient conditions, it collapses when the composition of solvent mixtures is between 5–40% of alcohol concentration.1–4 Understanding this complex structural transition is not only scientifically challenging,6,7 but also has a wide variety of applicabilities that range from physics to biology.8–10 In this context, it has been recently shown that the co-non-solvency can only be explained by the preferential binding of one of the cosolvent components with the polymer. In other words, the competitive displacement of cosolvent components plays a significant role in describing co-non-solvency.7,11 It was suggested that when a very small amount of better cosolvent is added into the dilute aqueous polymer solution, these better cosolvents bind two monomers potentially far along the backbone forming segmental loops. This loop formation initiates the process leading to a final well collapsed structure of the polymer. Interestingly, this preferential cosolvent binding can also explain the reopening of the polymers at high cosolvent concentrations by the complete decoration of the polymer with cosolvents.7,11Another surprising phenomenon of PNIPAm is when it is exposed to high hydrostatic pressures. It was experimentally observed that when a collapsed PNIPAm between 5–40% of alcohol concentration is kept under high hydrostatic pressures at 298 K, co-non-solvency gets completely destroyed. As a consequence, a PNIPAm chain only remains in the expanded coil state, irrespective of the water–methanol mixing concentrations.12 The present work is the first attempt to give a detailed microscopic picture of this interesting pressure induced reopening of PNIPAm under co-non-solvency conditions. We use large scale molecular dynamics simulations to study the conformational transition of PNIPAm in aqueous methanol by employing high hydrostatic pressures. We perform thermodynamic and structural analysis to propose a microscopic origin of this high pressure effect.
The remainder of this paper is organized as follows: in Section 2 we briefly state the methodology for simulations and Section 3 presents Results and discussion. Finally we draw our conclusions in Section 4.
2 Simulation method and model
In this study we employ all atom molecular dynamics simulations using GROMACS package.13 We use the Gromos96 force field14 for methanol and the SPC/E water model15 and the force field parameters for PNIPAm are taken from ref. 3. The temperature is set to 298 K using a Berendsen thermostat with a coupling constant of 0.1 ps. The time step for the simulations is chosen as 1 fs. Unless stated otherwise results are shown for the ambient and 500 MPa pressures. However, in some cases, we have also performed simulations at 100 MPa and 200 MPa to systematically test the pressure effects. It should be noted that the all atom force field used here has reasonably good transferability over a wide range of pressures and temperatures.16 The pressure coupling is done using a Berendsen barostat17 with a coupling time of 0.5 ps. The electrostatics are treated using Particle Mesh Ewald.18 The interaction cutoff is chosen as 1.4 nm.We use a PNIPAm chain of length N = 32 solvated in a simulation box consisting of 2 × 10⁴ solvent molecules at 25% methanol molar concentration xm, i.e. 0.5 × 10⁴ methanol and 1.5 × 10⁴ water molecules, respectively. In some cases, we have also performed simulations over the full concentration range of methanol, ranging from pure water xm = 0.0 to pure methanol xm = 1.0. This system size is large enough to maintain the solvent equilibrium between the local region within the vicinity of the polymer and the bulk aqueous methanol solution. Note that maintaining the solvent equilibrium in molecular simulations is a paramount task, which is most severe when the polymer collapse and expansion are driven by strong local concentration fluctuations of different solvent components. This can either be achieved by using a grand-canonical-like approach6 or by using a large simulation box.19 Mid-sized simulation domains are prone to system size effects and, therefore, may lead to unphysical structural fluctuations. Every initial configuration is equilibrated for 50 ns under ambient pressure. The production runs are performed for 450 ns at 298 K and varying pressures. During the production run observables such as end-to-end distance Ree, pair distribution function gij(r), Kirkwood–Buff integral Gij and potential of mean force VPMF(r) are calculated. The time scale of simulation used here is approximately one order of magnitude larger than the conformational relaxation time of a PNIPAm chain, which is estimated by calculating the end-to-end autocorrelation function 〈Ree(t)·Ree(0)〉.
3 Results and discussion
3.1 Polymer conformation under high pressures
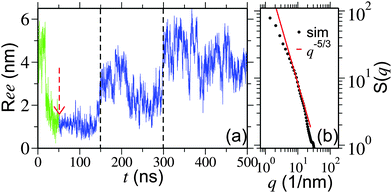
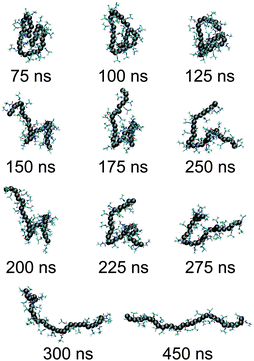
We start our discussion by presenting the central result of this paper, which is the structure of the polymer at high pressures. The initial configurations are generated by performing a simulation starting from a completely extended PNIPAm structure at 298 K temperature and ambient pressure. In Fig. 1(a) the green curve (for t < 50 ns) presents the time evolution of polymer end-to-end distance Ree during equilibration. The structure collapses within 25 ns of MD run. Then we further monitor the collapsed structure for another 25 ns to identify any unphysical fluctuations, which showed a rather stable collapsed conformation. The last frame of this initially equilibrated sample was used for the production runs under high pressures. The blue curve in Fig. 1(a) presents the time evolution of Ree at 500 MPa calculated over a 450 ns simulation trajectory. It can be appreciated that the polymer remains within a completely globular state for almost 100 ns, with a distinctly prominent stable polymer loop (see simulation snapshots in Fig. 2). The first expansion occurs at around 150 ns when the end loop opens up. The complete opening of the polymer chain occurs for t > 300 ns. A sequence of simulation snapshots is presented in Fig. 2. Thus our simulations could correctly capture the features observed in the high pressure experiments.12Furthermore, to confirm that we are indeed getting a well extended structure at 500 MPa, we look into the scaling law of the static structure factor for a PNIPAm chain at 500 MPa, which should support the scaling law S(q) ∼ q−1/ν with ν = 3/5 being the Flory exponent.20,21 In Fig. 1(b) we show S(q) for a PNIPAm chain at 500 MPa and calculated from the MD trajectory for t > 300 ns. Indeed, the data in the range 4 nm−1 < q < 20 nm−1 can be reasonably well described by a scaling exponent ν = 5/3 known from the self avoiding random walk.20,21 This range falls within the length scale of 1.6 nm and 0.4 nm. Considering that the gyration radius Rg ∼ 1.7 nm, the observed length scale is satisfactory. Moreover, it should also be mentioned that ideally a good estimate of S(q) requires long chains and here we are simulating a rather short chain of Nl = 32 (or approximately 10 persistence lengths). Therefore, while the data in Fig. 1(b) are certainly not good enough to derive an apparent exponent, it is reasonable to clearly mark an extended chain.
Here, we also want to comment on the range of pressures used here and in the experiments.12 It should be noted that a pressure of upto 200 MPa was used in ref. 12. However, thus far, we have only presented results for 500 MPa. Therefore, in Fig. 3 we show a systematic dependence of Ree on pressure. It can be appreciated that the polymer reaches a fully extended state (represented by Ree ∼ 4.5) at P ≥ 200 MPa. This gives a very good comparison with the experimental results. For P = 100 MPa, however, we find a semi-collapsed structure (with Ree ∼ 3.0) for up to 450 ns, the typical simulation time scale investigated here.
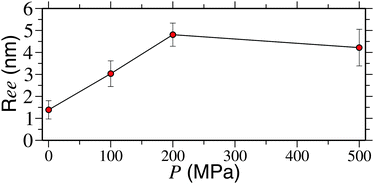 | ||
| Fig. 3 Polymer end-to-end distance Ree as a function of applied pressure P for a PNIPAm chain of length Nl = 32 and at a temperature of 298 K. | ||
The observed prominent loops (see Fig. 2) in our all atom simulations are reminiscent of the proposed mechanism of polymer collapse transition in mixed good solvents.7 It is known that the loops are formed because of the bridging methanol molecules that can bind two distinctly far monomers along the backbone.7 Therefore, if the bridging is getting destroyed at high pressures, then there must also be a disruption of methanol–polymer interaction to facilitate the opening of a PNIPAm chain. Therefore, to establish a microscopic picture of the high pressure effects, we first look into the structure of water and methanol within the solvation volume of the polymer.
3.2 Coordination and excess coordination numbers
In this section we perform structural analysis of the polymer solution. For this purpose we calculate the radial distribution function gij(r) between solution components. To obtain better convergence in gij(r), we have simulated a single monomer of PNIPAm (represented as NIPAm) in a 25% methanol–water mixture. In Fig. 4 we present NIPAm–methanol and NIPAm–water gij(r) for two different pressures. It is apparent from the plot that – while methanol coordination reduces partially within the first solvation shell (at around 0.5 nm), the coordination of water increases. This suggests that methanol is getting partially replaced by water within the solvation shell of PNIPAm.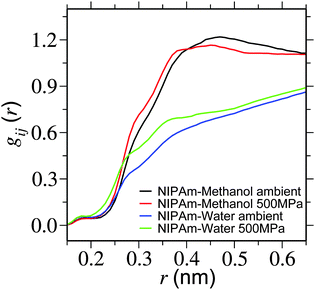 | ||
| Fig. 4 Radial distribution function gij(r) showing NIPAm–methanol and NIPAm–water coordination for two different pressures. Simulations are performed at a temperature of 298 K. | ||
Furthermore, in Table 1 we present an estimate of the change in the coordination number between NIPAm and bulk solution components. It can be appreciated that with increasing pressure the coordination number of NIPAm–methanol only increases by about 16%, whereas NIPAm–water increases by 54%. This suggests that water is replacing methanol in the solvation shell, making the background fluid more homogeneous for the polymers. This is consistent with the expanded structure of the polymer.
 , bulk solution number density of solution components ρ and the coordination numbers nρ
| Pairs at different pressures | n (nm3) | ρ (nm−3) | nρ |
|---|---|---|---|
| NIPAm–methanol ambient | 0.4718 | 6.7749 | 3.1964 |
| NIPAm–methanol 500 MPa | 0.4758 | 7.8068 | 3.7145 |
| NIPAm–water ambient | 0.2352 | 20.3248 | 4.7804 |
| NIPAm–water 500 MPa | 0.3123 | 23.4204 | 7.3142 |
The density of the system increases about 15% when the system goes from ambient pressure to 500 MPa. It is known that this increase in density leads to a substantial increase of the average coordination number of water,22 and also to an increase in the diffusion coefficient at low temperatures,23 but at high temperatures the effect of the pressure on the diffusion coefficient is the opposite. Indeed, when the high pressure is applied, the diffusion coefficient of water and methanol (data not shown) decreases by about 40% and 50%, respectively. Thus suggesting that the pressure-induced replacement of methanol with water has a thermodynamic rather than a kinetic origin.
A theory that perhaps best connects the relative intermolecular affinity and the solution thermodynamics is the fluctuation theory of Kirkwood and Buff (KB).24 KB theory connects gij(r) to the thermodynamic properties of solutions using the “so called” KB integrals or excess coordinations,
 | (1) |
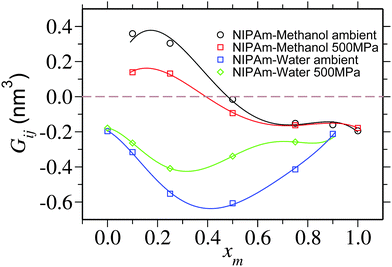 | ||
| Fig. 5 Kirkwood–Buff integral Gij showing NIPAm–methanol Gpm and NIPAm–water Gpw excess coordination as a function of methanol molar fraction xm. Lines are the polynomial fits to the data that are drawn to guide the eye. For pure solvent at xm = 0.0 and pure cosolvent at xm = 1.0, individual coordinations Gpm and Gpw are undefined, respectively. A horizontal dashed line is drawn to show Gij = 0. The data corresponding to the ambient pressure are taken from ref. 6. | ||
To better quantify this reduced preferentiability one can translate the information presented in Fig. 5 into chemical potential of PNIPAm μp, which can be calculated using,25
 | (2) |
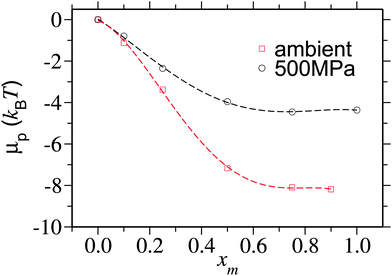 | ||
| Fig. 6 Chemical potential shift per monomer μp/Nl as a function of methanol mole fraction xm for two different pressures. μp is calculated by integrating the data obtained from eqn (2). The data corresponding to the ambient pressure are taken from ref. 6. | ||
It is yet important to mention that the polymer collapse can either be initiated by: (a) the bridging and looping scenario presented earlier6 or (b) the depletion effects.26 Our arguments of polymer collapse-swelling transition are based on the scenario (a). However, it could also be argued that the depletion effects,26 that are responsible for polymer collapse under the poor solvent conditions, may be a factor behind PNIPAm collapse in aqueous methanol mixtures under ambient pressure. However, it should be noted that when two competing good solvents are mixed together, such that the dissolved polymer collapses within the intermediate mixing ratios, the collapse occurs when the solvent quality remains good or even gets increasingly better by the addition of better cosolvent (in this case methanol).6 This makes the polymer conformation decoupled from the solvent quality. Therefore, precluding any explanation based on the depletion effects that can “only” explain poor solvent collapse. Furthermore, the depletion induced attractions can only be enhanced when increasing density. Note that for 500 MPa pressure bulk solution density increases by 15%. Therefore, if the pure depletion effects were the microscopic origin of co-non-solvency, PNIPAm would never open under the influence of higher pressures. The same argument also holds to explain the reopening of PNIPAm at high methanol concentrations. Further suggesting that the bridging scenario seems to be the only possible explanation to co-non-solvency6,7,11 and pressure induced reopening presented in this work.
3.3 Potential of mean force
Finally we want to study the thermodynamic origin of this interesting conformational transition. For this purpose we have calculated the potential of mean force (PMF) between solute and solvent components. The PMF is calculated using the umbrella sampling27 over a series of independent simulations at 298 K temperature and 500 MPa pressure, each for a 10 ns long trajectory. The center-of-mass positions between the NIPAm monomer and the solvent components are generated by pulling the solvent component towards the NIPAm monomer using a steered molecular dynamics algorithm. Here the spring constant is chosen as 1000 kJ mol−1 nm−2 and a velocity of pull was selected as 0.001 nm ps−1. Between 0 and 1.65 nm we choose 120 positions that are constrained using a LINCS algorithm.28 The PMF is calculated by integrating the constraining forces fc using the expression,29,30 | (3) |
In Fig. 7 we show VPMF(r). Looking into the plot under ambient pressure, it becomes apparent that there exists an attractive well for NIPAm–methanol interaction (represented by the black curve), whereas NIPAm–water interaction is repulsive (represented by the blue curve). Furthermore, when the high pressure is applied the attractive well of NIPAm–methanol interaction becomes shallower, indicating a reduced attractive interacting strength between NIPAm and methanol at high pressure. On the other hand NIPAm–water develops a attractive well. The applied pressure, therefore, could decrease the preferentiability of NIPAm–methanol interaction and, at the same time, enhance the NIPAm–water coordination, leading to polymer swelling.
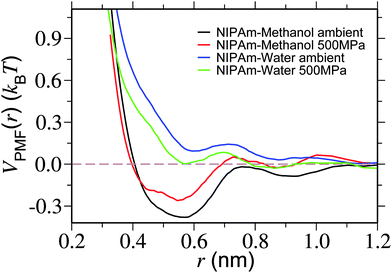 | ||
| Fig. 7 Potential of mean force VPMF(r) showing NIPAm–methanol and NIPAm–water interaction strengths for two different pressures. Simulations are performed at a temperature of 298 K. | ||
4 Conclusions
Using molecular dynamics simulations of an all atom model, we unveil the microscopic origin why the application of high hydrostatic pressures can destroy the co-non-solvency phenomenon of poly(N-isopropylacrylamide) (PNIPAm) in aqueous methanol mixtures.12 Performing structural and thermodynamic analysis, we propose that the reopening of a collapsed PNIPAm at 25% methanol concentration is due to the partial loss of preferential binding of methanol with PNIPAm at high pressures, which is the only key factor behind the polymer collapse in a mixture of two competing good solvents.7 This reduced preferentiability makes the background fluid reasonably homogeneous for PNIPAm. This is consistent with the swollen structure of the polymer under high pressures. Additionally, the results presented here eliminate any possible explanation of the co-non-solvency effect based on pure entropic effects. Had the collapse-swelling transition been dictated by depletion forces, polymer would have never open up under high pressures, especially because depletion forces are most severe under high pressures.Acknowledgements
The development of this work would not have been possible without fruitful collaboration with Carlos Marques, we take this opportunity to gratefully acknowledge. We thank Walter Richtering for bringing ref. 12 to our attention and Davide Donadio and Torsten Stuehn for many stimulating discussions. T.E.O. and P.A.N. acknowledge financial support from CNPq and CAPES from Brazilian Government and hospitality at the Max-Planck Institut für Polymerforschung, where this work was performed. We thank Robinson Cortes-Huerto and Carlos Marques for critical reading of this manuscript. Simulation snapshots in this manuscript are rendered using VMD.31References
- H. G. Schild, M. Muthukumar and D. A. Tirrell, Macromolecules, 1991, 24, 948 CrossRef CAS.
- G. Zhang and C. Wu, Phys. Rev. Lett., 2001, 86, 822 CrossRef CAS PubMed.
- J. Walter, J. Sehrt, J. Vrabec and H. J. Hasse, J. Phys. Chem. B, 2012, 116, 5251 CrossRef CAS PubMed.
- H. Kojima, F. Tanaka, C. Scherzinger and W. Richtering, J. Polym. Sci., Part B: Polym. Lett., 2012, 51, 1100 CrossRef.
- F. Tanaka, T. Koga and F. M. Winnik, Phys. Rev. Lett., 2008, 101, 028302 CrossRef PubMed.
- D. Mukherji and K. Kremer, Macromolecules, 2013, 46, 9158 CrossRef CAS.
- D. Mukherji, C. M. Marques and K. Kremer, Nat. Commun., 2014, 5, 4882 CrossRef PubMed.
- M. A. Cohen-Stuart, W. T. S. Huck, J. Genzer, M. Müller, C. Ober, M. Stamm, G. B. Sukhorukov, I. Szleifer, V. V. Tsukruk, M. Urban, F. Winnik, S. Zauscher, I. Luzinov and M. Minko, Nat. Mater., 2010, 9, 101 CrossRef CAS PubMed.
- M. A. Ward and T. K. Georgiou, Polymers, 2011, 3, 1215 CrossRef CAS.
- S. de Beer, E. Kutnyanszky, P. M. Schön, G. J. Vancso and M. H. Müser, Nat. Commun., 2014, 5, 3781 CAS.
- D. Mukherji, C. M. Marques, T. Stuehn and K. Kremer, J. Chem. Phys., 2015, 142, 114903 CrossRef PubMed.
- C. H. Hofmann, S. Grobelny, M. Erlkamp, R. Winter and W. Richtering, Polymer, 2014, 55, 2000 CrossRef CAS.
- S. Pronk, S. Pall, R. Schulz, P. Larsson, P. Bjelkmar, R. Apostolov, M. R. Shirts, J. C. Smith, P. M. Kasson, D. van der Spoel, B. Hess and E. Lindahl, Bioinformatics, 2013, 29, 845 CrossRef CAS PubMed.
- W. F. van Gunsteren, S. R. Billeter, A. A. Eising, P. H. Hünenberger, P. Krüger, A. E. Mark, W. R. P. Scott and I. G. Tironi, Hochschulverlag AG an der ETH Zürich, 1996 Search PubMed.
- H. J. C. Berendsen, J. R. Grigera and T. P. Straatsma, J. Phys. Chem., 1987, 91, 6269 CrossRef CAS.
- J. C. G. Pereira, C. R. A. Catlow and G. D. Price, J. Phys. Chem. A, 2001, 105, 1909 CrossRef CAS.
- H. J. C. Berendsen, J. P. M. Postma, W. F. van Gunsteren, A. DiNola and J. R. Haak, J. Chem. Phys., 1984, 81, 3684 CrossRef CAS.
- U. Essmann, L. Perera, M. L. Berkowitz, T. Darden, H. Lee and L. G. A. Pedersen, J. Chem. Phys., 1995, 103, 8577 CrossRef CAS.
- D. Mukherji, N. F. A. van der Vegt, K. Kremer and L. Delle Site, J. Chem. Theory Comput., 2012, 8, 375 CrossRef CAS PubMed.
- P.-G. de Gennes, Scaling Concepts in Polymer Physics, Cornell University Press, London, 1979 Search PubMed.
- J. Des Cloizeaux and G. Jannink, Polymers in Solution: Their Modelling and Structure, Clarendon Press, Oxford, 1990 Search PubMed.
- P. A. Netz, F. W. Starr, M. C. Barbosa and H. E. Stanley, Physica A, 2002, 314, 470 CrossRef CAS.
- P. A. Netz, F. W. Starr, M. C. Barbosa and H. E. Stanley, Braz. J. Phys., 2004, 34, 24 CrossRef CAS.
- J. R. Kirkwood and F. P. Buff, J. Chem. Phys., 1951, 19, 774 CrossRef CAS.
- J. Rösgen, B. M. Pettitt and D. W. Bolen, Biophys. J., 2005, 89, 2988 CrossRef PubMed.
- H. N. W. Lekkerkerker and R. Tuinier, Colloids and the Depletion Interaction, Clarendon Press, Oxford, 1990 Search PubMed.
- G. M. Torrie and J. P. Valleau, J. Comp. Phys., 1977, 23, 187 CrossRef.
- B. Hess, H. Bekker, H. J. C. Berendsen and J. G. E. M. Fraaije, J. Comput. Chem., 1997, 18, 1463 CrossRef CAS.
- M. Sprik and G. Ciccoti, J. Chem. Phys., 1998, 109, 7737 CrossRef CAS.
- J. Kahlen, L. Salimi, M. Sulpizi, C. Peter and D. Donadio, J. Phys. Chem. B, 2014, 118, 3960 CrossRef CAS PubMed.
- W. Humphrey, A. Dalke and K. Schulten, J. Mol. Graphics, 1996, 14, 33 CrossRef CAS PubMed.
| This journal is © The Royal Society of Chemistry 2015 |

