 Open Access Article
Creative Commons Attribution 3.0 Unported Licence
Structure of DPPC–hyaluronan interfacial layers – effects of molecular weight and ion composition†
D. C. Florian
Wieland
*a,
Patrick
Degen
b,
Thomas
Zander
a,
Sören
Gayer
a,
Akanksha
Raj
c,
Junxue
An
cd,
Andra
Dėdinaitė
cd,
Per
Claesson
cd and
Regine
Willumeit-Römer
a
aHelmholtz Zentrum Geesthacht, Institute for Materials Research, Max-Planck Straße 1, 21502 Geesthacht, Germany
bTU Dortmund, Fakultät Chemie, Otto-Hahn-Straße 6, 44221 Dortmund, Germany
cKTH Royal Institute of Technology, School of Chemical Sciences and Engineering, Department of Chemistry, Surface and Corrosion Science, Drottning Kristinas väg 51, SE-10044 Stockholm, Sweden
dSP Technical Research Institute of Sweden, SP Chemistry, Materials and Surfaces, Box 5607, SE-114 86 Stockholm, Sweden
First published on 22nd October 2015
Abstract
Hyaluronan and phospholipids play an important role in lubrication in articular joints and provide in combination with glycoproteins exceptionally low friction coefficients. We have investigated the structural organization of 1,2-dipalmitoyl-sn-glycero-3-phosphocholine (DPPC) Langmuir layers at the solution-air interface at different length scales with respect to the adsorption of hyaluronan (HA). This allows us to assemble a comprehensive picture of the adsorption and the resulting structures, and how they are affected by the molecular weight of HA and the presence of calcium ions. Brewster angle microscopy and grazing incident diffraction were used to determine the lateral structure at the micro- and macro scale. The data reveals an influence of HA on both the macro and micro structure of the DPPC Langmuir layer, and that the strength of this effect increases with decreasing molecular weight of HA and in presence of calcium ions. Furthermore, from X-ray reflectivity measurements we conclude that HA adsorbs to the hydrophilic part of DPPC, but data also suggest that two types of interfacial structures are formed at the interface. We argue that hydrophobic forces and electrostatic interactions play important rules for the association between DPPC and HA. Surface pressure area isotherms were used to determine the influence of HA on the phase behavior of DPPC while electrophoretic mobility measurements were used to gain insight into the binding of calcium ions to DPPC vesicles and hyaluronan.
1. Introduction
The unmatched tribological performance of articulated joints is due to both the properties of the cartilage itself and the self-organization of molecules in the synovial fluid (SF) and at the surface of the cartilage.1,2 Two of the main components that have been suggested to have a prominent role in joint lubrication are phospholipids and hyaluronan. It has been reported that phospholipids form lamellar structures on the cartilage surfaces, which are able to reduce friction and wear.3–5 As in all natural systems, complex compositions of lipids are found in the SF. The most abundant saturated phospholipid in joints is 1,2-dipalmitoyl-sn-glycero-3-phosphocholine (DPPC),5 which makes it a good choice when investigating some of the principles of joint lubrication.Hyaluronan (HA) is a high molecular weight polysaccharide which is negatively charged. Although it has a simple primary structure, consisting of a linear chain of a repeating disaccharide unit, it has specific solution properties which are connected to its conformation.6 It has a prominent role in providing the synovial fluid with its rheological properties. HA is viewed as a contracted four-fold helix on the local scale, while it forms a stiffened random coil at larger length scale.7,8 It contains charged carboxylate units, and hydrophobic patches can also be found in its structure.9 Both the hydrophobic patches and the charged carboxylate units open possibilities for interactions.
The lubrication performance and stability properties of lipid layers and hyaluronan adsorbed to interfaces have been investigated in different studies.10–17 The data presented up to now suggests that HA alone does not provide good lubrication properties as it has been observed that it is readily repelled from most interfaces including cartilage.11,12 However, it has been shown that hyaluronan is able to bind to phospholipid bilayers, and that this affects the friction properties.14,15 It has been reported that the load bearing capacity of the hyaluronan phospholipid composite layer is high, but nevertheless lower than that offered by a DPPC bilayer alone.15 Furthermore AFM Colloidal probe measurements showed that the friction, while still being low, increases when HA is adsorbed to DPPC bilayers.15 The origin for this is attributed to HA binding to DPPC, which affects the structure and interactions of the lipid bilayers.
In this work we further elucidate association of DPPC and HA at interfaces and investigate the effects of the presence of calcium ions and the molecular weight (Mw) of HA on the structures formed at the interface. The synovial fluid contains sodium chloride at a concentration of 155 mM L−1, but it also contains other ions. For instance, calcium with a concentration of 4 mM L−1.18 The presence of divalent ions like calcium can change the structure of lipid layers,19–21 and it could also affect the charge density of HA if calcium ions bind to the carboxylate unit.22
The molecular weight of HA appears to be of importance in the synovial area, and it has been reported that molecular weight changes can be connected to the appearance of joint diseases like osteoarthritis.23,24 For instance, it has been observed that the severity of inflammatory joint disease is associated with a decrease in concentration and molecular weight of HA,23,25,26 which decreases the synovial fluid viscosity. It is also plausible that the Mw of HA will directly influence its interaction with phospholipid bilayers, which might yield a different interfacial structure that could affect lubrication properties.
In order to enhance our understanding of the interactions and structures of HA/DPPC composite layers we employed different techniques to revel the structure at different length scales and dimensions. As model system we choose Langmuir layers of DPPC as they are regarded as a good model system for studying lipid interaction under aqueous conditions. We applied X-ray reflectivity and grazing incidence diffraction measurements to reveal the vertical and lateral structure, respectively. Surface-pressure area isotherms provided information on phase changes of the lipids due to adsorption of HA, and due to different salt conditions in the solution. Brewster angle microscopy provided lateral information on the micrometre scale and complemented the information obtained by X-ray scattering and surface-pressure area isotherms. The influence of calcium ions on DPPC vesicles and HA was further studied by electrophoretic mobility measurements.
2. Materials and methods
2.1 Materials
1,2-Dipalmitoyl-sn-glycero-3-phosphocholine (DPPC) was purchased from Avanti polar lipids (catalogue no. 850355P) in powder form, and used as received. Sodium chloride (assay > 99.9%, catalogue no. HN00.1) purchased from Carl Roth and calcium chloride dihydrate (assay > 99%, catalogue no. 5239.1) purchased from Carl Roth were heated up to 200 °C in a vacuum oven to remove organic residues. Chloroform (assay ≥99.5%, catalogue no. C2432) was purchased from Sigma-Aldrich, and used for dissolving the DPPC powder. The water used in all experiments was purified by a Millipore system. The purified water had a resistivity of 18.2 MΩ cm at 25 °C. Hyaluronan (HA) with different molecular weights was purchased from creative PEGworks. Weight averaged molecular weights (Mw) of 10 kDa (Lot.: LZG1202081), 250 kDa (Lot.: LZG11112201), 750 kDa (Lot.: LZG11021801), 1500 kDa (Lot.: LZG12022101), and 2500 kDa (Lot.: LZG12021501) were used.2.2 Preparation of Langmuir layers
Surface pressure-area isotherms (π/A-isotherms) were measured using a custom built Langmuir trough manufactured by K&R, Golm, Germany. The trough has a maximum area of 300 mm2 and a minimum area of 29 mm2. The Langmuir trough is equipped with a Wilhelmy type measuring system for monitoring the surface pressure. The two Teflon barriers are controlled by a computer system and they were moved at a speed of 0.1 mm s−1 during measurement of the π/A-isotherms.DPPC solutions with a concentration of 0.01 mol L−1 were prepared as stock solutions in chloroform for spreading the Langmuir layers. Stock solutions of the subphase were made by dissolving HA with varying Mw (10 kDa, 250 kDa, 800 kDa, 1500 kDa, 2500 kDa) in two different aqueous solutions: (i) sodium chloride (CNaCl = 155 mM); (ii) sodium chloride (CNaCl = 155 mM) with calcium chloride (CCaCl2 = 10 mM). The concentration of HA in the subphase was 0.5 mg mL−1 for all measurements, ensuring that the number of carbohydrate and charged carboxylate residues are the same in all experiments.
The Langmuir trough was first cleaned with chloroform and afterwards rinsed with MilliQ water to remove organic and inorganic residues, respectively. Before preparing the Langmuir layer the barriers were compressed to the minimum area to check that the surface pressure stayed at 0 mN m−1 and thus ensuring that the interface was clean. Afterwards, 0.5 mL of the DPPC solution was spread on the surface of the subphase. In the standard preparation protocol 30 min was allowed for the chloroform to evaporate and for HA to adsorb prior to compression. Only for selected measurements we waited 60 min to investigate the effect of the adsorption time. At least three π/A-isotherms for each subphase condition were recorded and averaged. All measurements were performed at 25 °C.
2.3 Electrophoretic mobility
Electrophoretic mobility measurements were performed using a Zetasizer 2000 (Malvern Instruments, UK) at 25 °C. The instrument was calibrated using Malvern Zeta Potential transfer standard DTS-1050 prior to measurements. The concentration of DPPC vesicles and HA (Mw 1500 kDa) was 0.5 mg mL−1.DPPC powder was dissolved in chloroform to a final concentration of 10–20 mg mL−1. The solvent was evaporated by rotary evaporation to form a thin film on the vial wall. Films were placed under vacuum overnight to make sure solvent would be completely removed. Lipid films were then hydrated to 1000 ppm with milliQ water by putting the solution in a water bath at 60 °C for at least 1 hour, and then sonicated at 60 °C to get almost clear solution. The solution was diluted to the final concentration with NaCl buffer or CaCl2/NaCl buffer and sonicated for another 30 minutes to get completely clear solution. Final concentration of solution was 500 ppm.
2.4 XRR and GID measurements
The X-ray reflectivity (XRR) and grazing incidence diffraction (GID) measurements of the Langmuir layers were done at the beamline ID10b, ESRF, France.27 This beamline has a dedicated surface scattering setup for liquid interfaces. The energy of the X-ray beam was 10 keV and the beam had a size of 6 μm × 200 μm. For the GID measurements an incident angle of 0.1° was used, which is 85% of the critical angle of water. The beamline is equipped with a custom built Langmuir trough. In order to reduce evaporation and background the trough is sealed with a lid and flushed with water saturated helium. The surface pressure was recorded during the measurement.As the measurement of a XRR and GID scattering pattern takes roughly 30 min in total, these measurements were done at distinct areas and pressures. The areas per molecule at the interface were chosen to be 120 Å2, 80 Å2, and 55 Å2 as here the pure Langmuir layer of DPPC is in the gaseous, liquid expanded and tilted condensed phase, respectively. The trough was moved laterally after each measurement in order to probe a new area and minimize any possible effects of radiation damage. However, we note that the surface pressure was constant during our XRR and GID experiments, suggesting that damage due to the X-ray beam is absent or insignificant.
In X-ray reflectivity experiments the specular reflected intensity I is measured as function of the incident angle θ. The scattered intensity is thereby influenced by the electron density (ρe) of the sample perpendicular to the surface according to:28
 | (1) |
 | (2) |
The reflectivity data were modeled using the Parratt algorithm29 in combination with the effective density model30 to account for interfacial roughness. For a normal Langmuir layer a box model with 3 layers was used, two layers account for the headgroup and tailgroup of the phospholipid. The third box was needed to model the adsorption layer of HA.
In GID measurements the incident angle of the X-ray beam is chosen to be smaller than the angle for total external reflection at the interface of interest. Due to this, the X-rays cannot penetrate the underlying material and scattering predominantly originates from the structures in the interface region.31
Langmuir layers at the air–liquid interface form two-dimensional crystalline structures which give rise to scattering signals.28,32 The scattered signal is modulated by the form factor of the lipid and the structure factor of their two dimensional arrangement reflecting the translational order in the plane of the monolayer.33 As the crystal at the interface has only one unit cell perpendicular to the water surface, the Bragg reflection coming from the crystals is transformed into a Bragg rod, which is much more extended compared to a normal crystal reflection. This Bragg rod reflection contains structural information like the unit cell size, tilt angle of the alkyl chains and length of the alkyl chain.28,33,34 Thus, the combination of XRR and GID provides information on both the vertical and lateral structure of Langmuir layers.
2.5 Brewster-angle-microscopy (BAM)
BAM-images were recorded during compression of the Langmuir monolayer using an ultraBAM apparatus constructed by Accurion GmbH (Germany) in combination with the Langmuir trough described above. The BAM apparatus uses the zero reflectance of an air/water surface for parallel polarized light at the Brewster angle of incidence. The condensed phase of a monolayer leads to a measurable change in reflectivity, thus allowing the visualization of the monolayer morphology. The lateral resolution of BAM is approx. 2 μm, limited by the wavelength of the incident laser beam (690 nm).Langmuir layers often separate into multiple domains signaling the coexistence of different phases. The boundaries of such domains are curved, yielding a line force per unit length normal to the phase boundary and tangent to the surface containing the Langmuir layer with a magnitude that is the product of the line tension and the curvature of the interphase boundary. The line tension, the two dimensional analog of surface tension, is the free energy per unit length associated with the boundary between two phases on a surface. Attempts to measure the line tension in various systems have multiplied over recent years. Line tension between fluid Langmuir phases has most often been measured by watching the relaxation of stretched domains toward an energy-minimizing circular shape.35 The relaxation of large perturbations, such as bola-shaped domains (two teardrop-shaped resevoirs tethered together with a line of nearly constant thickness) have been modelled only heuristically; models to extract line tension36–38 approximated the bola shape as two perfectly round discs connected by an infinitesimally thin tether, which is far from the true form. The measuring of the line tension was not the topic of our investigations. Thus, we choose a compression speed that no relaxation processes of the domains were observed in our experiments.
3. Results and discussion
3.1 Surface pressure-area isotherms
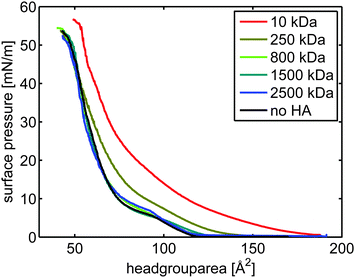 | ||
| Fig. 1 π/A-isotherms of DPPC on aqueous subphases containing sodium chloride ([NaCl] = 155 mM). The concentration of HA was 0.5 mg mL−1. | ||
In contrast, the π/A-isotherm of DPPC on a subphase containing HA with Mw of 10 kDa (red curve in Fig. 1) is significantly expanded compared to that of DPPC on an aqueous subphase containing no HA (blue). This means that the presence of HA with molecular weight 10 kDa significantly affects interactions within and the structure of the DPPC Langmuir layer. In this case the surface pressure reaches a measurable value already at a mean molecular area of 180 Å2. Further, the pressure increases smoothly with decreasing area per molecule with no indication of a kink, which suggests the absence of any phase transition. The surface pressure measured in the presence of HA with Mw of 250 kDa is, between 50 Å2 and 130 Å2, higher than that recorded in absence of HA but lower than in presence of HA with low molecular weight (10 kDa). For smaller areas per molecule (≤50 Å2) the π/A-isotherm recorded in presence of HA with Mw of 250 kDa coincides with the π/A-isotherm determined on the HA-free 155 mM NaCl subphase. Our data demonstrates that the interaction between DPPC and HA strongly depends on the Mw of HA, where a lower molecular weight affects the lateral interactions more and thus alters the packing of DPPC more severely.
We also investigated if the adsorption time had an influence on the formed structures. For this we compared isotherms were we waited 30 min and 60 min, respectively. No significant difference in the isotherms of DPPC on HA with 10 kDa molecular weight was seen, see ESI,† Fig. S1.
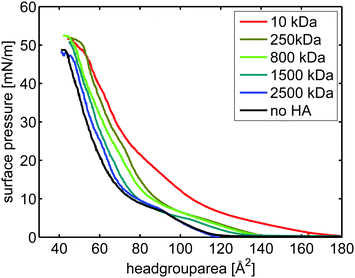 | ||
| Fig. 2 π/A-isotherms of DPPC on subphases containing sodium and calcium chloride ([NaCl] = 155 mM, [CaCl2] = 10 mM). The concentration of HA was 0.5 mg mL−1. | ||
The presence of calcium ions in the subphase affects HA–DPPC interactions significantly. Again we observe that the effect of HA on the π/A-isotherm, and thus on the lateral interactions, increases with decreasing molecular weight of HA. Contrary to what was observed for the subphase without calcium, HA with high Mw (above 250 kDa) also affects the isotherm, suggesting enhanced interactions with DPPC in the presence of calcium ions. We also investigated the influence of the adsorption time on the isotherms, again no significant difference of the isotherms for HA with a molecular weight of 10 kDa could be seen, ESI,† Fig. S2.
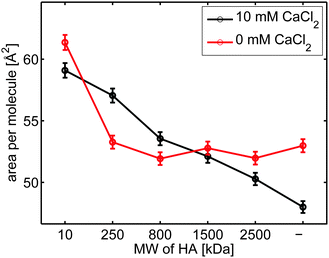
Fig. 3 depicts the area per molecule at a constant surface pressure of 40 mN m−1 at the different subphases. Comparing the curves it can be seen that in the presence of calcium ions the area per molecule is decreased for DPPC on solutions without HA. In absence of calcium ions, only the hyaluronan with low Mw (10 KDa) expands the layer at high surface pressures. In contrast, in presence of calcium ions hyaluronan always expands the monolayer at high compression, and the effect is more pronounced the lower the Mw of hyaluronan.
3.2 Electrophoretic mobility
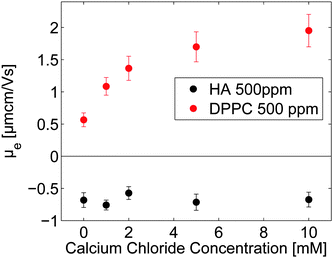
The electrophoretic mobility (μe) data presented in Fig. 4 show that DPPC vesicles in 155 mM NaCl are slightly positively charged due to weak preferential binding of cations. The positive value of the electrophoretic mobility increases with calcium chloride concentration, confirming accumulation of calcium ions in the headgroup region. Binding of calcium ions to phosphatidylcholine headgroups has been reported previously, and it has been suggested that binding saturation is reached when the stoichiometry of calcium ions to phosphatidylcholine is 1![[thin space (1/6-em)]](https://www.rsc.org/images/entities/char_2009.gif) :
:![[thin space (1/6-em)]](https://www.rsc.org/images/entities/char_2009.gif) 2.40 The electrophoretic mobility of hyaluronan is close to independent of the calcium chloride concentration, suggesting no or only weak binding of the divalent calcium ion to the negatively charged polyelectrolyte at the high ionic strength (155 mM NaCl was also present) of our measurements. This is consistent with the weak effect of calcium ions on hyaluronan solutions reported in the literature.
2.40 The electrophoretic mobility of hyaluronan is close to independent of the calcium chloride concentration, suggesting no or only weak binding of the divalent calcium ion to the negatively charged polyelectrolyte at the high ionic strength (155 mM NaCl was also present) of our measurements. This is consistent with the weak effect of calcium ions on hyaluronan solutions reported in the literature.
3.3 Lateral structure imaging by Brewster angle microscopy
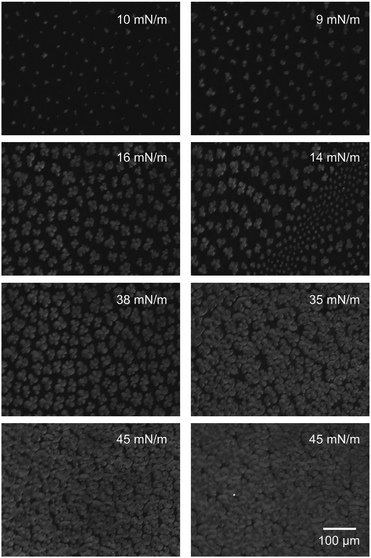
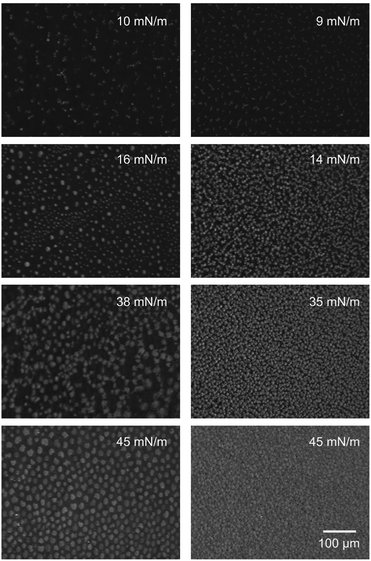
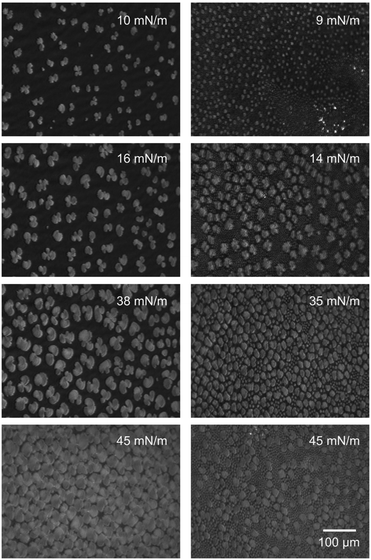
By utilizing Brewster angle microscopy, BAM, we explore how the presence of hyaluronan affects domain structures on the length scale of tens to hundreds of micrometers. BAM images of DPPC Langmuir layers on 155 mM NaCl solutions with and without 10 mM CaCl2 are shown in Fig. 5. At low surface pressures, ≈10 mN m−1, small patches of condensed regions of DPPC molecules are observed on both subphases. As the surface pressure is increased to 16 mN m−1 the islands grow in size. The shape of the condensed regions on both subphases is of the typical multilobe form with extended arms that wind in a chiral fashion.41,42 However, on the subphase containing calcium chloride two different island sizes can be detected, particularly pronounced at surface pressures of around 15 mN m−1. By increasing the pressure further to 45 mN m−1 a high packing of the DPPC islands is achieved. The sample with 10 mM calcium chloride shows a denser packing of the islands, as also indicated by the π/A-isotherms.In the presence of hyaluronan with a molecular weight of 10 kDa, Fig. 6, the structures observed at the interface are significantly altered. At the lowest surface pressure, ≈10 mN m−1, small irregular shaped aggregates can be seen on subphases with and without calcium chloride. At higher surface pressures (>14 mN m−1), a clear difference between the monolayer morphology on the two subphases is noted. On the 155 mM NaCl subphase containing HA with Mw 10 kDa the condensed regions increase in size with increasing surface pressure but they are still clearly separated at 38 mN m−1, even though the area between them increases in brightness indicating increased density of material here as well. In contrast, when also 10 mM CaCl2 is present in the subphase the condensed regions are smaller and more densely packed. By increasing the surface pressure to 45 mN m−1, the packing density is further increased but no growth of the individual patches can be observed.
DPPC on subphases containing HA with Mw of 1500 kDa and 155 mM sodium chloride (Fig. 7, left) display condensed regions that are lager compared to those observed on the subphase without HA. Increasing the pressure results in a behavior that is qualitatively similar to that observed on the subphase without any HA. The main difference being a lower packing density of the condensed regions at intermediate surface pressures, 16 mN m−1, in presence of HA with Mw 1500 kDa. At the highest surface pressure of 45 mN m−1 the morphology in presence and absence of hyaluronan with Mw 1500 kDa is similar.
The structure of the DPPC layer is strongly altered when also 10 mM CaCl2 is present in the subphase, see Fig. 7 right. At low compression a large number of small condensed regions can be seen. Some of these grow in size as the surface pressure is increased, but smaller patches remain. At 35 mN m−1 small and large condensed regions co-exist across the image, and as the surface pressure is increased further to 45 mN m−1 the number of large patches decreases. To summarize, our data demonstrate that hyaluronan affects the organization of DPPC over large (10–100 μm) length scales. The presence of HA promotes formation of small, condensed regions with a round circumference over growth of the condensed regions. Consistent with the π/A-isotherms, the most pronounced effect is observed in presence of CaCl2 and for the HA with low molecular weight, 10 kDa.
3.4 Vertical structures determined by X-ray reflectivity
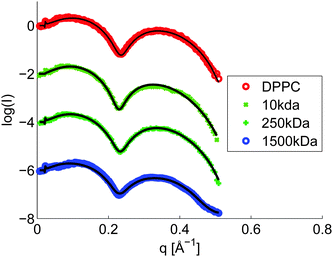
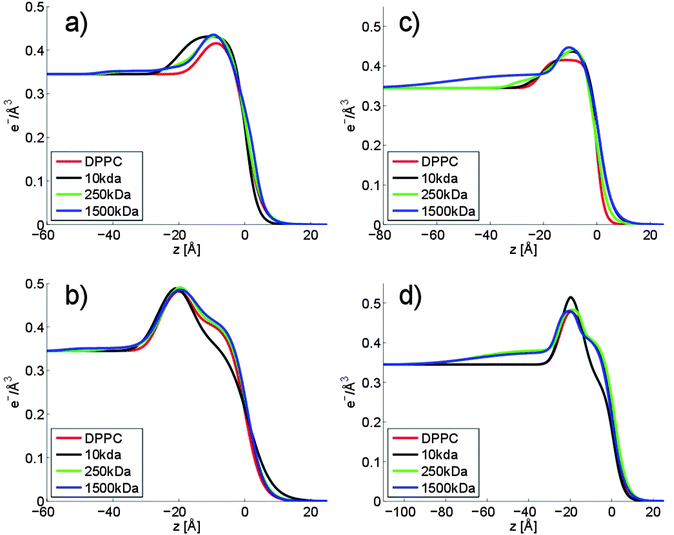
From the π/A-isotherms and the BAM images we have learned that HA affects the lateral interactions in Langmuir layers of DPPC, and that the effect is increased with decreasing molecular weight of HA and by addition of calcium chloride to a concentration of 10 mM. This leads to significant changes in the organization of DPPC over large length scales (10–100 μm) as illustrated by BAM imaging. To gain further understanding of the molecular origin of this change in large-scale organization we have elucidated the structures formed at the air–water interface on the molecular level by performing X-ray reflectivity measurements. We note that the BAM images showed an inhomogeneous structure at the interface. However, the lateral coherence length is much smaller than the structures involved in the scattering, therefore, the electron density from both areas are additive and a homogeneous model, reflecting the average electron density of the two regions, can be assumed.31 However, for selected samples a two phase model was utilized to get access to the layer structure in between the patches. The measured reflectivity curves of DPPC at an area per molecule of 55 Å2 are shown in Fig. 8, and all other reflectivity curves together with the fits are shown in the ESI† (Fig. S5–S12). The XRR curves were analyzed using a box model consisting of three layers to account for the polar headgroup, the alkyl chain and an adsorption layer of HA. The obtained electron density profiles are depicted in Fig. 9. Fig. 9a and b show the electron density profiles on aqueous 155 mM NaCl subphases. The x-axis is chosen such that zero coincides with the end of the alkyl chain of the phospholipid, i.e. positive z-values are in the air and negative z-values are in the subphase/layer system.At an area per molecule of 120 Å2, which corresponds to the gaseous phase, the Langmuir layer of DPPC on solutions without any HA was modelled with a single layer (i.e. the head group and tail group regions were not separated). The thickness was determined to be 16 Å, Fig. 9a. This is in accordance with data found in the literature.43 The electron density profiles for DPPC on subphases with HA show an increased electron density that is influenced by the Mw of HA. In the presence of HA with Mw of 10 kDa the observed layer has nearly doubled its thickness, indicating significant accumulation of HA in the polar headgroup region of DPPC. This rationalizes the significant expansion of the DPPC monolayer observed in the π/A-isotherm (see Fig. 1).
An increased electron density and a change of the shape of the electron density curve can be observed also for HA with Mw of 250 kDa and 1500 kDa. The maximum electron density in the headgroup region is almost as high as for HA with a Mw of 10 kDa. However, the structures of the adsorbed films differ. In contrast to the compact layer observed in presence of low molecular weight HA, the adsorbed layer formed when HA with a Mw of 1500 kDa or 250 kDa is present in the solution has two regions. The first region can be associated with the Langmuir layer of DPPC (−16 Å to 0 Å). The second layer, which has a lower electron density, can be attributed to tails and loops of HA adsorbed to the DPPC layer (−45 Å to −16 Å). A magnification of this region in the electron density profile is shown in the ESI,† Fig. S4. Based on the data shown in Fig. 1, it is clear that the more extended HA layers formed by the high molecular weight hyaluronans affect the lateral interactions in the DPPC layer less than the compact layer formed by the low molecular weight HA (Mw 10 kDa).
When the area per molecule is decreased to 55 Å2, Fig. 9b, the typical structure of a Langmuir layer in the titled condensed phase can be seen. The polar headgroup and the alkyl chain can be well distinguished. Based on the π/A-isotherms shown in Fig. 1, one would expect that only the low molecular weight HA would affect the structure of the Langmuir layer significantly at this surface pressure. Indeed, addition of HA with Mw 10 kDa induces the largest change in the vertical structure of the Langmuir layer. The electron density in the alkyl chain region is significantly lower compared to that found for DPPC on pure 155 mM NaCl solutions. In contrast, the headgroup region has almost the same maximum electron density in absence and presence of HA with molecular weight 10 kDa. As the headgroup is significantly larger than the cross-section of the alkyl chain, the distance between lipids in the condensed phase is largely determined by the polar headgroup.44 The observation that the electron density of the alkyl chain region is decreased in the presence of HA 10 kDa suggests that the HA resides between the DPPC headgroups and prevents them from packing as close together as in absence of HA. For solutions with HA 1500 kDa and 250 kDa, the structure of the DPPC layer is similar to that found in absence of HA. Instead, an adsorbed layer residing directly under the polar group is present. It has a thickness of 30 Å and 20 Å for HA with Mw 1500 kDA and 250 kDa, respectively. The compression of the DPPC monolayer does not influence the thickness of the adsorbed HA layer, it remains the same as the mean molecular area is decreased from 120 Å2 to 55 Å2.
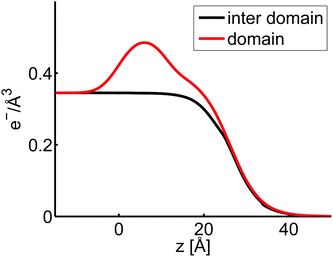
For the HA with Mw 10 kDa a two phase model was also fitted to the reflectivity curves at an area per molecule of 55 Å2 in order to evaluate the layer thickness of the material in between the patches. Here an incoherent superposition of reflectivities was used and the proportion of both was determined from the BAM images. Again a Langmuir layer with a high electron density in the headgroup region and reduced electron density in the tail region is observed, consistent with the picture emerging from the one phase model, see Fig. 10. The properties of the second phase which was extracted from this model shows the presence of a layer with a thickness of 4 Å and a very small electron density, suggesting the presence of a fuzzy and thin layer in between the patches.
Consistent with the π/A-isotherms, we find that calcium ions have a significant influence on the electron density profiles as shown in Fig. 9c and d. Again, at an area per molecule of 120 Å, DPPC can be modelled with one layer but the thickness changes from 16 Å to 20 Å when 10 mM CaCl2 is added to the subphase in absence of HA. The electron density profile changes further when HA with Mw of 1500 kDa is present in the subphase. In this case a second layer with a thickness of 50 Å can be detected between the head group region and bulk solution. In comparison to this, HA with a Mw of 10 kDa and 250 kDa mainly increase the electron density of the polar headgroup region. The larger accumulation of HA next to the DPPC in presence of calcium chloride (compare Fig. 9a and b with Fig. 9c and d) explains why the π/A-isotherms are more strongly affected by the presence of HA when calcium chloride is present in the subphase (compare Fig. 1 and 2).
After reducing the area per molecule to 55 Å2, both HA with Mw of 1500 kDa and 250 kDa adsorb to form a roughly 60 Å thick layer (Fig. 9d) beneath the DPPC layer. The electron density of these layers is nearly identical to that observed at an area per molecule of 120 Å2 for HA with Mw of 1500 kDa. In contrast, HA with a Mw of 10 kDa increases the maximum electron density in the head group region whereas the thickness of the layer is unaffected. The electron density of the alkyl chain region is decreased in presence of HA 10 kDa, indicating a lower packing density of DPPC.
3.5 Local lateral structure characterization by GID measurements
We will first discuss the results obtained on sodium chloride solutions. From the π/A-isotherms and the XRR measurements we have learned that low molecular HA influences lateral interactions in DPPC monolayers more than high molecular weight hyaluronan, and this is due to a stronger accumulation close to the DPPC head group region. We now endeavour to learn if the presence of HA also affects the local lateral structure of the DPPC monolayer, and this was probed by GID. The area per alkyl chain and the tilt angle of the alkyl chains, which are obtained from the Bragg rod analysis, are summarised in Tables 1 and 2.| HA [kDa] | Area/chain at 80 Å per molecule | Area/chain at 55 Å per molecule | Tilt angle at 80 Å per molecule | Tilt angle at 55 Å per molecule |
|---|---|---|---|---|
| — | 19.1 ± 0.5 | 16.8 ± 0.5 | ||
| 10 | 24.6 ± 0.5 | 20.9 ± 0.5 | 33.3 ± 0.5 | 27.0 ± 0.5 |
| 250 | 24.2 ± 0.5 | 19.8 ± 0.5 | 33.6 ± 0.5 | 22.6 ± 0.5 |
| 1500 | 19.2 ± 0.5 | 169 ± 0.5 |
| HA [kDa] | Area/chain at 80 Å per molecule | Area/chain at 55 Å per molecule | Tilt angle at 80 Å per molecule | Tilt angle at 55 Å per molecule |
|---|---|---|---|---|
| — | 26.8 ± 0.5 | 20.6 ± 0.5 | 35.7 ± 0.5 | 23.8 ± 0.5 |
| 10 | 23.5 ± 0.5 | 20.8 ± 0.5 | 31.4 ± 0.5 | 25.8 ± 0.5 |
| 250 | 24.7 ± 0.5 | 20.4 ± 0.5 | 29.4 ± 0.5 | 24.9 ± 0.5 |
| 1500 | 26.8 ± 0.5 | 20.7 ± 0.5 | 35.6 ± 0.5 | 23.6 ± 0.5 |
By compressing the DPPC layer to 55 Å2 the area per chain is similar in absence and presence of HA, indicating that HA has less influence on the lateral packing. Just as in absence of calcium chloride, the area per chain and the tilt angle of the alkyl chains decrease with decreasing mean area per molecule. At high compression, mean area per molecule of 55 Å2, the tilt and angle for DPPC in absence and presence of HA with Mw 1500 kDa are larger than in presence of HA 10 kDa and HA 250 kDa. This increase in the tilt angle cannot be attributed only to a changed packing density as the area per chain is nearly the same for all samples. Thus, the decrease in the tilt angle has to be an effect of HA adsorbed to the phospholipid layer changing the lateral arrangement.
To summarize, the data provided by GID demonstrates that the presence of HA affects the local packing of DPPC in the Langmuir layer. Consistent with XRR and π/A-isotherm data, the largest effect is observed for the HA with lowest molecular weight (10 kDa). The appearance of GID peaks induced by the presence of HA was observed even at relatively large mean molecular areas (80 Å2), suggesting enhanced packing in these domains. The effect is particularly clear with low molecular weight HA that induces a decrease in the area per chain when the mean molecular area is large.
4. Discussion
4.1 Effect of calcium ions on DPPC monolayers
Our data show that calcium ions influence the organization in the DPPC layer. The isotherm is shifted to smaller headgroup areas and the film can also be compressed to smaller areas per molecule (see Fig. S1, ESI†). Furthermore, the electrophoresis mobility measurements show an increase of the mobility by the addition of calcium ions, indicating adsorption of the divalent ions to the vesicles. The GID measurements show the formation of ordered regions already at a surface pressure of 10 mN m−1, which is not observed for the Langmuir layer without calcium ions. A possible explanation can be found in structure of the zwitterionic DPPC headgroup. The negatively charged oxygen groups are located at the side of the headgroup. It is reasonable that some calcium ions will bind to this group, and it has been suggested that calcium ion binding proceeds until the calcium/headgroup ratio is 1![[thin space (1/6-em)]](https://www.rsc.org/images/entities/char_2009.gif) :
:![[thin space (1/6-em)]](https://www.rsc.org/images/entities/char_2009.gif) 2.40 It is plausible that bridging by the calcium ions can occur, which promotes formation of a more ordered layer structure. For HA no significant influence of calcium ions on the electrophoretic mobility was observed, which suggests minor binding of calcium to HA.
2.40 It is plausible that bridging by the calcium ions can occur, which promotes formation of a more ordered layer structure. For HA no significant influence of calcium ions on the electrophoretic mobility was observed, which suggests minor binding of calcium to HA.
4.2 Association of DPPC and HA
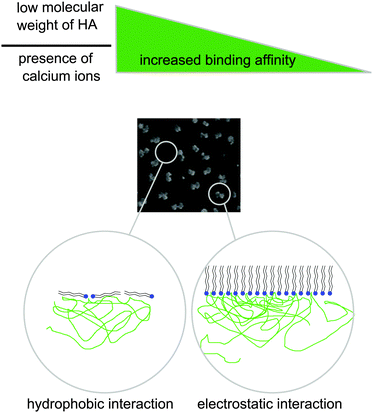
Our data demonstrate adsorption of HA to DPPC Langmuir layers. It appears that we observe two different modes of interfacial association, see Fig. 11 which shows a sketch of the adsorption. The experimental results suggest that HA adsorbs to the headgroup of DPPC (mode 2), and also that HA forms surface active structures with DPPC that accumulate in between condensed DPPC domains (mode 1).The π/A-isotherms show that HA affects the arrangement in DPPC Langmuir layers. The BAM images obtained on 155 mM sodium chloride subphases support these observations as strong morphological changes are observed in presence of the 10 kDa HA. The images also hint at some material in between the patches, which indicates the presence of two phases at the interface. HA itself is not surface active as no increase in surface pressure was seen for the DPPC-free hyaluronan solutions. The results from the GID experiments are consistent with these findings. At a surface pressure of 22 mN m−1 the lateral distance of the lipids is increased by 4% in the presence of the 10 kDa HA compared to what is found on the 155 mM sodium chloride subphase in absence of HA. In comparison, the isotherms show an increase of 25% at a surface pressure of 22 mN m−1 in the average area per molecule. The modeling of the XRR curves using a two-phase model rationalizes these findings. The two phases can be associated with the condensed phase of DPPC and the region in-between the condensed DPPC domains, consisting of a thin layer with low electron density. The explanation for the formation of the second phase, which we assign to HA/lipid complexes is not obvious. However, we suggest that some of the hydrophobic patches of HA associate with the alkyl chains of DPPC,45 which counteracts formation of tightly packed layers and constitute the second phase in between the condensed DPPC domains.
However, HA also adsorbs to the headgroups, which can be concluded from the electron density profiles of the fitted reflectivity curves for all molecular weights of HA. It is also supported by the GID measurements as the spacing of the single lipids is enlarged for HA 10 kDa and 250 kDa showing a different morphology of the DPPC condensed phase. This changed interaction of the DPPC molecules propagates into large-scale organizational changes as visualized by the BAM images. It seems likely that electrostatic interactions between negatively charged carboxylic acid groups of HA and the positively charged part of DPPC play a role for the accumulation of HA in the headgroup region, thereby decreasing the packing density of the lipids by changing the interaction properties.
4.3 Effect of hyaluronan molecular weight
One of the main findings in this work is that HA with low molecular weight affects the packing and organization of DPPC Langmuir layers more than hyaluronan with high molecular weight. This is an unexpected finding considering that adsorption of polymers generally increases with increasing molecular weight due to less severe loss of translational entropy due to adsorption.46 A possible reason for the unusual molecular weight effect observed for hyaluronan on DPPC could be due to differences in solution structures for hyaluronan of different molecular weights. Let us follow this line of thought and recapitulate what is known of the solution properties of hyaluronan.In dilute solutions hyaluronan is regarded as a locally stiff random coil, having a persistence length of about 9 nm. However, for small molecular weights, up to about 10 kDa, the solution conformation is better described as a stiff rod.47 It has been speculated that for low molecular weight hyaluronan it is difficult to form favourable intrachain segment–segment interactions, whereas such interactions are easier to form for higher molecular weight polymers. Such segment–segment interactions can be due to both transient hydrogen bonds48 and hydrophobic interactions.9 Based on this we suggest that the difference in secondary structure between low and high molecular weight hyaluronan is important for interactions with DPPC. The less developed intrachain interactions in low molecular weight hyaluronans could thus make such interaction sites available for association with DPPC, and if so this would rationalize our finding that low molecular weight HA affects DPPC Langmuir layers more than high molecular weight ones. In this context, it is interesting to note that the molecular weight of hyaluronan also has a very strong effect on its biological function.49
4.4 Effect of calcium ions on hyaluronan/DPPC interactions
The presence of calcium ions also promotes the binding of HA to the DPPC monolayer, which affects the π/A-isotherms in a manner that depends on the molecular weight of HA (see Fig. 3). In contrast, the XRR measurements show an adsorption layer of HA, about 8 nm thick, which is similar for HA with molecular weights of 1500 kDa and 250 kDa. Just as in absence of calcium ions we find that HA with Mw 10 kDa decreases the electron density in the tailgroup region whereas the electron density of the headgroup region is increased. This hints at a strong adsorption of HA 10 kDa to the headgroup of DPPC. The GID experiments show that for all conditions with HA and calcium ions, Langmuir layers with crystalline order can be detected even at such large mean molecular areas as 80 Å2. This demonstrates the existence of a high ordering in the individual DPPC patches. The BAM images of DPPC on subphases with HA 10 kDa show small irregularly shaped patches. Together with the GID results the conclusion can be drawn that the DPPC molecules in these patches are in the tilted condensed phase. It can be observed that a higher Mw of HA leads to a weaker interaction, which was also seen in the experiments without calcium. The electrophoresis mobility measurements show that calcium ions bind to DPPC. Therefore, the DPPC layer becomes more positive charge, which facilitates incorporation of negatively charged HA in the headgroup region. This is true even though calcium ions associate weakly to HA, since the presence of positively charged calcium ions in the DPPC headgroup region counteracts development of a negative electrostatic potential as HA is adsorbed to the DPPC layer.Friction force measurements have indicated that the load bearing capacity of solid supported DPPC bilayers is somewhat reduced in presence of HA.15,16 We speculate that this is due to a distorted lateral order of the DPPC layers induced by the adsorption of HA. Our data suggest that HA not only adsorbs in the DPPC headgroup region but also between the condensed DPPC domains observed in BAM images. In the condensed domains, the presence of HA changes the interaction between the DPPC molecules and increases their distance as shown by the GID. The larger distance found in the HA/DPPC composite films may contribute to the decreased load bearing capacity under the combined action of shear and load.
5. Conclusions
We have investigated the association between HA and DPPC Langmuir layers and the influence of HA on the structure of the DPPC monolayer. Fig. 11 summarizes the results of our study. The data indicate that DPPC and HA act via electrostatic and hydrophobic interactions. Our data shows that HA binds to DPPC, while the strength of interaction is affected by the Mw of the HA polymer. HA with a lower Mw has a stronger tendency to bind to the DPPC Langmuir layer and to accumulate between single domains of condensed DPPC. We suggest that the molecular weight effect is due to different conformations of HA with low and high molecular weight. The association between DPPC and HA is enhanced in presence of 10 mM CaCl2.Acknowledgements
We wish to acknowledge the financial support by the BMBF-project 05K2012 within the Joint International Research Project Röntgen-Angström-Cluster. Further we acknowledge Oleg Knovalov of the ID10B, ESRF, France.References
- B. A. Hills, Intern. Med. J., 2002, 32, 242–251 CrossRef CAS PubMed.
- A. R. C. Jones, J. P. Gleghorn, C. E. Hughes, L. J. Fitz, R. Zollner, S. D. Wainwright, B. Caterson, E. A. Morris, L. J. Bonassar and C. R. Flannery, J. Orthop. Res., 2007, 25, 283–292 CrossRef CAS PubMed.
- T. A. Schmidt, N. S. Gastelum, Q. T. Nguyen, B. L. Schumacher and R. L. Sah, Arthritis Rheum., 2007, 56, 882–891 CrossRef CAS PubMed.
- H. E. Ozturk, K. K. Stoffel, C. F. Jones and G. W. Stachowiak, Tribol. Lett., 2004, 16, 283–289 CrossRef CAS.
- L. R. Gale, Y. Chen, B. A. Hills and R. Crawford, Acta Orthop, 2007, 78, 309–314 CrossRef PubMed.
- J. R. E. Fraser, T. C. Laurent and U. B. G. Laurent, J. Intern. Med., 1997, 242, 27–33 CrossRef CAS PubMed.
- J. M. Guss, D. W. Hukins, P. J. Smith, W. T. Winter and S. Arnott, J. Mol. Biol., 1975, 95, 359–384 CrossRef CAS PubMed.
- A. Almond, P. L. DeAngelis and C. D. Blundell, J. Mol. Biol., 2006, 358, 1256–1269 CrossRef CAS PubMed.
- J. E. Scott, C. Cummings, A. Brass and Y. Chen, Biochem. J., 1991, 274(Pt 3), 699–705 CrossRef CAS PubMed.
- D. P. Chang, N. I. Abu-Lail, J. M. Coles, F. Guilak, G. D. Jay and S. Zauscher, Soft Matter, 2009, 5, 3438–3445 RSC.
- J. Yu, X. Banquy, G. W. Greene, D. D. Lowrey and J. N. Israelachvili, Langmuir, 2012, 28, 2244–2250 CrossRef CAS PubMed.
- G. W. Greene, X. Banquy, D. W. Lee, D. D. Lowrey, J. Yu and J. N. Israelachvili, Proc. Natl. Acad. Sci. U. S. A., 2011, 108, 5255–5259 CrossRef CAS PubMed.
- M. Benz, N. H. Chen and J. Israelachvili, J. Biomed. Mater. Res., Part A, 2004, 71A, 6–15 CrossRef CAS PubMed.
- A. Dedinaite, Soft Matter, 2012, 8, 273–284 RSC.
- M. Wang, C. Liu, E. Thormann and A. Dedinaite, Biomacromolecules, 2013, 14, 4198–4206 CrossRef CAS PubMed.
- M. Wang, T. Zander, X. Y. Liu, C. Liu, A. Raj, D. C. F. Wieland, V. M. Garamus, R. Willumeit-Romer, P. M. Claesson and A. Dedinaite, J. Colloid Interface Sci., 2015, 445, 84–92 CrossRef CAS PubMed.
- C. Liu, M. Wang, J. X. An, E. Thormann and A. Dedinaite, Soft Matter, 2012, 8, 10241–10244 RSC.
- A. Maroudas, in Adult Articular Cartilage. Pitman Medical, ed. M. A. R. Freeman, Kent, UK, 1979, pp. 215–290 Search PubMed.
- V. Dupres, S. Cantin, F. Benhabib, F. Perrot, P. Fontaine, M. Goldmann, J. Daillant and O. Konovalov, Langmuir, 2003, 19, 10808–10815 CrossRef CAS.
- J. Kmetko, A. Datta, G. Evmenenko and P. Dutta, J. Phys. Chem. B, 2001, 105, 10818–10825 CrossRef CAS.
- J. Seelig, Cell Biol. Int. Rep., 1990, 14, 353–360 CrossRef CAS.
- F. Horkay, P. J. Basser, D. J. Londono, A. M. Hecht and E. Geissler, J. Chem. Phys., 2009, 131, 184902 CrossRef PubMed.
- E. A. Balazs, D. Watson, I. F. Duff and S. Roseman, Arthritis Rheum., 1967, 10, 357–376 CrossRef CAS PubMed.
- M. Ropes, W. B. Robertson, E. C. Rossmeisel, R. B. Peabody and W. Bauer, Acta Med. Scand., 1947, 128, 34–41 Search PubMed.
- P. A. Band, J. Heeter, H. G. Wisniewski, V. Liublinska, C. W. Pattanayak, R. J. Karia, T. Stabler, E. A. Balazs and V. B. Kraus, Osteoarthr Cartilage, 2015, 23, 70–76 CrossRef CAS PubMed.
- L. Sundblad, Acta Soc. Med. Ups., 1953, 58, 113–238 Search PubMed.
- D. M. Smilgies, N. Boudet, B. Struth and O. Konovalov, J. Synchrotron Radiat., 2005, 12, 329–339 CrossRef CAS PubMed.
- J. Alsnielsen, D. Jacquemain, K. Kjaer, F. Leveiller, M. Lahav and L. Leiserowitz, Phys. Rep., 1994, 246, 252–313 Search PubMed.
- L. G. Parratt, Phys. Rev., 1954, 95, 617 CrossRef.
- M. Tolan, X-Ray Scattering from Soft-Matter Thin Films, Springer Tracts in Modern Physics, 1999, vol. 148 Search PubMed.
- J. Als-Nielsen and D. McMarrow, Elements of Modern X-ray Physics, Wiley, 2011 Search PubMed.
- V. M. Kaganer, M. A. Osipov and I. R. Peterson, J. Chem. Phys., 1993, 98, 3512–3527 CrossRef CAS.
- K. Kjaer, Physica B, 1994, 198, 100–109 CrossRef CAS.
- V. M. Kaganer, H. Mohwald and P. Dutta, Rev. Mod. Phys., 1999, 71, 779–819 CrossRef CAS.
- J. R. Wintersmith, L. Zou, A. J. Bernoff, J. C. Alexander, J. A. Mann, E. E. Kooijman and E. K. Mann, Phys. Rev. E: Stat., Nonlinear, Soft Matter Phys., 2007, 75, 1–7 CrossRef PubMed.
- D. J. Benvegnu and H. M. Mcconnell, J. Phys. Chem., 1992, 96, 6820–6824 CrossRef CAS.
- E. K. Mann, S. Henon, D. Langevin, J. Meunier and L. Leger, Phys. Rev. E: Stat. Phys., Plasmas, Fluids, Relat. Interdiscip. Top., 1995, 51, 5708–5720 CrossRef CAS.
- J. Lauger, C. R. Robertson, C. W. Frank and G. G. Fuller, Langmuir, 1996, 12, 5630–5635 CrossRef.
- J. Marra and J. Israelachvili, Biochemistry, 1985, 24, 4608–4618 CrossRef CAS PubMed.
- C. Altenbach and J. Seelig, Biochemistry, 1984, 23, 3913–3920 CrossRef CAS PubMed.
- D. Vollhardt, N. Nandi and S. D. Banik, Phys. Chem. Chem. Phys., 2011, 13, 4812–4829 RSC.
- D. L. Leiske, B. Meckes, C. E. Miller, C. Wu, T. W. Walker, B. H. Lin, M. Meron, H. A. Ketelson, M. F. Toney and G. G. Fuller, Langmuir, 2011, 27, 11444–11450 CrossRef CAS PubMed.
- I. Estrela-Lopis, G. Brezesinski and H. Mohwald, Chem. Phys. Lipids, 2004, 131, 71–80 CrossRef CAS PubMed.
- H. Hauser, I. Pascher, R. H. Pearson and S. Sundell, Biochim. Biophys. Acta, 1981, 650, 21–51 CrossRef CAS.
- J. E. Scott, C. Cummings, A. Brass and Y. Chen, Biochem. J., 1991, 274, 699–705 CrossRef CAS PubMed.
- G. J. Fleer, M. A. Cohen Stuart, J. M. H. M. Scheutjens, T. Cosgrove and B. Vincent, Polymers at Interfaces, Chapman & Hall, London, 1993 Search PubMed.
- A. Almond, A. Brass and J. K. Sheehan, J. Mol. Biol., 1998, 284, 1425–1437 CrossRef CAS PubMed.
- A. Almond, Cell. Mol. Life Sci., 2007, 64, 1591–1596 CrossRef CAS PubMed.
- J. M. Cyphert, D. J. Carlin, A. Nyska, M. C. Schladweiler, A. D. Ledbetter, J. H. Shannahan, U. P. Kodavanti and S. H. Gavett, J. Toxicol. Environ. Health, Part A, 2015, 78, 151–165 CrossRef CAS PubMed.
Footnote |
| † Electronic supplementary information (ESI) available. See DOI: 10.1039/c5sm01708d |
| This journal is © The Royal Society of Chemistry 2016 |

