DOI:
10.1039/C5SM01427A
(Paper)
Soft Matter, 2015,
11, 6595-6603
Electric field induced birefringence in non-aqueous dispersions of mineral nanorods†
Received
9th June 2015
, Accepted 7th July 2015
First published on 7th July 2015
Abstract
Lanthanum phosphate (LaPO4) nanorods dispersed in the non-aqueous solvent of ethylene glycol form a system exhibiting large intrinsic birefringence, high colloidal stability and the ability to self-organize into liquid crystalline phases. In order to probe the electro-optical response of these rod dispersions we study here the electric-field-induced birefringence, also called Kerr effect, for a concentrated isotropic liquid state with an in-plane a.c. sinusoidal electric field, in conditions of directly applied (electrodes in contact with the sample) or externally applied (electrodes outside the sample cell) fields. Performing an analysis of the electric polarizability of our rod-like particles in the framework of Maxwell–Wagner–O'Konski theory, we account quantitatively for the coupling between the induced steady-state birefringence and the electric field as a function of the voltage frequency for both sample geometries. The switching time of this non-aqueous transparent system has been measured, and combined with its high Kerr coefficients and its features of optically isotropic “off-state” and athermal phase behavior, this represents a promising proof-of-concept for the integration of anisotropic nanoparticle suspensions into a new generation of electro-optical devices.
I Introduction
The response of anisotropic fluids to external electric fields has been widely studied and has led specifically to a major technological advance, the Liquid Crystal Displays (LCD).1,2 When applied to a liquid crystalline sample, the external electric field induces usually a reorientation of the mesogens along or perpendicular to the field. This electro-optical effect has been observed on a wide spectrum of materials, ranging from thermotropic molecular compounds (exhibiting a temperature dependent phase behavior) used in LCDs1–9 to lyotropic dispersions of anisometric colloidal nanoparticles (whose phase behavior is concentration dependent),10 such as filamentous viruses,11,12 pigment particles,13,14 silica rods15,16 or graphene oxide sheets.17,18
In the case of dilute suspensions into the isotropic liquid state, applying an electric field results in an induced nematic-like organization with the emergence of an associated birefringence.19–21 Beyond the intrinsic properties of the individual particles such as the presence of a permanent dipole or a core polarization induced by the field, several kinds of phenomenon are likely to arise to explain the coupling of the particles with the electric field.11,12,19,20,22,23 The first one is due to the dielectric mismatch between the particle and the solvent, creating an electrical dipole by the accumulation of dipolar bound charges at the particle/solvent interface. Similarly, when mobile charges are present in the particles, their accumulation at the interface leads to a contrast of conductivities with the surrounding electrolyte. Both mechanisms are known as the so-called Maxwell–Wagner polarizability, and are dependent on the electric field frequency. Working with charged particles usually enables the colloidal stability of their dispersions. This also induces the distortion of the electrical double layer by the external field (as well as other related phenomenon such as the electro-osmotic flow), as first described by O'Konski,24 who shows that the polarization of the ionic cloud is often the dominating mechanism.
We present here a study of the electric field induced birefringence in liquid suspensions of lanthanum phosphate (LaPO4) nanorods. A key feature of our system is that while most of the studies are performed in aqueous solvent,11,12,17–21,25–29 our LaPO4 rod-like particles are dispersed in ethylene glycol in which they exhibit an outstanding colloidal stability compared to water as reported in a previous paper.30 In this work, we first investigate the frequency dependence of the steady-state electric birefringence in our non-aqueous suspensions. Under an in-plane alternative (a.c.) electric field and with electrodes immersed in the sample, the frequency threshold between the conductivity contrast or dielectric mismatch based polarization mechanisms is determined. We then account quantitatively for the Kerr effect and its dependence with the field frequency and with the rod volume fraction thanks to the Maxwell–Wagner–O'Konski theory. The switching time, and consequently the rotational diffusion coefficient of the LaPO4 rods in ethylene glycol, is measured in order to consider the potential use of such a system in electro-optical devices. Due to the limitations brought by charge injection at the electrodes leading to possible electric shortcircuits, we have also designed an original cell, inspired by previous works,19,20 in which the electric field is applied tangentially to a thin dielectric quartz capillary wall limiting therefore its attenuation as shown by finite-element simulations. This geometry, which has the benefit to avoid any electric degradation of the sample even in steady-state regime under continuous sinusoidal field, shows similar optical retardation compared to cells with directly applied in-plane electric field.
II Materials and setups
A. Sample preparation and characterization
LaPO4 nanorods, synthesized according to ref. 30, are shown in Fig. 1. Their main features are an average length of L = 250 nm and a diameter of D = 11 nm. Their polydispersity is provided through the standard deviation of their size distribution, σL = 0.63 and σD = 0.19, respectively.30 The samples are prepared by diluting the rod-like particles with ethylene glycol to reach a concentration close to the binodal volume fraction (ϕB = 0.8% ± 0.1%) corresponding to the highest concentration of the isotropic liquid phase before the transition to the nematic state. The corresponding range of ionic strength I is in between 0.1 and 1 mM depending on the sample dilution. The dispersion conductivity is measured thanks to a conductivity meter (CDM210, Radiometer analytical). The LaPO4 surface charge density is estimated by zeta-potential measurement (Zeta Compact, CAD Instruments) as described in the ESI.†
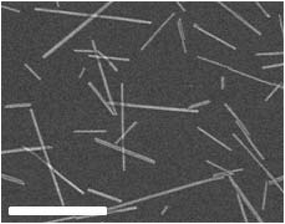 |
| | Fig. 1 Scanning electron microscopy picture of the LaPO4 nanorods obtained according to ref. 30. The scale bar is 500 nm. | |
B. Electro-optical setups
The first electro-optical setup is a commercial In-Plane Switching (IPS) cell containing 330 line-shaped electrodes (Instec Inc.). A schematic representation is given in Fig. 2(a). The samples are prepared by loading by capillarity the LaPO4 nanorod suspensions in the cells, which are then sealed with UV glue (Epotecny) to prevent any evaporation of the ethylene glycol solvent.
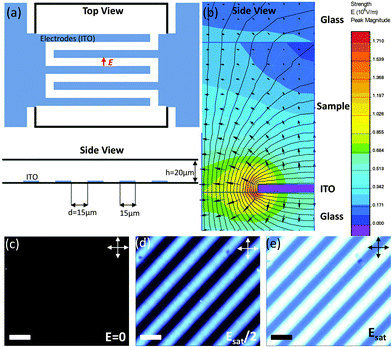 |
| | Fig. 2 (a) Schematic representation of the In-Plane Switching (IPS) cells used for probing the electro-optical effects in our colloidal dispersions. (b) Equipotential lines of the electric field (f = 100 kHz) simulated by finite element method inside an IPS cell containing ethylene glycol. For symmetry reason, only half an electrode is represented (side view). (c) Observation by optical microscopy between crossed polarizers of an IPS cell (top view) filled with an isotropic liquid suspension of LaPO4 nanorods when no electric field is applied (off-state). (d) and (e) Progressive increase of the electric induced birefringence with the in-plane electric field (scale bars: 30 μm). | |
Electric contacts between each Indium Tin Oxide (ITO) electrode and wires are made thanks to silver lacquer. Copper tape is added on the top of each contact to ensure good mechanical resistance when the cell is manipulated. The cell is then connected to a function generator (Centrad GF265) through an electric amplifier (FLC Electronics A400DI) which provides a voltage gain of a factor 20 for frequencies up to 400 kHz. When induced between two infinite parallel planes, the electric field (E) is the result of the ratio between the operating voltage (U0) and the inter-electrode distance (d). Moreover, the electric field being the result of an a.c. sinusoidal signal, the calculation is performed taking the root mean square (rms) value of the applied voltage:
| |  | (1) |
In
eqn (1),
cg is a correction factor accounting for the field attenuation in the sample due to the cell geometry. For two infinite parallel electrodes, we have
cg = 1. However, IPS cells are far from this well-defined geometry (
Fig. 2(a)) therefore numerical simulations of the effective electric field inside the cell have been performed. The results obtained by finite element analysis using the QuickField software are shown in
Fig. 2(b), providing an attenuation factor of
cg ≃ 0.46, which is the mean square value over the cell thickness (
h) and measured at an equidistance of two ITO electrodes. Computer simulations show also that
cg is only slightly sensitive to both the electrolyte conductivity (
Ke) and to the field frequency (
f). Note that
cg depends on the cell thickness, and decreasing
h from 20 μm as used experimentally (
Fig. 2(a)) to typically 5 μm would lead to a more homogeneous electric field giving
cg ≃ 0.86 with, however, a lower associated optical retardation (
δ). Indeed,
δ is related to the induced birefringence (Δ
n) through the thickness of the sample by:
| |  | (2) |
Experimentally, this is measured using a 0–3
λ Berek compensator (Olympus) on cells observed by polarizing microscopy (Olympus BX51) (
Fig. 2(c) to (e)). In order to determine the highest electric stationary birefringence, the polarizer and analyzer are crossed at ±45° with respect to the field direction.
Synchronizing the on/off state of the applied voltage during observation with a CCD camera (JAI, CV-M7), the birefringence relaxation of the sample from a electric-field nematic steady-state back to its isotropic liquid phase (i.e. with no induced birefringence) has been studied. To define precisely the time at which the field is switched off, a light pulse coupled to a static relay is sent to the camera using a small LED inserted above the microscope analyzer. The transmitted intensity of the images recorded at the video rate of 25 frames per second, has been analyzed using an image processing software (ImageJ) allowing for the determination of the relaxation or switching time (τs) of our colloidal suspensions.
Studies of the electro-optical effects in the LaPO4 suspensions have been also conducted in quartz capillaries of diameter h = 1 mm (W. Müller, Germany) by applying the electric field through their walls (10 μm thick) thanks to a home-made setup sketched in Fig. 3(a). The main advantage is to prevent electric sample degradation as electrolysis, faradaic reactions or shortcircuits due to the ions in the electrolyte or to charge injection at the electrodes. In this specific setup, the capillary wall acting as a thin dielectric layer insulates the sample from the electrodes.19,20 The latter ones are made of two parallel aluminum planes with a disc-shaped hole of 1 mm of diameter in their center. Before being inserted in the setup, the capillary has been selected in order to precisely fit into the two holes, allowing for a good mechanical contact between the electrodes and the capillary wall limiting in particular any air layer in between them. In order to determine the field penetration inside the capillary, finite element simulations have been carried out as shown in Fig. 3(b). An estimation of the attenuation factor (cg) has therefore been obtained as a function of the applied voltage frequency (f) and of the inter-electrode distance (d), and the details of the numerical simulations can be found in the ESI.† In particular, the correction factor, cg, for our capillary geometry is almost 1 at high inter-electrode distances, providing a very homogeneous field for probing the electro-optical properties of LaPO4 suspensions. However, this result depends strongly on the field frequency inside the sample, and an additional correction factor, cg′(f), accounting for the accumulation of charges at the dielectric quartz wall/electrolyte interface, has to be added to the calculation of the field in eqn (1). Analytically, this factor can be approximated as:19
| |  | (3) |
with
fc the charge relaxation frequency of the electrolyte (see next paragraph). The frequency
f = 100 kHz at which the Kerr birefringence measurements are performed, results from a balance between both the screening of the field at low frequency due the accumulation of ions near the electrodes as well as the dielectric attenuation factor of the capillary glass wall, and the Kerr effect itself whose coupling decreases at high field frequency, as shown latter in the article. The attenuation factor is thus for this setup geometry
cg′ ≈ 0.43 at
f = 100 kHz.
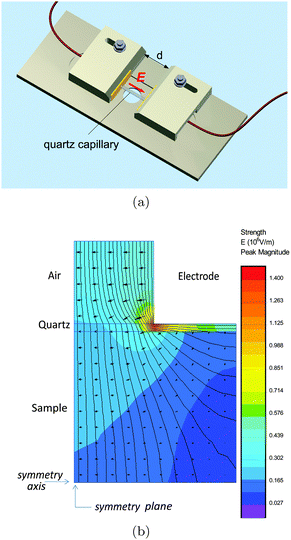 |
| | Fig. 3 (a) Schematic representation of the electro-optical setup used for the study of the nanorod suspensions in capillaries. The yellow part corresponds to the electrodes made of aluminum planes (width: 20 mm, height: 6.5 mm, and thickness: 2 mm). The quartz capillary is 1 mm in diameter and the inter-electrode distance (d) is an experimental tunable parameter. (b) Simulations of the equipotential lines associated with the electric field (f = 100 kHz) where only one quadrant of the setup (d = 500 μm) is shown for symmetry reason. | |
III Experimental results and discussion
A. Kerr effect and relaxation frequency
As first qualitatively reported in Fig. 2, the evolution of the field-induced birefringence as a function of the applied voltage is displayed in Fig. 4. The measurements have been performed in IPS cells in the steady state regime and they have been shown to be fully reversible (by increasing or decreasing the applied voltage).
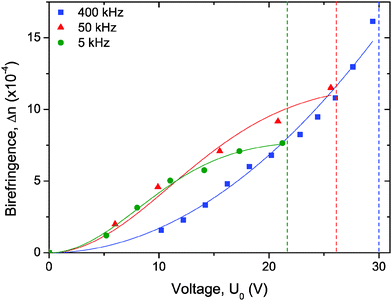 |
| | Fig. 4 Kerr induced birefringence for a sample at ϕ = 0.66% close to the binodal volume fraction measured with an alternative electric field in an IPS cell at three different frequencies. The symbols represent the experimental data and the solid lines the numerical fits according to eqn (4) and (5) for data at 5, 50 and 400 kHz, respectively. The vertical dashed lines represent the voltage above which electric shortcircuits occur in the IPS cells. | |
The induced birefringence and the effective electric field are classically related through a quadratic law, called Kerr effect. As the voltage is kept on increasing, all the nanorods get progressively their orientation driven by the field. The induced birefringence reaches a saturation, and it can then be expressed through the following equation:3
| |  | (4) |
where Δ
nsat and
Esat correspond to the saturation birefringence and field, respectively. Expanding
eqn (4) in the weak field range (
i.e. E ≪
Esat) provides the well-known Kerr law:
where
λ is the light wavelength used for observations (set to 546 nm) and
B is the Kerr coefficient quantifying the coupling between Δ
n and
E. The comparison between the expansion of
eqn (4) at low field and
eqn (5) leads to the expression of the Kerr coefficient when saturation is observed in the sample:
| |  | (6) |
In Fig. 4 two kinds of behavior are displayed: at low frequencies (5 and 50 kHz) a saturation of the birefringence is observed (eqn (4)) while for the highest frequencies (400 kHz) no saturation is obtained for the same range of applied voltage (eqn (5)). Moreover, the voltage at which shortcircuits occur in the IPS cells increases with frequency. The decrease with the frequency of the charge mobility in the electrolyte makes more difficult to induce a continuous path of ionic charges between the electrodes. Therefore, no measurements have been performed at frequencies lower than 5 kHz where shortcircuits occur too quickly. This frequency dependence is also observed quantitatively for a pure (i.e. without LaPO4 particles) electrolyte of ethylene glycol with, as expected, a shortcircuit voltage which increases by decreasing the conductivity (see additional measurements in ESI†). It is worth mentioning that Δnsat exhibits an unexpected frequency dependence (Fig. 4) considering that Δnsat corresponds by definition to a perfect alignment of the rods (with an associated orientational order parameter Ssat = 1). We speculate that such anomalous behavior could be attributed to some thermal disturbance stemming from charge injection at the electrodes affecting the electric field at saturation Esat.
As we shall see, the coupling of the Kerr birefringence with the electric field shown in Fig. 4 can be quantitatively accounted by a frequency dependence of the electric polarizability of our rod-like colloidal particles formulated in the extended Maxwell–Wagner framework. Specifically, the induced dipole moment associated with the rod-like colloids arises from the complex dielectric mismatch between the electrolyte and the particles. The charge relaxation time, τ, necessary for the formation of a field-induced dipole associated with the free charges (and therefore with conductivity) near the surfaces corresponds to the time for which ionic migration starts to contribute31 and is therefore given by the duration of the screening process in the electrolyte:23,32
| |  | (7) |
where
D is the diffusion coefficient of the ions and
κ−1 the Debye screening length, defined as:
| |  | (8) |
with
ε0 the vacuum permittivity,
εe the dielectric constant of the electrolyte (
εe = 37 for ethylene glycol),
e the elementary charge and
I the ionic strength. The corresponding cut-off frequency,
fc, is:
| |  | (9) |
LaPO
4 nanorods are positively charged in ethylene glycol according to zeta-potential measurement (
ζ = +97 mV, see ESI
†), thanks to the excess of La
3+ ions close to the particle surface. When dialyzed from nitric acid solution to ethylene glycol, the ions maintaining electro-neutrality of the dispersion are therefore the counterions associated with the rod-like particles,
i.e. NO
3−.
30 The ionic diffusion coefficient can be calculated according to:
| |  | (10) |
with
kB the Boltzmann constant,
Na the Avogadro's number,
F the Faraday constant,
T the temperature (set to 298 K),
μ the mobility of the ion and
z its valence. The mobility of the NO
3− ions is expressed as:
| |  | (11) |
with
ΛNO3− the molar conductivity of the ion in a given electrolyte. In water the reported value

yields

. Assuming a simple hydrodynamic model
33–35 where this mobility is inversely proportional to the viscosity of the solvent, the ionic mobility can be extrapolated in ethylene glycol:
| |  | (12) |
with
ηwater = 0.9 × 10
−3 Pa s and
ηEG = 16 × 10
−3 Pa s the viscosities of water and ethylene glycol at 298 K, respectively.
36
Finally, the conductivity (Ke) of the electrolyte is introduced:
| |  | (13) |
with
ci the ionic molar concentration of the monovalent salt in solution. Assuming that NO
3− are the main mobile ions in the electrolyte and substituting
eqn (10), (11) and (8) in
eqn (13) yields:
which then coincides, according to
eqn (9), with the well-know formulation of the charge relaxation frequency:
| |  | (15) |
Fig. 5 displays the operating voltage necessary to apply in order to maintain constant a given birefringence while the frequency is varied. The main difference between the two setups (Fig. 2 and 3) occurs in the low frequency regime where a strong screening of the field due to the quartz capillary wall is observed. A similar behavior between the two setups is however observed for high frequencies, which is attributed to Debye-type relaxation of the polarization mechanism. Therefore, in the case of externally applied electric field using quartz capillary, the Kerr coefficient determination has been done at f = 100 kHz, the optimal frequency for which the coupling between the electric field inside the sample and the induced birefringence is the strongest (see ESI†).
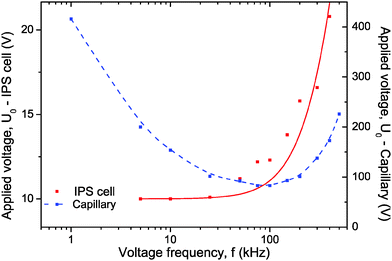 |
| | Fig. 5 Applied voltage as a function of the frequency to maintain constant the Kerr induced birefringence of Δn = 3.5 × 10⁻⁴ and of Δn = 1 × 10⁻⁵ in the geometry of an IPS cell (h = 20 μm and d = 15 μm; red symbols) and of a cylindrical capillary (h = 1 mm and d = 461 μm; blue symbols), respectively. The sample concentration is Φ = 0.66%. The red solid line corresponds to the numerical fit using eqn (19) and the dashed blue line is a guide for the eye. | |
The Maxwell–Wagner polarizability is at the origin of coupling with the electric field of the rod-like particles having a volume Vp and a conductivity Kp, and it can be expressed for the directions parallel (‖) or perpendicular (⊥) to the rod long axis as follows:17,19,37
| |  | (16) |
where
εp* =
εp +
iKp/(
ε0ω) and
εe* =
εe +
iKe/(
ε0ω) represent the complex dielectric permittivities of the particles and the electrolyte respectively, and
L‖,⊥ are the depolarization factors. To show its Debye-type frequency dependence, the polarizability can be expressed as:
| |  | (17) |
with
α0‖,⊥ and
α∞‖,⊥ the low and the high frequency electric polarizabilites respectively,
ω the angular frequency of the applied sinusoidal electric field (
ω = 2π
f) and
τ‖,⊥ the Maxwell–Wagner relaxation time given by:
17,23| |  | (18) |
The depolarization factors
L‖ and
L⊥ are related through
L⊥=(1 −
L‖)/2 and have been calculated explicitly in the case of prolate spheroids.
23 In the needle-like limit (
L ≫
D), the depolarization factors can be strongly simplified and approximated as
L‖ ≈ 0 and
L⊥ ≈ ½. In case of slender rod-like particle when only polarization along the rod is considered,
eqn (18) is reduced to
τMW ≈
τ‖ ≈
ε0εe/
Ke which corresponds in this limit to the charge relaxation time
τc according to
eqn (9) and (15). Thus, when rod-like particles are long enough (which means
L/
D >
Kp/
Ke), a single frequency, corresponding to the charge relaxation frequency
fc, accounts for the frequency behavior of needle-like nanoparticle dispersions.
Assuming such kind of Debye-type frequency dependence and because the polarizability of the particles is proportional to the Kerr coefficient B, eqn (5) provides then the frequency dependence of the applied voltage (U0):
| |  | (19) |
The experimental data (red symbols in
Fig. 5) obtained in the IPS cell have been numerically fitted (red solid line) according to
eqn (19) to get the charge relaxation frequency of the system:
Replacing
fc in
eqn (9) provides the Debye screening length in our nanorod suspension,
κ−1 = 9 nm. The ionic strength
I can then be directly deduced from
eqn (8), which gives
I = 0.5 mM in very good agreement with the value obtained from the phase diagram of LaPO
4 nanorod suspensions reported previously.
30 According to
eqn (14), the conductivity of the electrolyte can be also extracted:
Ke = 4.3 × 10
−4 S m
−1 at
I = 0.5 mM. This value is in very good agreement with the single point measurement of the conductivity performed at a rod volume fraction of
ϕ = 0.6%, and which gives 5.4 × 10
−4 S m
−1.
B. Determination of the Kerr coefficient and comparison with Maxwell–Wagner–O'Konski theory
A general expression of the Kerr coefficient has been derived by Saville et al.,37 and B can be written as a function of the anisotropy of excess polarizability, Δα = α‖ − α⊥:| |  | (21) |
where Δnp is the extrapolated saturated birefringence at ϕ = 1, which has been estimated to be Δnp ≈ 0.1 in a previous work.30 Note that the volume fraction dependence in  where ϕB is the binodal volume fraction at the isotropic-to-nematic phase transition, is accounted through an Onsager-like approach,17,19,38 and leads to a linear dependence with the rod concentration for very dilute suspensions. Fig. 6 displays the evolution of the Kerr coefficient as a function of ϕ and plotted for three different frequencies (see ESI† for the data of the induced birefringence from which the Kerr coefficients have been obtained). Let's define the ϕ-independent specific Kerr coefficient B0 as:
| |  | (22) |
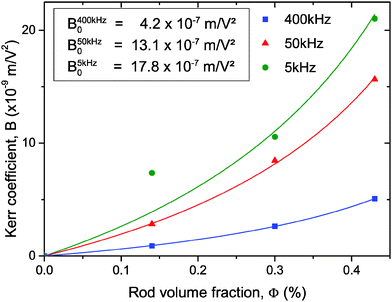 |
| | Fig. 6 Dependence of the Kerr coefficient B with the LaPO4 rod volume fraction obtained at different frequencies. The effective electric field has been used to account for the attenuation due to the IPS cell geometry. The symbols correspond to the experimental data and the solid lines are their corresponding numerical fits (proportional to ϕ/(1 − ϕ/ϕB)) from which the ϕ-independent specific Kerr coefficient B0 has been extracted. | |
The experimental values of B0 at the three studied frequencies can be found for the IPS cell in the inset of Fig. 6 and in Fig. 7. Similarly, the specific Kerr coefficient has been determined at f = 100 kHz for externally applied electric field through a capillary wall (see ESI†) and is reported in Fig. 7. The latter value is in good agreement with the ones obtained in the IPS cells for the same range of frequency (Fig. 6) and after correction of the electric field attenuation in both setup geometries. According to eqn (21), comparison between experimental and theoretically predicted Kerr coefficients is done by the determination of the excess polarizability Δα. The Debye-type frequency dependence of the polarizability (eqn (17)) applied for slender rods (L ≫ D for which L‖ ≈ 0 and L⊥ ≈ ½) leads to the following anisotropy of polarizability in the low (Δα0) and high (Δα∞) frequency limit, respectively:
| |  | (23) |
| |  | (24) |
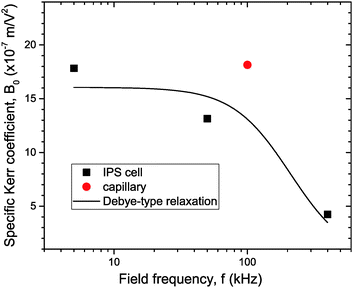 |
| | Fig. 7 Specific Kerr coefficient B0 at different frequencies obtained in the geometry of directly applied (IPS cell; black squares) or externally applied (quartz capillary; red dot) electric field. In both cases, the effective electric field inside the sample has been calculated to account for its attenuation by the setup. The solid line is a numerical fit corresponding to a Debye-type relaxation (eqn (17)) with fc = 210 kHz. | |
The latter one in eqn (24) corresponds to the polarization mechanism due to dielectric contrast between the particles and the surrounding medium. Assuming a typical particle dielectric constant of εp ≈ 3 providing almost the highest dielectric mismatch possible for this system, this yields Δα∞/kBT ≈ 2 × 10⁻¹² m2 V−2 and therefore B∞0 = 2 × 10⁻⁸ m V−2 according to eqn (21), which is more than one order of magnitude smaller than the experimental value at the highest frequency of 400 kHz (Fig. 6 and 7). In a similar way but in the opposite limit of frequency, the contrast of the two conductivities Kp and Ke represents the low frequency limit of the Maxwell–Wagner contribution. The conductivity Kp of the particles has been reported for similar lanthanide phosphate nanorods exhibiting the same morphology: Kp = 6 × 10⁻⁴ S m−1.39 Using Ke = 4.3 × 10⁻⁴ S m−1 determined in the previous section, eqn (23) leads then to Δα0/kBT ≈ 10−13 m2 V−2 and therefore B00 = 10−9 m V−2 ≪ Bexp0 ≈ 10−6 m V−2 as reported in Fig. 6 and 7. Neither the dielectric contrast nor the contrast of conductivities are able to account for the polarizability excess observed experimentally. However, in the case of charged particles, a third polarization mechanism has to be considered, as first introduced by O'Konski who has shown the importance of the electrical double layer polarization.24 This results in a strongly enhanced effective conductivity (Keffp) at the electrolyte/particle interface that has to be substituted in the Maxwell–Wagner formalism (eqn (16), (17) and (18)):
| | | Keffp,‖,⊥ = Kp + 2Kσ/a‖,⊥ | (25) |
where
Kσ represents the surface contribution to the conductivity and
a‖,⊥ is an effective length depending on the geometric factors of the particle.
23 Taking advantage from the high aspect ratio of the LaPO
4 rods (
L ≫
D), only the polarization along the rod long axis is considered, neglecting then the normal polarization. In these conditions, the effective conductivity can be expressed as
Keffp =
Kp + 2
Kσ/
R where
a‖ ≡
R =
D/2 is the radius of the LaPO
4 particle. Assuming that the surface conductivity can be approximated by:
17,19| |  | (26) |
with
qEG the surface charge density of the LaPO
4 rod in ethylene glycol related to the zeta-potential
ζ for monovalent electrolyte through:
37| |  | (27) |
this gives
qEG = 6 × 10
−3 C m
−2 with
ζ = +97 mV, and therefore a surface conductivity
Kσ = 2.5 × 10
−11 S. Since
Kp ≪
Kσ/
R, the equivalent conductivity contrast related to the so-called Dukhin number,
23 gives
Keffp/
Ke ≃ 2/
R ×
Kσ/
Ke ≃ 21. According to the extended Maxwell–Wagner–O'Konski (MWO) theory where the conductivity is replaced in
eqn (23) by the effective conductivity
Keffp,
19,23,37 the associated excess polarizability can be written as:
| |  | (28) |
This provides Δ
αMWO/
kBT ≈ 3 × 10
−11 m
2 V
−2 and therefore
BMWO0 = 4 × 10
−7 m V
−2 according to
eqn (21). This value is very consistent with the specific Kerr coefficients reported experimentally in
Fig. 7, especially by considering the approximations we performed. Furthermore, this demonstrates that the polarization of the electric double layer is the prevailing mechanism for the coupling with the electric field of our LaPO
4 colloidal rods dispersed in ethylene glycol.
The corresponding cut-off frequency fMWO‖,⊥ is related to the relaxation time τ‖,⊥ (eqn (16)) which has to be written within the extended Maxwell–Wagner–O'Konski model.17,23 In case of slender rod-like particles when only polarization along the rods is considered and which satisfy L/D > Keffp/Ke ≫ 1, eqn (18) is simplified into fMWO ≈ fMWO‖ ≈ fMW‖ ≈ Ke/(2πε0εe) ≡ fc, which corresponds again to the charge relaxation frequency fc reported in eqn (15). Therefore a numerical fit assuming a Debye-type relaxation (eqn (17)) with fc = 210 kHz has been performed as reported in Fig. 7, showing that polarization of the particle ionic cloud does not only account for the right amplitude of the Kerr effect coefficients, but also accounts very well for their frequency dependence.
C. Switching time (on/off states)
Beyond the coupling with the electric field, investigations on the time response of the LaPO4 colloidal rod suspensions have been performed, as displayed in Fig. 8. For a frequency of 5 kHz, the induced birefringence is brought to saturation (Δnsat, see Fig. 4) in a steady-state regime. The applied voltage is then quickly switched off (setting the origin of time in Fig. 8) and the relaxation into the isotropic liquid state (i.e. with no birefringence) occurs in two steps. First, a fast decay of the transmitted light intensity takes place when the particles lose their orientation; second, a slight increase of the birefringence is observed, as already reported in other self-organized systems.13 We interpret the latter behavior as a reminiscent planar anchoring of the particles on the glass substrates, which leads then to a residual nematic-like order close to the interface.
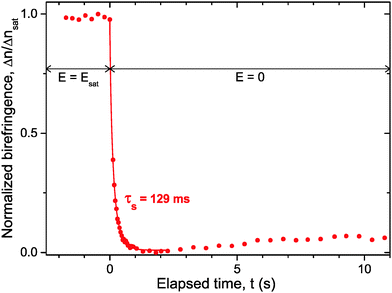 |
| | Fig. 8 Switching time associated with the relaxation of the Kerr induced birefringence when the electric field is turned off. Experiment performed in an IPS cell at f = 5 kHz for a sample having a rod volume fraction of ϕ = 0.66%. The red solid line represents the numerical fit using a stretched-exponential decay (eqn (29)) and the corresponding time scale is provided. | |
From the numerical fit using a stretched-exponential form of the type:40
| | Δn = Δnsat![[thin space (1/6-em)]](https://www.rsc.org/images/entities/char_2009.gif) exp(−(t/τs)γ), 0 ≤ γ ≤ 1 exp(−(t/τs)γ), 0 ≤ γ ≤ 1 | (29) |
the time response of the suspensions has been extracted giving
τs = 129 ms (with
γ ≃ 0.8) as shown in
Fig. 8. The rod polydispersity leads to a distribution of relaxation times implying the expression used in
eqn (29), reducing to
γ = 1 in the simplest case of monodisperse particles. The switching time
τs found in our system is too slow for a use of these colloidal suspensions in displays but is fast enough to consider potential application in devices such as smart windows or lenses. Note that the relaxation of the Kerr birefringence back to the isotropic liquid state stems from the thermal diffusion randomizing the particle orientation initially driven by the electric field. Therefore, the rotational diffusion coefficient (
Dr) can be extracted from the time response
τsvia τs = 1/6
Dr.
41,42 As the rod volume fraction used in the experiment (
ϕ = 0.66%) is close to the binodal value and corresponds to the semi-dilute regime where the motion of each rod is hindered by its neighbors, this results in a decrease of the rotational diffusion compared to free rods, and
Dr has then the following form:
43| |  | (30) |
where
β is a proportionality constant.
Eqn (30) yields an associated time of about 100 ms with
β ≃ 0.5 consistent with the response time
τs obtained experimentally (
Fig. 8).
IV Conclusions
In this paper, we present a study of the Kerr induced birefringence in concentrated isotropic liquid suspensions of LaPO4 nanorods in ethylene glycol. The response of the system was probed both in an In-Plane Switching cells in which the electrodes are in direct contact with the sample, and also in the geometry of externally applied field. In the latter case, the electric field is applied through and parallel to a capillary quartz wall, limiting its attenuation and avoiding electric damage such as charge injection at the electrodes. A quantitative analysis using the Maxwell–Wagner–O'Konski theory shows that the Kerr birefringence is mainly the result of the polarization of the electric double layer of the rod-like particles. The typical value of the specific (i.e. ϕ → 0) Kerr coefficient obtained in our system is of about B0 ∼ 10−6 m V−2 which is several orders of magnitude higher than usual thermotropic compounds4 including liquid-crystalline blue phases.3,6,8 Moreover, the coupling with the electric field is also very similar to other aqueous systems of rod-like or plate-like particles19,22,41 showing therefore that ethylene glycol as electrolyte combined with well-defined anisometric nanoparticles represent a promising way for their use in electro-optical devices.
Author contributions
EG designed research; AC performed the experiments and collected the data; PM and EG designed the experimental setups; PM performed the numerical simulations; the LPMC group (JWK, KL, JPB, TG) synthesized the samples; EG and AC interpreted the experiments and wrote the paper. All the authors discussed the manuscript.
Acknowledgements
We would like to thank J. Giermanska for her help in the zeta-potential measurement, Essilor Int. for preliminary discussion, and I. Dozov for fruitful comments.
References
-
W. den Boer, Active Matrix Liquid Crystal Displays, Elsevier Science and Technology Books, 2005 Search PubMed.
- P. Kirsch and M. Bremer, Angew. Chem., Int. Ed., 2000, 39, 4216 CrossRef CAS.
- J. Yan, H.-C. Cheng, S. Gauza, Y. Li, M. Jiao, L. Rao and S.-T. Wu, Appl. Phys. Lett., 2010, 96, 071105 CrossRef PubMed.
- A. Ghanadzadeh Gilani and M. S. Beevers, J. Mol. Liq., 2001, 92, 217 CrossRef.
- K. V. Le, S. Aya, Y. Sasaki, H. Choi, F. Araoka, K. Ema, J. Mieczkowski, A. Jakli, K. Ishikawaa and H. Takezoe, J. Mater. Chem., 2011, 21, 2855 RSC.
- G. Nordendorf, A. Lorenz, A. Hoischen, J. Schmidtke, H. S. Kitzerow, D. Wilkes and M. Wittek, J. Appl. Phys., 2013, 114, 173104 CrossRef PubMed.
- J. Yan, L. Rao, M. Jiao, Y. Li, H.-C. Cheng and S.-T. Wu, J. Mater. Chem., 2011, 21, 7870 RSC.
- Y. Hisakado, H. Kikuchi, T. Nagamura and T. Kajiyama, Adv. Mater., 2005, 17, 96 CrossRef CAS PubMed.
- G. Nordendorf, A. Hoischen, J. Schmidtke, D. Wilkes and H. S. Kitzerow, Polym. Adv. Technol., 2014, 25, 1195 CrossRef CAS PubMed.
- A. B. G. M. Leferink op Reininka, E. van den Pol, A. V. Petukhov, G. J. Vroege and H. N. W. Lekkerkerker, Eur. Phys. J.: Spec. Top., 2013, 222, 3053 CrossRef CAS PubMed.
- J. K. G. Dhont and K. Kang, Eur. Phys. J. E: Soft Matter Biol. Phys., 2010, 33, 51 CrossRef CAS PubMed.
- J. K. G. Dhont and K. Kang, Eur. Phys. J. E: Soft Matter Biol. Phys., 2011, 34, 40 CrossRef PubMed.
- A. Eremin, R. Stannarius, S. Klein, J. Heuer and R. M. Richardson, Adv. Funct. Mater., 2011, 21, 556 CrossRef CAS PubMed.
- K. May, R. Stannarius, S. Klein and A. Eremin, Langmuir, 2014, 30, 7070 CrossRef CAS PubMed.
- A. Kuijk, T. Troppenz, L. Filion, A. Imhof, R. van Roij, M. Dijkstra and A. van Blaaderen, Soft Matter, 2014, 10, 6249 RSC.
- B. Liu, T. H. Besseling, M. Hermes, A. F. Demirörs, A. Imhof and A. van Blaaderen, Nat. Commun., 2014, 5, 3092 Search PubMed.
- T.-Z. Shen, S.-H. Hong and J.-K. Song, Nat. Mater., 2014, 13, 394 CrossRef CAS PubMed.
- S.-H. Hong, T.-Z. Shen and J.-K. Song, J. Phys. Chem. C, 2014, 118, 26304 CAS.
- I. Dozov, E. Paineau, P. Davidson, K. Antonova, C. Baravian, I. Bihannic and L. J. Michot, J. Phys. Chem. B, 2011, 115, 7751 CrossRef CAS PubMed.
- K. Antonova, I. Dozov, P. Davidson, E. Paineau, C. Baravian, I. Bihannic and L. J. Michot, Bulg. J. Phys., 2012, 39, 72–91 CAS.
- E. Paineau, I. Dozov, A.-M. Philippe, I. Bihannic, F. Meneau, C. Baravian, L. J. Michot and P. Davidson, J. Phys. Chem. B, 2012, 116, 13516 CrossRef CAS PubMed.
- T. Bellini, F. Mantegazza, V. Degiorgio, R. Avallone and D. A. Saville, Phys. Rev. Lett., 1999, 82, 5160 CrossRef CAS.
-
V. N. Shilov, Yu. B. Borkovskaja and S. N. Budankova, in Molecular and Colloidal Electro-optics, ed. S. P. Stoylov and M. V. Stoimenova, Surfactant Science Series, vol. 133, Taylor & Francis, 2006 Search PubMed.
- C. T. O'Konski, J. Phys. Chem., 1960, 64, 605 CrossRef.
-
M. Leunissen, Manipulating Colloids with Charges and Electric Fields, PhD thesis, University of Utrecht, 2007 Search PubMed.
- F. Mantegazza, T. Bellini, M. Buscaglia, V. Degiorgio and D. A. Saville, J. Chem. Phys., 2000, 113, 6984 CrossRef CAS PubMed.
- T. Bellini, V. Degiorgio and F. Mantegaza, Colloids Surf., A, 1998, 140, 103 CrossRef.
- V. Digiorgio, T. Bellini and F. Mantegazza, Colloids Surf., A, 2001, 183–185, 183 CrossRef.
- O. D. Velev and K. H. Bhatt, Soft Matter, 2006, 2, 738 RSC.
- J. Kim, A. de la Cotte, R. Deloncle, S. Archambeau, C. Biver, J.-P. Cano, K. Lahlil, J.-P. Boilot, E. Grelet and T. Gacoin, Adv. Funct. Mater., 2012, 22, 4949 CrossRef CAS PubMed.
- V. N. Shilov, A. V. Delgado, F. Gonzalez-Caballero, J. Horno, J. J. Lopez-Garcia and C. Grosse, J. Colloid Interface Sci., 2000, 232, 141 CrossRef CAS PubMed.
-
W. B. Russel, D. A. Saville and W. R. Schowalter, Colloidal Dispersions, Cambridge University Press, 1989, Ch. 7 Search PubMed.
- A. Voronel, E. Veliyulin and V. Sh. Machavariani, Phys. Rev. Lett., 1998, 80, 2630 CrossRef CAS.
- S. Koneshan, J. S. Rasaiah, R. M. Lynden-Bell and S. H. Lee, J. Phys. Chem. B, 1998, 102, 4193 CrossRef CAS.
- S. Koneshan, R. M. Lynden-Bell and J. C. Rasaiah, J. Am. Chem. Soc., 1998, 120, 12041 CrossRef CAS.
-
D. S. Viswanath, T. Ghosh, D. H. L. Prasad, N. V. K. Dutt and K. Y. Rani, Viscosity of Liquids: Theory, Estimation, Experiment and Data, Springer, 2007 Search PubMed.
- D. A. Saville, T. Bellini, V. Degiorgio and F. Mantegazza, J. Chem. Phys., 2000, 113, 6974 CrossRef CAS PubMed.
- D. van der Beek, A. V. Petukhov, P. Davidson, J. Ferré, J. P. Jamet, H. H. Wensink, G. J. Vroege, W. Bras and H. N. W. Lekkerkerker, Phys. Rev. E: Stat., Nonlinear, Soft Matter Phys., 2006, 73, 041402 CrossRef CAS.
- H. Wang, G. Li, X. Guan and L. Li, J. Alloys Compd., 2011, 509, 4160 CrossRef CAS PubMed.
- V. Degiorgio, T. Bellini, R. Piazza, F. Mantegazza and R. E. Goldstein, Phys. Rev. Lett., 1990, 64, 1043 CrossRef CAS.
- M. L. Jimenez, L. Fornasari, F. Mantegazza, M. C. D. Mourad and T. Bellini, Langmuir, 2012, 28, 251 CrossRef CAS PubMed.
- V. Peikov, R. Sasai, M. Tanilgawa, I. Petkanchin and K. Yamaoka, J. Colloid Interface Sci., 2006, 295, 445 CrossRef CAS PubMed.
-
R. Pecora, Dynamic Light Scattering. Applications of Photon Correlation Spectroscopy, Plenum, New York, 1985 Search PubMed.
Footnote |
| † Electronic supplementary information (ESI) available. See DOI: 10.1039/c5sm01427a |
|
| This journal is © The Royal Society of Chemistry 2015 |
Click here to see how this site uses Cookies. View our privacy policy here.  Open Access Article


 yields
  . Assuming a simple hydrodynamic model33–35 where this mobility is inversely proportional to the viscosity of the solvent, the ionic mobility can be extrapolated in ethylene glycol:


 where ϕB is the binodal volume fraction at the isotropic-to-nematic phase transition, is accounted through an Onsager-like approach,17,19,38 and leads to a linear dependence with the rod concentration for very dilute suspensions. Fig. 6 displays the evolution of the Kerr coefficient as a function of ϕ and plotted for three different frequencies (see ESI† for the data of the induced birefringence from which the Kerr coefficients have been obtained). Let's define the ϕ-independent specific Kerr coefficient B0 as:


![[thin space (1/6-em)]](https://www.rsc.org/images/entities/char_2009.gif) exp(−(t/τs)γ), 0 ≤ γ ≤ 1
exp(−(t/τs)γ), 0 ≤ γ ≤ 1


