
 Open Access Article
 This Open Access Article is licensed under a
 Creative Commons Attribution 3.0 Unported Licence
Nucleation of symmetric domains in the coupled leaflets of a bilayer
J. J.
Williamson
* and
P. D.
Olmsted
Department of Physics, Institute for Soft Matter Synthesis and Metrology, Georgetown University, 37th and O Streets, N.W., Washington, D.C. 20057, USA. E-mail: johnjosephwilliamson@gmail.com; pdo7@georgetown.edu
First published on 28th September 2015
Abstract
We study the kinetics governing the attainment of inter-leaflet domain symmetry in a phase-separating amphiphilic bilayer. “Indirect” inter-leaflet coupling via hydrophobic mismatch can induce an instability towards a metastable pattern of locally asymmetric domains upon quenching from high temperature. This necessitates a nucleation step to form the conventional symmetric domains, which are favoured by a “direct” inter-leaflet coupling. We model the energetics for a symmetric domain to nucleate from the metastable state, and find that an interplay between hydrophobic mismatch and thickness stretching/compression causes the effective hydrophobic mismatch, and thus line tension, to depend on domain size. This leads to strong departure from classical nucleation theory. We speculate on implications for cell membrane rafts or clusters, whose size may be of similar magnitude to estimated critical radii for domain symmetry.
I Introduction
A phase-separating lipid (or other amphiphilic) bilayer may access competing equilibrium and metastable phase coexistences, due to the presence of two leaflets subject to competing inter-leaflet couplings (Fig. 1, 2a).1,2 A “direct” inter-leaflet coupling3–7 promotes registered (R) bilayer phases, in which both leaflets are locally dominated by the same species. An “indirect” coupling from hydrophobic tail length mismatch favours uniform bilayer thickness8–11 and thus promotes antiregistered (AR) phases, in which the leaflets are dominated by different species so that the bilayer is locally compositionally asymmetric. Depending on the choice of overall leaflet compositions, two (e.g., R–R or AR–AR) or three bilayer phases may coexist. For example, asymmetric overall leaflet compositions can lead to two approximately symmetric bilayer phases and a highly asymmetric one (R–R–AR), first observed and explained in ref. 6. Phase equilibria of coupled bilayer leaflets were subsequently studied using phenomenological free energies.3,5,12 However, a full description of the indirect coupling described above requires a model that microscopically incorporates hydrophobic mismatch.1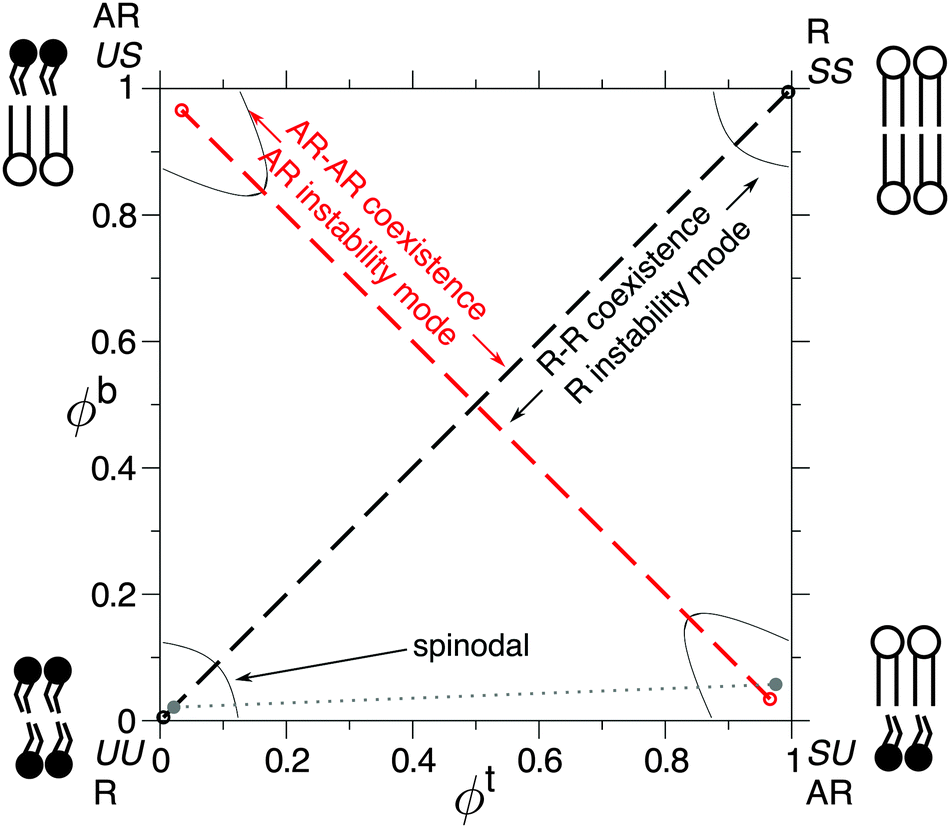 | ||
| Fig. 1 Partial phase diagram showing competing equilibrium R–R (black) and metastable AR–AR (red) phase coexistences.1 Spinodals enclose the regions of local stability. Cartoons of the dominant inter-leaflet arrangement in each bilayer phase are shown. The grey dotted line illustrates R–AR coexistence, which is briefly discussed in Section III A. Other phase coexistences not considered here are omitted.1 Parameters: Δ0 = 2a, κ = 3a−2kBT, V = 0.6kBT, J = 4a−2kBT, B = 0.48a−2kBT. | ||
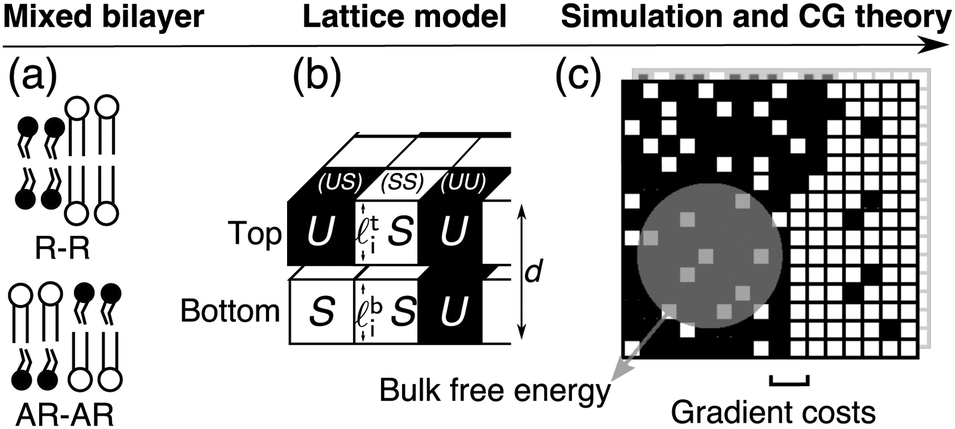 | ||
| Fig. 2 (a) Mixed bilayer containing S and U (Lo or gel, and Ld-like) model species, illustrating the locally symmetric (R–R) and locally asymmetric (AR–AR) phase coexistences considered here. (b) Microscopic lattice model for coupled leaflets, which can be coarse-grained (CG) (c) to give the mean-field free-energy density f(ϕt, ϕb) as a function of locally-averaged leaflet compositions, and analysed for kinetics of domain formation with the inclusion of gradient costs for domain boundaries.1 The lattice model can also be directly simulated. | ||
Using such a model, we have shown how coexistence of antiregistered phases can be kinetically preferred due to the effect of hydrophobic mismatch1 so that, before equilibrating, a quenched bilayer must escape a (typically metastable) locally asymmetric state. The understanding of this novel statistical thermodynamics will allow greater control over artificial membranes, and the underlying interactions are expected to play a role in transmembrane organisation of rafts or clusters in vivo, with possible relevance to signalling13 and anaesthetic action.10 The predicted behaviour constitutes an example of Ostwald's “rule of stages”,14 by which a system will pass through available metastable states on its way to equilibrium. Ostwald's rule is familiar (via different origins) in colloids, metallurgy and drug design.
Immediately after quenching a bilayer to a phase-separating region of parameter space, any spinodal instabilities to which the uniform state is subject compete to determine the dominant initial demixing mode. A bilayer with roughly equimolar composition in each leaflet15 can be subject both to an “R mode” with composition perturbations locally symmetric between leaflets, and a perpendicular AR mode with asymmetric perturbations (Fig. 1). If the AR mode is fastest-growing, spinodal decomposition to AR–AR coexistence occurs first, leading to local asymmetry throughout the bilayer. To equilibrate to R–R from a metastable AR–AR state, the bilayer must undergo nucleation of registered bilayer phases. Hence, three classes of kinetics arise: direct separation into equilibrium phases, equilibration via nucleation out of a metastable state, or trapping in a metastable state. For other overall compositions subject to competing instabilities, the competition of symmetric and asymmetric phases is qualitatively similar,2 though more complex.
In this paper, we focus on the nucleation energetics that determine whether equilibrium domain symmetry is reached from a metastable state. First, we introduce the model and discuss the interpretation of bilayer domain symmetry and asymmetry via phase diagrams with a composition axis for each leaflet, with reference to existing experiment and theory. We then identify the three classes of kinetics in simulation, guided by a linear instability analysis, and develop a theory for the nucleation of registered domains, which captures the interplay of bulk free energy with thickness mismatch occurring at the perimeter of a registered domain. Together with the linear stability analysis, the calculated nucleation energetics are consistent with the simulation results. We find that the effective hydrophobic mismatch between a domain and its surroundings is domain size-dependent, which causes strong departure from classical nucleation theory.
II Model
A detailed description of the model appears in ref. 1 and 2. We briefly recapitulate the model and its analysis in terms of phase diagrams and kinetics. A schematic of the lattice model and how it is coarse-grained is shown in Fig. 2.A. Lattice model
A local bilayer patch is described as N lattice sites with top (t) and bottom (b)-leaflet lipids (Fig. 2b). The lipids' hydrophobic lengths![[small script l]](https://www.rsc.org/images/entities/char_e146.gif) t(b)i lead to the total bilayer thickness di ≡ ti + bi and inter-leaflet difference Δi ≡ ti − bi. Model species S and U represent saturated and unsaturated lipids or, e.g., the liquid-ordered (Lo) and liquid-disordered (Ld) states in a ternary mixture.2
t(b)i lead to the total bilayer thickness di ≡ ti + bi and inter-leaflet difference Δi ≡ ti − bi. Model species S and U represent saturated and unsaturated lipids or, e.g., the liquid-ordered (Lo) and liquid-disordered (Ld) states in a ternary mixture.2
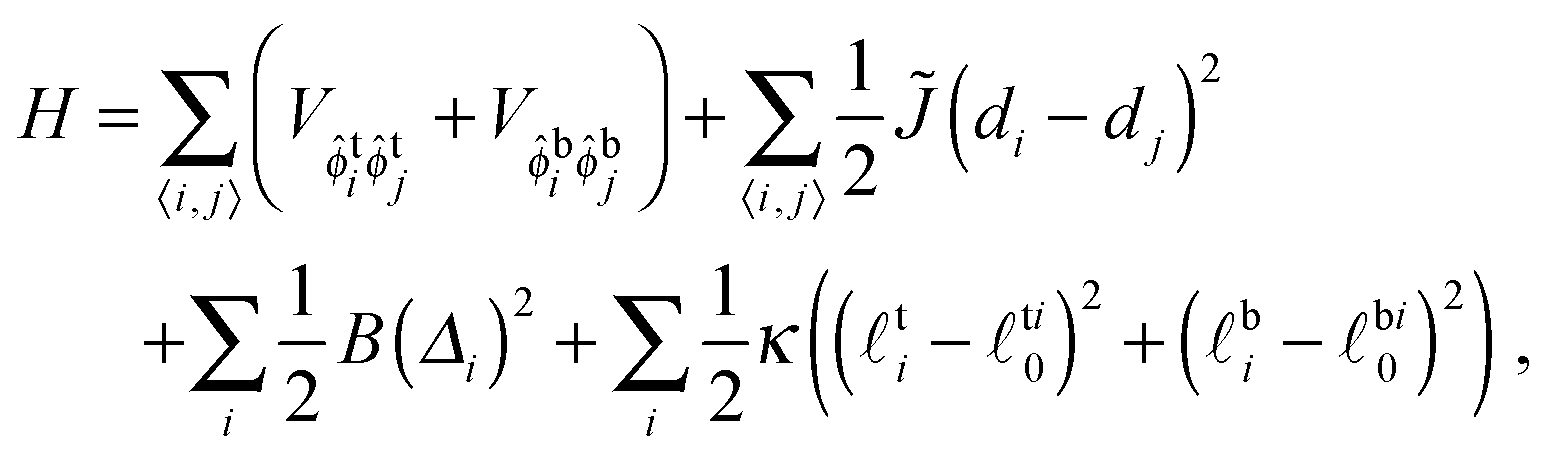
The Hamiltonian is
 | (1) |
![[small phi, Greek, circumflex]](https://www.rsc.org/images/entities/i_char_e0b5.gif) t(b)i = 1 if the top (bottom) of lattice site i contains an S lipid, t(b)i = 0 if U. The species-dependent ideal (i.e., preferred) hydrophobic tail lengths are t(b)i0 = S0 for an S lipid at the top (bottom) of site i, or U0 for U, and each site is pairwise registered (R, SS or UU) or antiregistered (AR, SU or US).
t(b)i = 1 if the top (bottom) of lattice site i contains an S lipid, t(b)i = 0 if U. The species-dependent ideal (i.e., preferred) hydrophobic tail lengths are t(b)i0 = S0 for an S lipid at the top (bottom) of site i, or U0 for U, and each site is pairwise registered (R, SS or UU) or antiregistered (AR, SU or US).
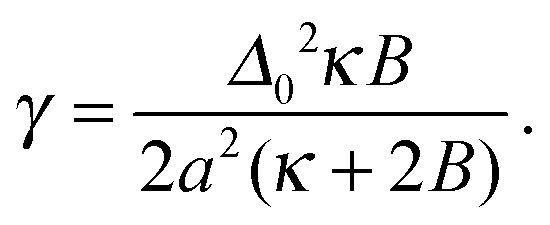
V ≡ V10 − ½(V00 + V11) quantifies purely intra-leaflet interactions, such as those between headgroups. The “direct” coupling B promotes pairwise R between lipids, nominally by penalising tail structure mismatch (which we treat as implicit in tail length mismatch16) across the midplane. The particular mechanisms responsible for the direct coupling are not crucial to our model, however – for comparison with the literature we can simply estimate an effective strength of the conventional inter-leaflet mismatch energy γ,1 which is shown on Fig. 3 as well.4,5,7,17–19 The hydrophobic “indirect” coupling ![[J with combining tilde]](https://www.rsc.org/images/entities/i_char_004a_0303.gif) promotes pairwise AR, by penalising mismatch in the bilayer thickness profile. We also define J ≡ 4, which appears in the mean-field approximation of eqn (1) used to derive the coarse-grained free energy. κ can be related to the area compression modulus κA,1 and penalises variation from species-dependent ideal length. Weaker κ means the species can more easily adapt their tail length and structure to one another's presence. The mismatch parameter Δ0 ≡ S0 − U0 is cast as a length, but represents both tail length mismatch and structure mismatch; it couples to both the indirect and direct inter-leaflet couplings, J and B. Once fiducial values of the parameters are set, varying J alone approximates changing the mismatch in tail length but not structure (e.g., adding carbons to one species9), while varying B alone approximates varying the mismatch in tail structure, e.g., unsaturation. We arbitrarily choose S0 > U0. The reference total thickness d0 ≡ S0 + U0 is irrelevant in the absence of an external field acting on bilayer thickness.
promotes pairwise AR, by penalising mismatch in the bilayer thickness profile. We also define J ≡ 4, which appears in the mean-field approximation of eqn (1) used to derive the coarse-grained free energy. κ can be related to the area compression modulus κA,1 and penalises variation from species-dependent ideal length. Weaker κ means the species can more easily adapt their tail length and structure to one another's presence. The mismatch parameter Δ0 ≡ S0 − U0 is cast as a length, but represents both tail length mismatch and structure mismatch; it couples to both the indirect and direct inter-leaflet couplings, J and B. Once fiducial values of the parameters are set, varying J alone approximates changing the mismatch in tail length but not structure (e.g., adding carbons to one species9), while varying B alone approximates varying the mismatch in tail structure, e.g., unsaturation. We arbitrarily choose S0 > U0. The reference total thickness d0 ≡ S0 + U0 is irrelevant in the absence of an external field acting on bilayer thickness.
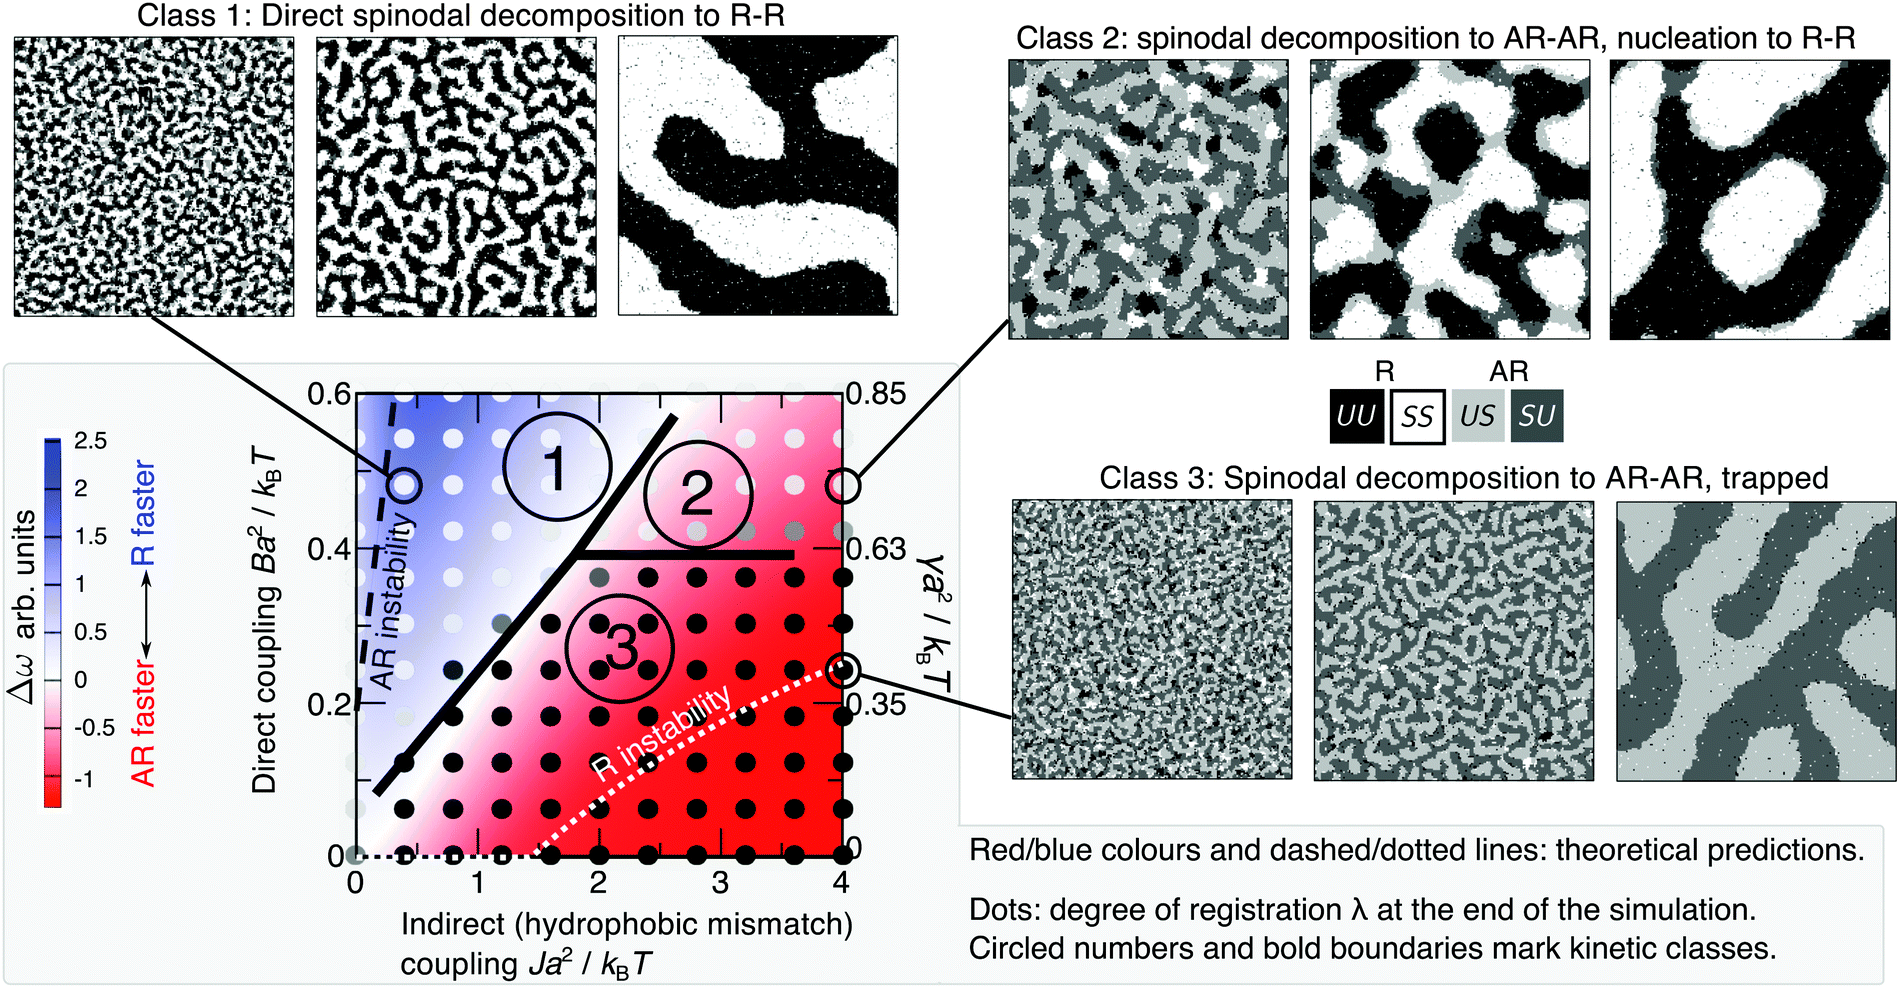 | ||
Fig. 3 Red/blue colours and dashed/dotted lines: mean-field theory parameter map showing relative growth rates of AR versus R instability modes for a bilayer comprising equimolar mixed leaflets, from linear stability analysis of initial demixing,1 with Δ0 = 2a, κ = 3a−2kBT, V = 0.6kBT. The equilibrium state is R–R in all cases. Below the “AR instability” line AR–AR coexistence is possible but is metastable. Below the “R instability” line the homogeneous state is not unstable to the R mode, although R–R separation is still the equilibrium state. Overlaid dots from simulation (with V = 0.9kBT) show the average degree of registration λ at the end of the simulation time, λ = 0 (black, AR–AR) to λ = 1 (white, R–R). We identify three kinetic classes discussed in the text (circled 1, 2, 3, bold line marks approximate boundaries). Illustrative simulation snapshot sequences for each class are shown ( in the snapshots). Simulations are visualised with OVITO.29 in the snapshots). Simulations are visualised with OVITO.29 | ||
B. Simulation protocol
We simulate a bilayer where
  (script letters refer to the entire simulated bilayer, as opposed to a local bilayer patch). The Kinetic Monte Carlo scheme2 resembles Kawasaki (spin-exchange) dynamics, governed by the Hamiltonian (eqn (1)): lipids exchange between neighbouring lattice sites within their leaflet, thus mimicking diffusive evolution after a quench from a high-temperature, randomised initial configuration. Hydrodynamics are not included, but we do not expect this to significantly alter the conclusions; we address this further in the Discussion.
The overall leaflet compositions are conserved, since we do not consider flip-flop or exchange with the solvent, and are given by
 | (2) |
![[scr N, script letter N]](https://www.rsc.org/images/entities/char_e52d.gif) t(b)S is the total number of S lipids in the top (bottom) leaflet. R and AR lattice sites can interconvert (SU + US ⇄ SS + UU) to alter the “degree of registration” (microscopic transbilayer symmetry)
t(b)S is the total number of S lipids in the top (bottom) leaflet. R and AR lattice sites can interconvert (SU + US ⇄ SS + UU) to alter the “degree of registration” (microscopic transbilayer symmetry)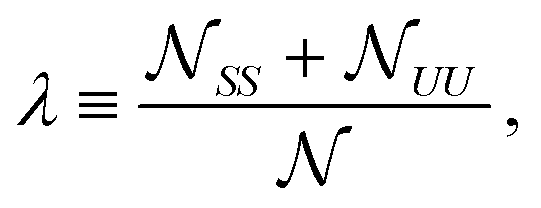 | (3) |
SS is the total number of SS lattice sites, etc.
λ can vary in the range
| |Φt + Φb − 1| ≤ λ ≤ 1 − |Φt − Φb|. | (4) |
Here we focus on symmetric, equimolar overall leaflet compositions Φt = Φb = 0.5. By eqn (4) the degree of registration λ can vary from 0 (full pairwise antiregistration) to 1 (full pairwise registration).
C. Parameters
The lattice spacing is a ∼ 0.8 nm. We use κ = 3a−2kBT, corresponding to κA ≈ 60kBT nm−2, in the range for lipid bilayers at 300 K.20–22 A fiducial value of the indirect coupling parameter is J ∼ 2a−2kBT,1 while B leads to an effective value of γ (Fig. 3 secondary axis), for which existing estimates vary widely (γ ∼ 0.01–1kBT nm−2![[thin space (1/6-em)]](https://www.rsc.org/images/entities/char_2009.gif) ).4,5,7,17–19
).4,5,7,17–19
We choose a mismatch parameter Δ0 = 2a ∼ 1.6 nm, somewhat larger than the typical length mismatch in phospholipid mixtures, for which a (registered) phase thickness mismatch ≲2 nm23,24 would imply Δ0 ≲ 1 nm. Large Δ0 couples to both the indirect (J) and direct (B) couplings, increasing the energetic driving forces for both antiregistration and registration and making the competing phases clearer to interpret in simulation. The phenomenology is qualitatively similar upon reducing Δ0,2 with the caveat that Δ0 affects the effective value of γ arising from a given B (eqn (8)). In Section V we mention the dependence of the nucleation theory on Δ0.
We use V = 0.6kBT in the mean-field theory, above the mean-field threshold V0 ≡ 0.5kBT for phase separation in the absence of other couplings, and use V = 0.9kBT in simulation, where the corresponding threshold is Vsim.0 = 0.88kBT due to fluctuations.25 Although we cannot expect precise quantitative agreement between the mean-field theory and simulation, in this regime it appears the exact value of V is not crucial to the kinetics; for example, a value V = 0.9kBT in the mean-field theory would yield a similar predicted landscape of relative R/AR growth rate Δω to that calculated in Fig. 3.2
III Registered and antiregistered phases
We now discuss bilayer domain symmetry and asymmetry in terms of competing bilayer phase coexistences, focusing on those relevant to the present work and briefly considering those relevant to bilayers of asymmetric overall leaflet compositions (Φb ≠ Φt). Upon coarse-graining the microscopic model eqn (1) (Fig. 2c), a local bilayer patch is characterised by locally-averaged top and bottom leaflet compositions (where the sum is over the local patch). We derive a mean-field free-energy density f(ϕt, ϕb),1 which yields a phase diagram in (ϕt, ϕb) space (Fig. 1).1 The coexisting bilayer phases determine the local order parameter in each leaflet, given by the projection of a given tie-line endpoint onto the ϕt or ϕb axis.
A. Definition of registration and antiregistration
Some experiments, particularly with asymmetric overall leaflet compositions, may use separate fluorophores to image domain morphology in each leaflet.26–28 Interpreting these in (ϕt, ϕb) space, and relating them to experiments that do not image the separate leaflets,24 requires care. We define a registered (R) bilayer phase as one in which both leaflets are dominated by the same species. Hence, in our model, an R phase is dominated by SS or UU lattice sites (Fig. 1) such that most lipids face one of their own species in the apposing leaflet. An antiregistered (AR) bilayer phase is one where the leaflets are dominated by opposite species. Hence, under our definition, “registration” is a property of a given homogeneous patch of the bilayer, describing approximate local compositional symmetry between the leaflets.An alternative definition of registration is sometimes used, which we call “colocalised enrichment”.26,27 This describes a bilayer in which the regions of largest top-leaflet composition ϕt (relative to the average in that leaflet) spatially superimpose on the regions of largest bottom-leaflet composition ϕb. Colocalised enrichment is therefore a property of domain morphology over the entire bilayer, not of an individual bilayer phase. It requires a tie-line of finite positive slope in (ϕt, ϕb) space, so that: (i) both leaflets contain domains of larger and smaller than average ϕt(b); and (ii) the domains of large ϕt belong to the same bilayer phase as the domains of large ϕb and are thus spatially colocalised with them.
R–AR coexistence (Fig. 1 dotted line) can be accessed by a bilayer of asymmetric overall leaflet compositions. R–AR tie-lines have positive slope, and thus exhibit colocalised enrichment, although the AR phase is highly asymmetric in composition. Hence, the colocalised enriched domains in each leaflet reported in ref. 27 and 28 (where the leaflets were separately imaged) are consistent with either an R–R or R–AR tie-line. Quantitative composition information would be required to unambiguously determine which was observed.
In the present work, we consider a bilayer of symmetric overall leaflet compositions for which R–R and AR–AR tie-lines compete. In this case, “registration” versus “colocalised enrichment” are practically equivalent. R–R has positive tie-line slope (colocalised enrichment), and both bilayer phases are compositionally symmetric (registered phases, under our definition). Conversely, AR–AR tie-lines are negatively-sloped so that enrichment in one leaflet colocalises with depletion in the other, and both bilayer phases are compositionally asymmetric (antiregistered phases, under our definition).
The literature is ambiguous. For example, full colocalised enrichment (which can reflect either an R–R or R–AR tie-line) is described in ref. 27 as “registration”. In contrast, in ref. 10, “registration” is also defined as the presence of Lo (or Ld) on both sides of the bilayer, which is more like our definition of R phases versus AR phases. This ambiguity is not surprising because often, as here, the two definitions outlined above are similar. The two concepts can clash for asymmetric overall leaflet compositions28 where R–AR tie-lines can play a role.
In asymmetric supported bilayers in ref. 27, the leaflets were imaged with separate fluorophores, revealing colocalised domains in both leaflets. The same was found in highly asymmetric vesicles in ref. 28. On the face of it, these findings differ from some supported bilayers in ref. 24 which exhibited compositionally asymmetric regions interpreted as domains in only one leaflet. These were inferred from variations in total bilayer thickness without imaging the separate leaflets. Height mismatch smaller than a known value for R–R was measured, indicating either R–AR or AR–AR–R coexistence. R–AR was then inferred by detecting that saturated lipids were predominantly in the top leaflet. The system was interpreted as having domains in only the top leaflet.24
However, it is probable that the asymmetric bilayers in both ref. 27 and 28 and ref. 24 represent an R–AR tie-line. Thus, imaging the leaflets in ref. 24 separately could have shown colocalised enrichment just as in ref. 27 and 28. The top-leaflet gel domains in ref. 24 may have apposed regions in the bottom leaflet weakly more “gel-like” than the average in the bottom leaflet. Similarly, the colocalised enrichment in ref. 27 and 28 does not require that bottom27 (or inner28) leaflet domains are truly Lo – for the R–AR tie-line shown in Fig. 1 they will, like the rest of the bottom/inner leaflet, be dominated by unsaturated lipids. It only requires that they are weakly more “Lo-like” than the average in their leaflet, i.e., that the R–AR tie-line is tilted. Hence, the question of whether domains in one leaflet “induce domains in the other” becomes the question of whether the given tie-line is tilted enough for both leaflets to exhibit detectable domain formation when a different fluorophore is used in each. The degree of R–AR tie-line tilt will depend on the direct inter-leaflet coupling B and hence on molecular features.
B. Kinetics and competing phase coexistences
For most typical parameter choices, the R phases are lower in f(ϕt, ϕb) than are the AR, hence R–R tie-lines are equilibrium and AR–AR metastable.1 As well as the coarse-grained bulk free energy f(ϕt, ϕb), the underlying microscopic model yields free-energy costs for composition and thickness gradients, which describe the role of spatial structure and domain formation in the kinetic competition of metastable and equilibrium states. Linear stability analysis of the initial homogeneous state (Fig. 3) predicts growth rates of competing R versus AR instability modes and thus whether symmetric or asymmetric domains form first.1 The interplay between gradient and bulk free energies then governs the nucleation of symmetric domains (introduced in Section V), which determines the eventual fate of a bilayer that has initially become metastably AR–AR. The ability to derive both gradient and bulk free energies from defined microscopic interactions is a key advantage of the present model over a purely phenomenological approach.In Fig. 3, R–R separation is equilibrium (except for a very small region Ba2/kBT ≲ 0.005). Below the “AR instability” line, AR–AR separation is also possible, but metastable. Below the “R instability” line, the initial state is not subject to R instability although R–R separation remains the equilibrium state. The red and blue colours show the difference in growth rates, Δω, between R and AR instability modes. For example, red signifies a faster-growing AR instability mode, so that AR–AR separation dominates initial demixing.
For physical parameter ranges,1 neither the R or AR mode is trivially dominant, so that moderate changes to lipid tail length mismatch (affecting the effective value of J) or tail structure mismatch (affecting B) can determine whether the initial instability after a quench leads to locally symmetric (R) or locally asymmetric (AR) domains. In addition, the long-lived AR–AR states simulated in ref. 9 and 10 provide prima facie evidence that metastable trapping due to failure to nucleate R domains is possible for physical phospholipids. However, due to small simulation sizes in such studies, this could constitute a stable, not metastably trapped, state, an issue which we address in the Discussion.
Finally we note that, contrary to ref. 30, AR–AR coexistence does not require an exactly equimolar (or equal area fractions) mixture in each leaflet. Firstly, an overall composition away from Φt = Φb = 0.5 can lie on one of a set of AR–AR tie-lines running parallel to the central one depicted in Fig. 1.2 Secondly, even if the overall composition is outside any AR–AR tie-line, AR–AR–R coexistence can occur, in which the presence of some R phase is forced by the composition being far from equimolar, but the R phase coexists with two AR phases.2 In that situation, every region of the bilayer except the R phase is, as for AR–AR, locally asymmetric. Like AR–AR, for typical parameters, AR–AR–R is a metastable state, which could become trapped for strong hydrophobic mismatch or stabilised if domain size is limited (e.g., by simulation size).
IV Kinetic phase diagram
Fig. 3 shows the results of simulations of phase-transition kinetics for varying indirect coupling J and direct coupling B, to model varying lipid tail length mismatch and structural mismatch. The overlaid greyscale dots signify whether registered or antiregistered domains dominate at the end of the simulated time (t = 106 Monte Carlo Steps) by measuring the degree of registration λ, with λ ≈ 0 (black) corresponding to AR–AR coexistence and λ ≈ 1 (white) to R–R. Each dot on Fig. 3 is an average of four independent trajectories.This simulated “kinetic phase diagram” agrees semi-quantitatively with the theoretical linear stability analysis of initial demixing (red/blue on Fig. 3): inside the blue region, where R–R coexistence should be accessed directly, the simulation exhibits full registration. If instead the AR mode is fastest (red), we find two possibilities – the bilayer may reach R–R coexistence by nucleation out of the AR–AR state, or remain metastably trapped in AR–AR. Fig. 4a shows the successful formation of registered nuclei, which grow from the boundaries of antiregistered domains. In Fig. 4b, a different random quench in the simulation leads to failure to nucleate despite unchanged parameters, illustrating the stochastic nature of the nucleation process.
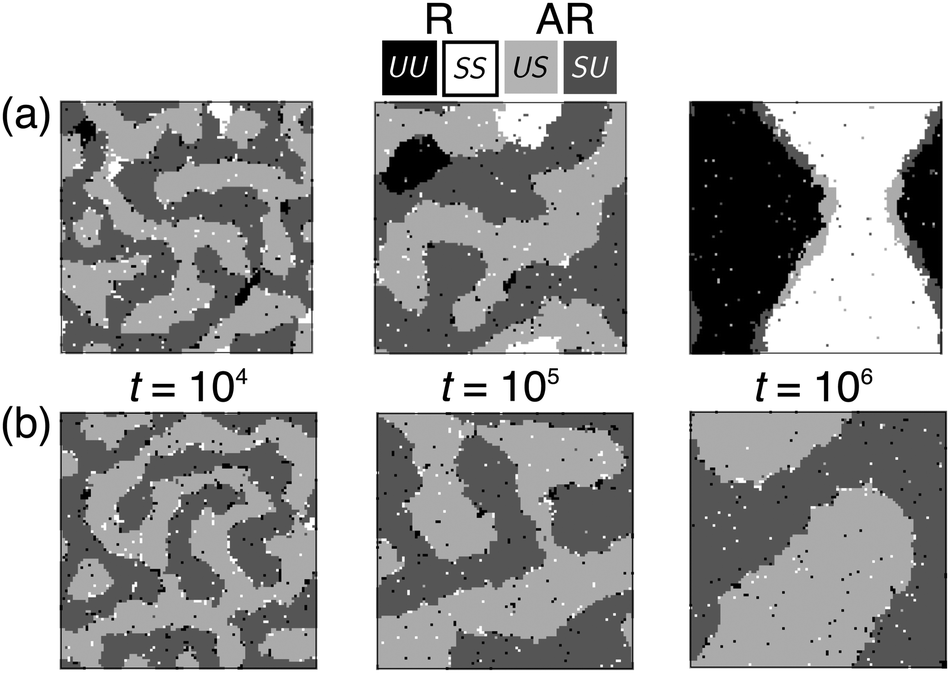 | ||
Fig. 4 (a) Snapshots of a trajectory in which two registered nuclei grow to reach equilibrium. (b) Trajectory with the same parameters but a different random initial configuration, in which no nuclei survive. Parameters: Δ0 = 2a, κ = 3a−2kBT, V = 0.9kBT, J = 4a−2kBT, B = 0.42a−2kBT,  . . | ||
Having identified the expected three classes of kinetics, we next model the energetics of nucleating registered domains, to clarify the fates of the metastable AR–AR state (the second and third kinetic classes identified in Fig. 3).
V Nucleation theory
The metastability of AR–AR implies that arbitrarily small composition fluctuations decay. To reach R–R, registered domains must be formed by composition fluctuations sufficient to generate a nucleus of a registered phase large enough for the area-dependent payoff in bulk free energy to outweigh the penalty for hydrophobic mismatch at the edge. We now study the energetics of this nucleation. For simplicity we consider the R nucleus to be compositionally uniform (thus ignoring mixing effects at the domain boundary), and use the response of the thickness profile to mismatch at the nucleus' boundary to calculate the nucleation energetics.Fig. 4a exhibits typical nucleation of registered domains. Our goal is to model the role of hydrophobic mismatch around the edge of R nuclei in determining whether they successfully grow (Fig. 4a) or decay (Fig. 4b). For the reference (zero free energy) state, we take a registered bilayer at equilibrium with no transmidplane mismatch and domains coarse enough for edges to make a vanishing energy contribution. We then assume that a dominant AR instability mode has led to an initially antiregistered state, which incurs everywhere an energy cost, relative to the registered reference state, due to the direct coupling B. We then introduce a circular R nucleus of radius R, thus removing the direct coupling energy within the domain's area but introducing a thickness mismatch around its perimeter (Fig. 5).
 | ||
| Fig. 5 Schematic structure of a registered SS nucleus introduced to an antiregistered background. The leaflet thicknesses inside and outside the nucleus are calculated from eqn (6). The midplane (dashed) shifts discontinuously at r = R to maintain smooth outer contours (cf.ref. 9 and 30). S (light) and U (dark) lipids illustrating composition are superimposed. Primes indicate that leaflet thicknesses outside the nucleus differ from those inside. | ||
In the continuum limit of the lattice model, the free energy is
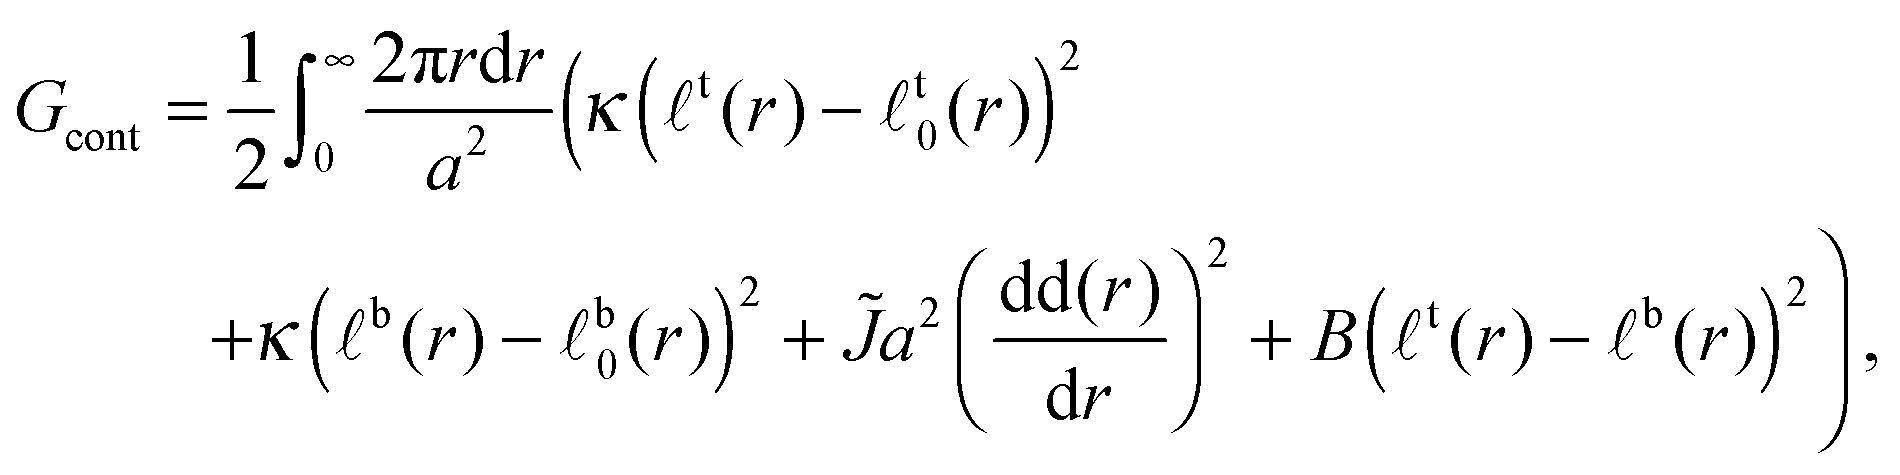 | (5) |
term captures the thickness gradient penalty from the corresponding neighbour interaction (eqn (1)) in the limit of small lattice spacing. We neglect contributions from the Ising-like interaction V. It is thought that, as hydrophobic mismatch increases, it becomes the dominant contribution to the line tension of (registered) domains23,31 (this does not imply that thickness mismatch uniquely determines phase-transition temperature32). However, in Appendix B we briefly discuss an upper bound for the influence of V on the following nucleation energetics.
The leaflets' compositions are reflected in their ideal thicknesses t,b0(r). The actual thickness profiles t,b(r) adopted by the leaflets minimise the free energy Gcont. The actual thickness difference and total thickness profiles are denoted Δ(r) ≡ t(r) − b(r) and d(r) ≡ t(r) + b(r). The calculations underlying the following results are detailed in Appendix A.
A. Antiregistered background
The nucleus appears within a phase-separated AR–AR background. In practice, R domains typically form at AR–AR domain boundaries (Fig. 4). The effects of this on nucleation are briefly discussed in Appendix B, but for the following calculations we are ignoring the Ising contribution V (which provides the only source of line tension at AR–AR boundaries). Hence, the pattern and orientation of the initial AR domains is unimportant, and we assume a spatially uniform state with S lipids in the top leaflet, U in the bottom. For simplicity we assume strong compositional segregation so that the phases are approximately pure, with ideal leaflet thicknesses given by| t,AR0 = S0, | (6a) |
| b,AR0 = U0. | (6b) |
 | (7) |
 | (8) |
| dAR = S0 + U0 = d0. | (9) |
B. Introducing a registered nucleus
We consider the energy change induced by a registered nucleus of the S species (Fig. 5), with larger ideal thickness than its surroundings (the energetics are identical for a nucleus of the shorter species U):| t,nuc.0(r) = S0, | (10a) |
 | (10b) |
 | (11) |
If the composition interface were not sharp one would consider the coupling between composition and thickness gradients. Moreover, one could also allow for sliding into antiregistration at a registered domain boundary, which smears out thickness mismatch.2,9,30 These would not qualitatively alter the fact that the registered nucleus' boundary experiences an energy cost from thickness mismatch, but could help reduce it.
Calculating the total thickness profile after the nucleus is introduced yields
 | (12) |
 | (13) |
 | ||
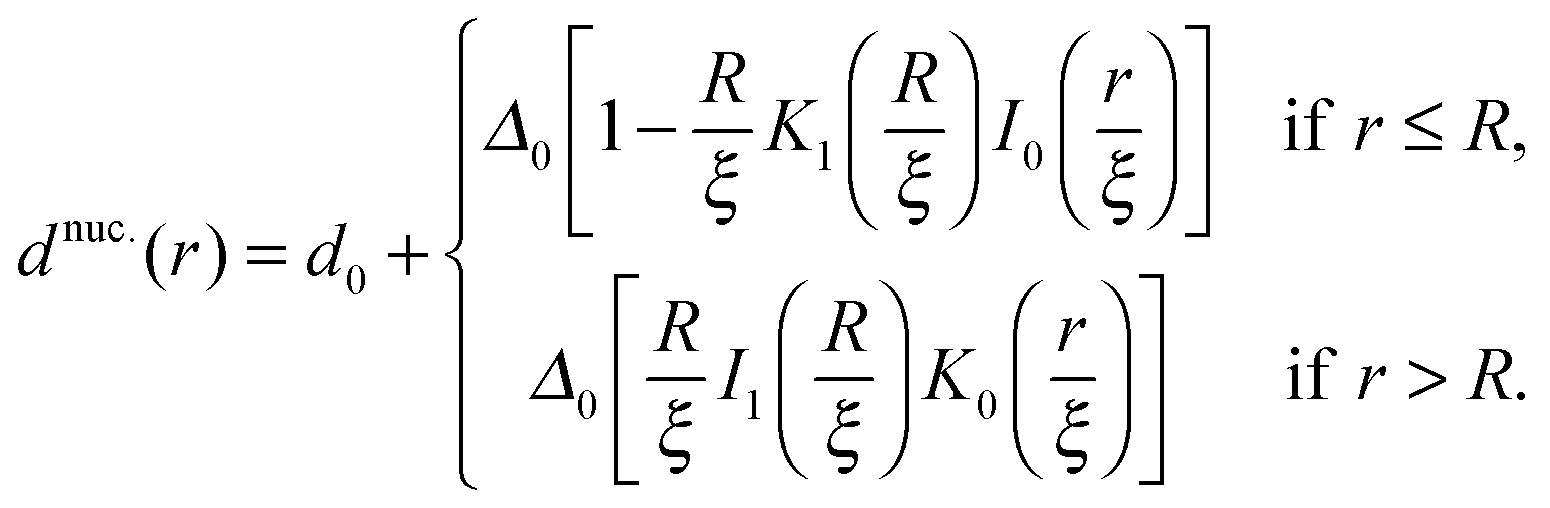
| Fig. 6 (a) Calculated profile of total thickness dnuc.(r) relative to the AR background, when the nucleus is introduced. The ideal thickness relative to the surroundings is Δ0 = 2a. Arrow: decreasing decay length ξ. (b) dnuc.(r) relative to the AR background and normalised by its ideal value inside the nucleus, Δ0. Arrow: increasing nucleus size. | ||
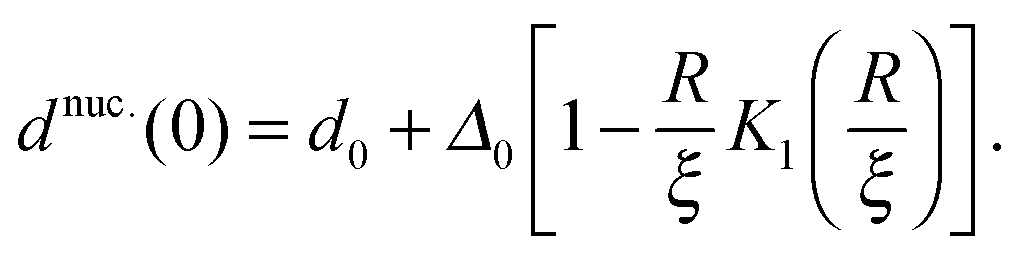
For large ξ, the R nucleus does not reach its ideal thickness even at its centre, r/a = 0. This is an important point; for small nuclei R ∼ ξ, the effective thickness mismatch between the nucleus and its surroundings is less than its value Δ0 in the limit of large domain size (Fig. 6b). The thickness at the centre of the nucleus is given by
 | (14) |
and κ will typically be of the same order of magnitude1 such that ξ ∼ a, it may only be significant for very small domains. However, increasing thickness mismatch of registered domains as they grow has been reported in molecular simulation,33 as predicted here.
After introducing the nucleus, the individual thicknesses t,nuc.(r) and b,nuc.(r) of the top and bottom leaflets are given by
| t,nuc.(r) = ½(dnuc.(r) + Δnuc.(r)), | (15a) |
| b,nuc.(r) = ½(dnuc.(r) − Δnuc.(r)). | (15b) |
t,nuc.(r) and b,nuc.(r)) is discontinuous at the nucleus boundary r = R, we expect this discontinuity to occur in the midplane position to maintain smooth outer contours and minimise hydrophobic exposure.30 This can also be seen in molecular simulations containing AR domains.9 The resultant bilayer structure is shown in Fig. 5. Outside the R nucleus, the leaflets adapt their thicknesses (thus tail structure) to one another's presence (eqn (11)), i.e. the S species are shorter than S0 and the U longer than U0. Inside the nucleus, the registered region is able to achieve its ideal bilayer thickness only once the nucleus grows large enough.
C. Energy of a registered nucleus
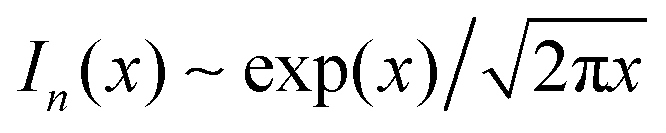
Given the thickness profiles before and after the nucleus is introduced, the energy required to create a registered nucleus of size R is calculated as (see Appendix A)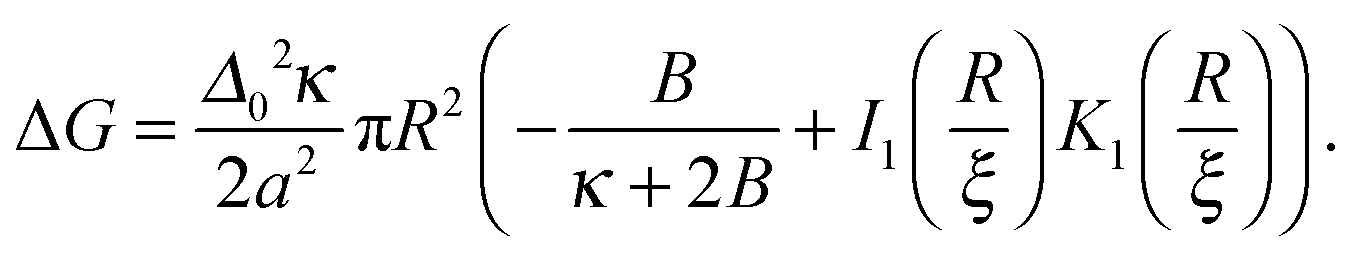 | (16) |
 and
and 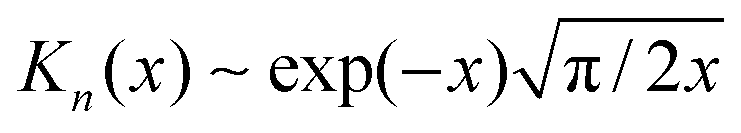 for large x give
  . The hydrophobic mismatch term then becomes overall linear in R, acting like a standard line tension Γ = Δ02κξ/8a2. Hence, for large nuclei or large stiffness κ, ΔG behaves as in 2D classical nucleation theory (CNT). For a ≈ 0.8 nm, κ ≈ 3a−2kBT, ξ ≈ a and Δ0 ≈ a at T = 300 K, we estimate Γ ≈ 2 pN between R and AR domains or Γ ≈ 8 pN between R–R domains of different species, quite close to existing estimates for phospholipids.34 Thus, although our simplified model does not capture all details of hydrophobic mismatch and the concomitant bilayer deformation,30 the associated energy scale is well captured.
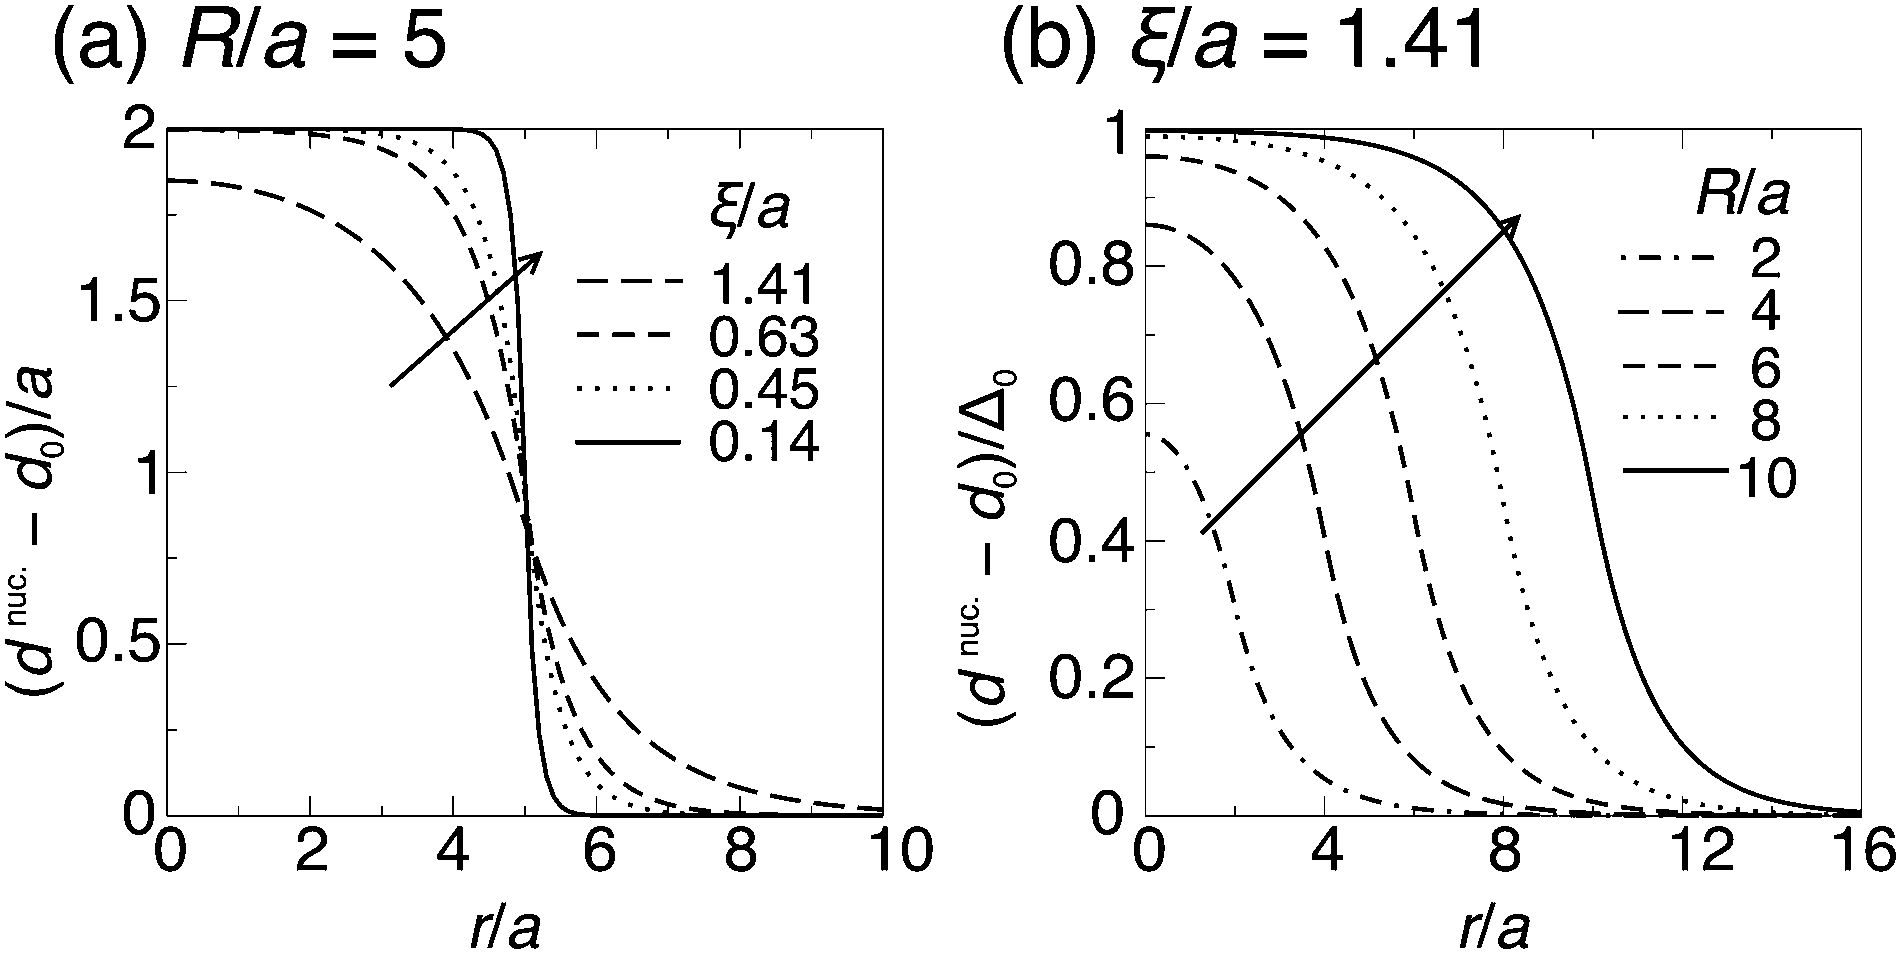
Some illustrative nucleation energy curves are shown in Fig. 7. For CNT in 2D, the ratio ΔG/R would be a straight line of negative slope. Deviation from a straight line indicates deviation from CNT. If ξ is small (weak hydrophobic mismatch compared to stiffness), the behaviour is CNT-like over most of R; moreover the critical radius R* (defined as the value where ΔG(R) is maximised) occurs deep into the CNT-like regime. For larger ξ (stronger hydrophobic length mismatch relative to stiffness) the critical radius no longer occurs in the CNT-like regime, so non-CNT effects arising from nonlocal thickness deformation influence nucleation.
 | ||
| Fig. 7 Energy ΔG for a registered nucleus of radius R, calculated from eqn (16), with Δ0 = 2a and κ = 3a−2kBT. We vary the decay length ξ by varying but hold the ratio of indirect and direct couplings constant at /B = 2 (J/B = 8 line in Fig. 8). In 2D classical nucleation theory the ratio ΔG/R would yield a straight line of negative slope. Circles mark critical radii R*. Inset: Behaviour of ΔG without normalisation by nucleus size. | ||
D. Nucleation barrier and critical radius landscapes
Fig. 7 (inset) implies that increasing J for a fixed ratio J/B and fixed κ (equivalently, increasing ξ) first increases, then reduces, the nucleation barrier. In the limit of large κ one would expect increasing J and B to simply increase the energy scale, hence the nucleation barrier. But when J is comparable to κ, the mechanism illustrated in Fig. 6b takes over; increasing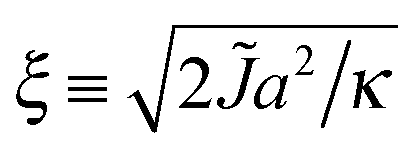 reduces the effective thickness mismatch for small nuclei, thus reducing the hydrophobic penalty for nucleation and reducing the nucleation barrier.
The nucleation theory can be related to the simulations by plotting landscapes of the nucleation barrier ΔG(R*) (Fig. 8) and critical radius R* (Fig. 9). A small barrier clearly facilitates nucleation, although the role of the critical radius is more subtle.35–37 One important factor is that for smaller critical radii, regions randomly enriched in registration from the initial quench are more likely to be near or above the critical radius, so can grow more easily.
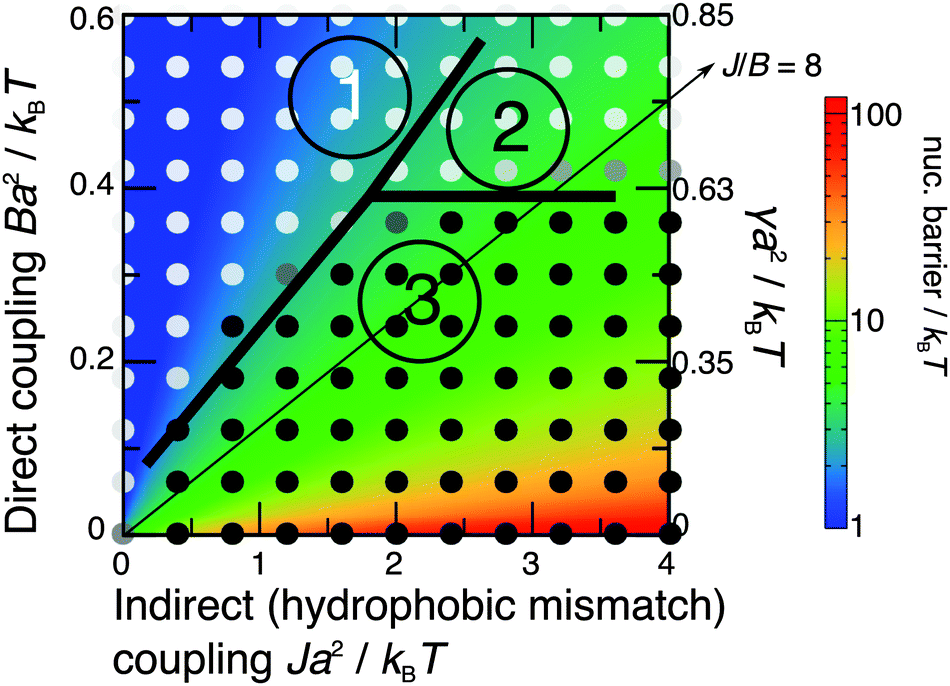 | ||
| Fig. 8 Simulated kinetic phase diagram (notation as in Fig. 3), overlaid on the theoretical nucleation barrier for an R domain nucleating from an AR state (Δ0 = 2a, κ = 3a−2kBT). The arrowed line shows J/B = 8, as used in Fig. 7. | ||
 | ||
| Fig. 9 As Fig. 8 but showing the calculated critical radius for R domain nucleation. | ||
The predicted energetics for nucleation are consistent with the classes of kinetics identified in Fig. 3. Where the R instability mode is fastest, nucleation energetics are irrelevant since the equilibrium phases are formed immediately. If the AR mode is fastest, a successful subsequent transition to equilibrium R–R coexistence generally occurs where the predicted nucleation barrier and critical radius are smaller. As we have used a relatively large value of the mismatch parameter Δ0 = 2a, we briefly mention the dependence on it.38 The critical radii are independent of Δ0, because Δ0 represents both tail length and structure mismatch so affects both the indirect and direct coupling strengths. Thus the only change to Fig. 9 would be in the effective value of γ shown on the secondary axis, which scales as Δ02 (eqn (8)). On Fig. 8, in addition to the change in effective γ, the nucleation barrier ΔG(R*) scales as Δ02.
VI Discussion
In this paper we have studied phase-separation kinetics in a bilayer subject to competing symmetric and asymmetric instabilities. We have modelled the nucleation of symmetric (registered, R) phases where the initial spinodal instability has led to antiregistered AR–AR coexistence (local asymmetry everywhere). We made use of a microscopic lattice model that allows study of both phase equilibria and phase-transition kinetics, through coarse-grained theory and direct simulation. For realistic parameters, the competing symmetric and asymmetric instabilities can be comparable in strength, so that changes to molecule properties can tip the balance.1If the fastest-growing instability mode is R, spinodal decomposition directly into equilibrium R–R coexistence takes place (class 1 Fig. 3). If the AR mode grows fastest then a metastable AR–AR state forms, and nucleation is required to reach equilibrium (class 2 Fig. 3). Unsuccessful nucleation leaves the bilayer metastably trapped (class 3 Fig. 3).
The key parameters for the initial demixing and subsequent nucleation energetics are the indirect inter-leaflet coupling J via hydrophobic mismatch, favouring antiregistration, and the direct coupling B which favours registration. Physically, the hydrophobic tail length mismatch or structure mismatch would affect the effective values of J or B respectively. Both J and B couple to the stiffness κ, which determines how easily mixed lipids can change their tail length and structure to adapt to one another's presence. Here we have focused on an equimolar mixture in both leaflets such that AR–AR coexistence competes with R–R; the kinetic considerations are qualitatively similar for other overall compositions subject to competing instability modes, in which other states including three-phase coexistence (AR–AR–R or R–R–AR) can enter.2
Nucleation implies a critical radius, which a registered domain must exceed so that the penalty of thickness mismatch at the perimeter does not outweigh the bulk free-energy gain. This does not mean domains automatically become registered beyond a certain size, as is sometimes implied.5,10,39 If nucleation is energetically prohibitive, the mere presence of large coarsening antiregistered domains does not guarantee registered domains will ever form, just as assembling a large volume of supercooled water does not guarantee a supercritical ice nucleus will form. That said, it is intriguing to consider whether some hydrodynamic or curvature-mediated mechanism (neither of which are included here) could dynamically assist very large antiregistered domains to overcome the nucleation barrier and become registered.
In the present simulations it appears that a nucleation barrier ΔG(R*) ≳ 5kBT inhibits nucleation on the simulated timescale for this simulation size. In principle the nucleation rate I (per unit area per unit time) is determined by ΔG(R*) via I = I0exp(−ΔG(R*)/kBT), although the unknown kinetic prefactor I0 severely limits the quantitative utility of such a picture. We also expect the critical radius R* to determine how large random regions of inter-leaflet symmetry during the initial quench must be in order for them to grow. The critical radius also captures a size-dependence of potential relevance to cell membrane rafts and clusters, discussed below.
By examining the effect of thickness mismatch at the boundary of a nucleating registered domain, we showed that the process departs strongly from classical nucleation theory due to deformation of the thickness profile, which reduces the effective line tension of small nuclei. For small nuclei, the deformation essentially spreads over the whole nucleus, reducing the effective hydrophobic mismatch. To our knowledge this behaviour has not been noted in previous theories which tended to focus on domains large enough to treat the boundary as a straight line.30,31 The prediction is supported by a recent molecular simulation of coarsening of a quenched bilayer,33 where registered liquid-ordered and liquid-disordered domains became respectively thicker and thinner as they grew through time.
The simulation method does not include hydrodynamics, which are expected to dominate domain coarsening beyond a lengthscale ∼10−6 m such that the purely diffusive dynamics simulated here would no longer apply.40 However, this lengthscale is far beyond both the size simulated here and the predicted critical radii (Fig. 9). Note that hydrodynamics cannot influence the free-energy landscape of the system, and thus cannot change the competing metastable and equilibrium states.
The phase equilibria of “macroscopic” domains (which coarsen until limited by bilayer size) are not influenced by edge energies and, for most reasonable parameters, we predict that R phases are lower in free energy so that R–R is the equilibrium state in bulk,1 as seen in fluorescence studies of large domains.41,42 At the opposite end of the size spectrum, experiments reveal pairwise antiregistration at the single-lipid level,11,43 as also reported in simulation8 and predicted by our mean-field theory.1 In between these regimes, edge energies can influence the equilibrium state; for example, the AR–AR coexistence in ref. 9 and 10 is probably metastable in the limit of large size but could be stabilised if the simulation box is too small to accommodate a supercritical registered domain.
This has important physical consequences, because cell membrane rafts or clusters are not macroscopic. Small domain size in vivo could be due to elastic repulsion,44 hybrid lipids,45 critical fluctuations,46 active recycling47,48 or another mechanism. In either case, it is crucial to recognise that edge energies could influence the thermodynamic preference and even stabilise an AR–AR type of domain formation, in which one leaflet's local enrichment in longer species (relative to the background in that leaflet) colocalises with a relative depletion of such species in the other leaflet.
Although the cell membrane is maintained out of equilibrium, thermodynamic driving forces can be expected to play a role. The potential importance of this size-dependence is underlined by the fact that the estimated critical radii (Fig. 9) can be of the order of putative lipid raft sizes.49 The basic biophysical question is: if a cluster of longer lipids and proteins exists in one leaflet, does it colocalise a similar cluster in the opposite leaflet to maintain transbilayer structural similarity, or does it choose shorter lipids and proteins to maintain uniform thickness? Our work implies that finite-size effects, metastable states and phase-transition kinetics can be key in determining the answer.
Appendix A: calculations for nucleation theory
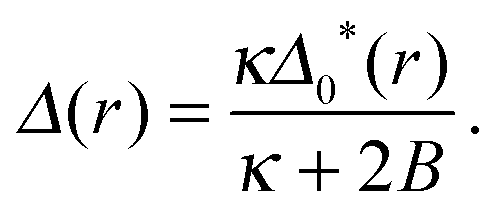
In the nucleation theory the response of the actual profilest,b(r) to variations in the ideal thicknesses t,b0(r) is calculated as follows. Varying Gcont (eqn (5)) with respect to t and b gives a pair of differential equations that can be combined to yield independent equations for the thickness difference Δ(r) ≡ t(r) − b(r) and the total d(r):| κ(Δ(r) − Δ0*(r)) + 2BΔ(r) = 0, | (A1a) |
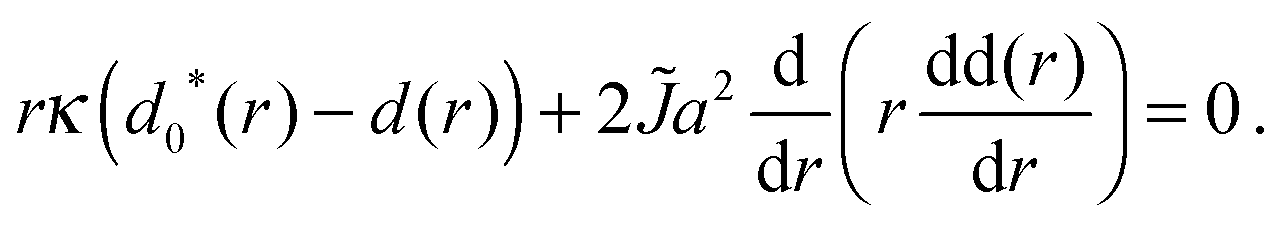 | (A1b) |
t0(r) − b0(r) and d0*(r) ≡ t0(r) + b0(r).
In the AR background the S and U species' lengths are not equal to their ideal values – the direct coupling B encourages equality of tail length (thus degree of ordering) across the bilayer. Eqn (A1a) is solved by
 | (A2) |
After introducing the R nucleus, the difference in ideal leaflet thicknesses is zero within the R nucleus (Δ0*(r) = 0 for r ≤ R), which gives eqn (11). The total thickness profile is found by solving eqn (A1b) (which is expressible as a modified Bessel's equation of order zero). We require that the gradient vanishes at the centre of the nucleus (dd(r)/dr|r=0 = 0), and that the total thickness approaches its ideal value away from the domain (d(∞) = S0 + U0 = d0). The profile d(r) and its gradient are required to be continuous at r = R in order to match the profiles inside and outside the nucleus. With ideal thicknesses given by eqn (10), this yields eqn (12).
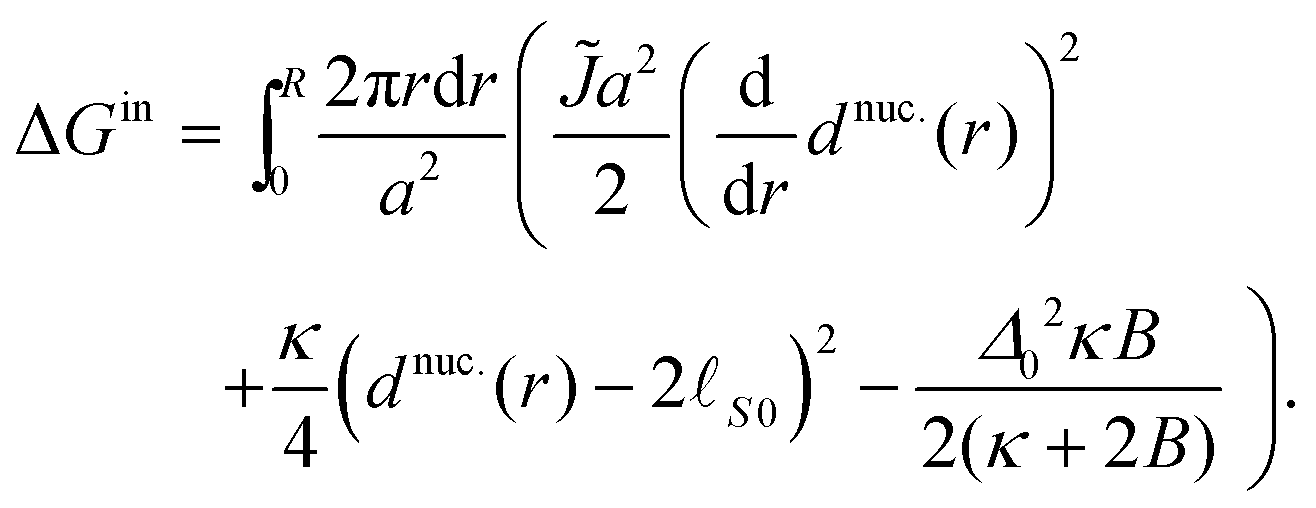
To calculate the energy ΔG required to introduce the registered nucleus, we consider the initial energy GARcont from inserting eqn (7) and (9) into eqn (5), and the energy Gnuc.cont when the nucleus is introduced, from inserting eqn (11) and (12) instead. The energy for introducing the nucleus is then
| ΔG = Gnuc.cont − GARcont. | (A3) |
 | (A4) |
 | (A5) |
Note that the negative term in ΔGin yields the estimated inter-leaflet mismatch energy density γ under our microscopic definition (eqn (8)).1 Near the strong-segregation regime this is a close approximation to the difference in bulk free-energy density between registered and antiregistered phases (which can be used to construct an alternative “macroscopic” definition of γ1), becoming exact in the strong-segregation limit assumed in Section V. However, in principle one could replace this term with the actual free-energy difference in cases where the correspondence between microscopic and macroscopic γ breaks down.1
Appendix B: effect of V on nucleation
In Section V we ignored the effect of V (headgroup interactions) on the nucleation energetics. This applies best where hydrophobic mismatch is the dominant source of line tension.31 Here we sketch an upper bound on the contribution of V to nucleation energetics of a registered domain. Fig. 10 shows an R domain nucleating at a boundary between AR domains (cf.Fig. 4). This relieves some AR–AR interfacial energy cost (like a particle in a Pickering emulsion).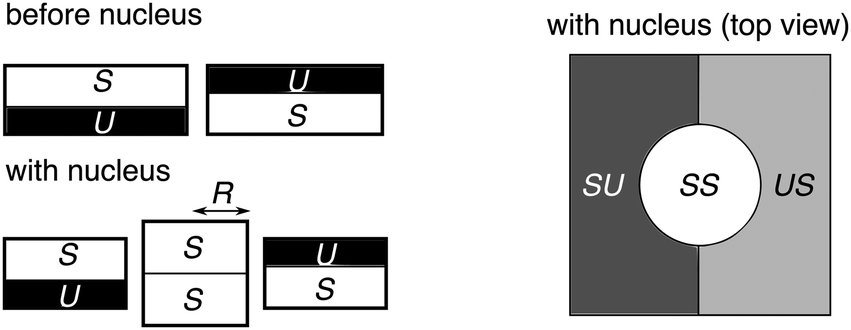 | ||
| Fig. 10 Schematic of an SS R nucleus of radius R forming at the boundary between AR–AR domains. | ||
Assuming the original AR–AR boundary is straight and the R nucleus is a circle, the length of AR–AR boundary removed by an R domain of radius R is equal to 2R. The length of R–AR boundary introduced by the nucleus is 2πR. It is extremely difficult to estimate the line tension caused by V, because (i) the separated phases will not be fully pure and (ii) the interface will relax its energy by smearing the composition change over some finite distance, and (iii) this will be coupled to the thickness gradients. However, an upper bound can be obtained by assuming, as in the main text, that the phases are strongly-segregated and that the compositional interface is sharp. With these assumptions, the line tension of the AR–AR boundary is 2V/a, and the contribution from V to an R–AR boundary is V/a. Subtracting the AR–AR energy contribution and adding the R–AR contribution, the correction to eqn (16) would be:
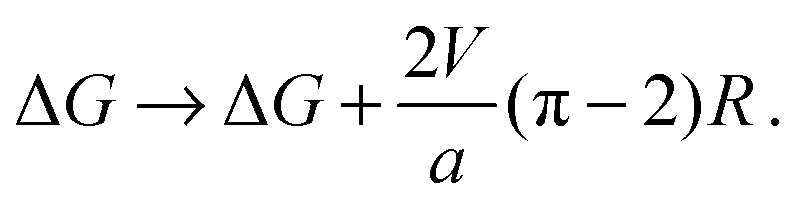 | (B1) |
We reiterate that eqn (B1) must overestimate the contribution V to nucleation energetics, possibly quite severely, so that the argument outlined here provides only a rough upper bound.
Acknowledgements
We acknowledge discussions with members of the EPSRC CAPITALS programme grant, and the input of anonymous referees. Lucas Vieira Barbosa is thanked for assistance in plot design. This work was initiated at the University of Leeds (United Kingdom), and was funded by EPSRC grant EP/J017566/1 and by Georgetown University. PDO gratefully acknowledges the support of the Ives endowment.References
- J. J. Williamson and P. D. Olmsted, Biophys. J., 2015, 108, 1963 CrossRef CAS PubMed.
- J. J. Williamson and P. D. Olmsted, 2015, arXiv:1505.02078.
- G. Garbès Putzel and M. Schick, Biophys. J., 2008, 94, 869 CrossRef PubMed.
- G. Garbès Putzel, M. J. Uline, I. Szleifer and M. Schick, Biophys. J., 2011, 100, 996 CrossRef PubMed.
- S. May, Soft Matter, 2009, 5, 3148 RSC.
- M. D. Collins and S. L. Keller, Proc. Natl. Acad. Sci. U. S. A., 2008, 105, 124 CrossRef CAS PubMed.
- H. J. Risselada and S. J. Marrink, Proc. Natl. Acad. Sci. U. S. A., 2008, 105, 17367 CrossRef CAS PubMed.
- M. J. Stevens, J. Am. Chem. Soc., 2005, 127, 15330 CrossRef CAS PubMed.
- J. D. Perlmutter and J. N. Sachs, J. Am. Chem. Soc., 2011, 133, 6563 CrossRef CAS PubMed.
- R. Reigada and F. Sagués, J. R. Soc., Interface, 2015, 12, 20150197 CrossRef PubMed.
- J. Zhang, B. Jing, N. Tokutake and S. L. Regen, J. Am. Chem. Soc., 2004, 126, 10856 CrossRef CAS PubMed.
- A. J. Wagner, S. Loew and S. May, Biophys. J., 2007, 93, 4268 CrossRef CAS PubMed.
- A. Kusumi, I. Koyama-Honda and K. Suzuki, Traffic, 2004, 5, 213 CrossRef CAS PubMed.
- W. Ostwald, Z. Phys. Chem., 1897, 22, 289 CAS.
- In a real system in which lipid species' molecular areas may differ, Φt = Φb = 0.5 refers instead to an equal area fractions mixture in each leaflet.
- S. Komura, H. Shirotori, P. D. Olmsted and D. Andelman, Europhys. Lett., 2004, 67, 321 CrossRef CAS.
- D. A. Pantano, P. B. Moore, M. L. Klein and D. E. Discher, Soft Matter, 2011, 7, 8182 RSC.
- A. Polley, S. Mayor and M. Rao, J. Chem. Phys., 2014, 141, 064903 CrossRef PubMed.
- M. C. Blosser, A. R. Honerkamp-Smith, T. Han, M. Haataja and S. L. Keller, Biophys. J., 2015, 108, 240a CrossRef PubMed.
- E. J. Wallace, Influence of microstructure on the phase behaviour of lipid membranes, PhD thesis, University of Leeds, 2005.
- D. Needham and R. Nunn, Biophys. J., 1990, 58, 997 CrossRef CAS.
- W. Rawicz, K. Olbrich, T. McIntosh, D. Needham and E. Evans, Biophys. J., 2000, 79, 328 CrossRef CAS.
- A. J. García-Sáez, S. Chiantia and P. Schwille, J. Biol. Chem., 2007, 282, 33537 CrossRef PubMed.
- W.-C. Lin, C. D. Blanchette, T. V. Ratto and M. L. Longo, Biophys. J., 2006, 90, 228 CrossRef CAS PubMed.
- K. Huang, Statistical Mechanics, Wiley, New York, 1987 Search PubMed.
- S. Garg, J. Rühe, K. Lüdtke, R. Jordan and C. A. Naumann, Biophys. J., 2007, 92, 1263 CrossRef CAS PubMed.
- I. Visco, S. Chiantia and P. Schwille, Langmuir, 2014, 30, 7475 CrossRef CAS PubMed.
- Q. Lin and E. London, Biophys. J., 2015, 108, 2212 CrossRef CAS PubMed.
- A. Stukowski, Modell. Simul. Mater. Sci. Eng., 2010, 18, 015012 CrossRef.
- T. R. Galimzyanov, R. J. Molotkovsky, M. E. Bozdaganyan, F. S. Cohen, P. Pohl and S. A. Akimov, Phys. Rev. Lett., 2015, 115, 088101 CrossRef.
- P. I. Kuzmin, S. A. Akimov, Y. A. Chizmadzhev, J. Zimmerberg and F. S. Cohen, Biophys. J., 2005, 88, 1120 CrossRef CAS PubMed.
- J. V. Bleecker, P. A. Cox and S. L. Keller, Biophys. J., 2015, 108, 241a CrossRef PubMed.
- E. Jefferys, M. S. P. Sansom and P. W. Fowler, Faraday Discuss., 2014, 169, 209 RSC.
- Eqn (16) refers to a boundary between R–AR domains, whose thickness mismatch is equal to Δ0, and for large R the estimated parameters give line tension Γ ≈ 2 pN. For an R–R boundary the thickness mismatch would double to 2Δ0 ≈ 2a ≈ 1.6 nm, yielding line tension Γ ≈ 8 pN. For this thickness mismatch, the estimate made in ref. 23 is Γ = 6 ± 2 pN, using existing theory31 which has been shown to yield satisfactory agreement with available experiments.
- S. Ryu and W. Cai, Phys. Rev. E: Stat., Nonlinear, Soft Matter Phys., 2010, 82, 011603 CrossRef.
- H. Vehkamäki, Classical Nucleation Theory in Multicomponent Systems, Springer-Verlag, 2006 Search PubMed.
- H. Vehkamäki, A. Määttänen, A. Lauri, I. Napari and M. Kulmala, Atmos. Chem. Phys., 2007, 7, 309 CrossRef.
- Simulations with smaller values of the mismatch parameter Δ0 have been found to yield the same three kinetic classes as studied here2.
- E. J. Wallace, N. M. Hooper and P. D. Olmsted, Biophys. J., 2006, 90, 4104 CrossRef CAS PubMed.
- J. Fan, T. Han and M. Haataja, J. Chem. Phys., 2010, 133, 235101 CrossRef PubMed.
- J. Korlach, P. Schwille, W. W. Webb and G. W. Feigenson, Proc. Natl. Acad. Sci. U. S. A., 1999, 96, 8461 CrossRef CAS.
- C. Dietrich, L. Bagatolli, Z. Volovyk, N. Thompson, M. Levi, K. Jacobson and E. Gratton, Biophys. J., 2001, 80, 1417 CrossRef CAS.
- J. Zhang, B. Jing, V. Janout and S. L. Regen, Langmuir, 2007, 23, 8709 CrossRef CAS PubMed.
- S. Meinhardt, R. L. C. Vink and F. Schmid, Proc. Natl. Acad. Sci. U. S. A., 2013, 110, 4476 CrossRef CAS PubMed.
- B. Palmieri, T. Yamamoto, R. C. Brewster and S. A. Safran, Adv. Colloid Interface Sci., 2014, 208, 58 CrossRef CAS PubMed , special issue in honour of Wolfgang Helfrich.
- S. L. Veatch, O. Soubias, S. L. Keller and K. Gawrisch, Proc. Natl. Acad. Sci. U. S. A., 2007, 104, 17650 CrossRef CAS PubMed.
- J. Fan, M. Sammalkorpi and M. Haataja, Phys. Rev. Lett., 2008, 100, 178102 CrossRef.
- M. S. Turner, P. Sens and N. D. Socci, Phys. Rev. Lett., 2005, 95, 168301 CrossRef.
- D. Lingwood and K. Simons, Science, 2010, 327, 46 CrossRef CAS PubMed.
| This journal is © The Royal Society of Chemistry 2015 |