
 Open Access Article
 This Open Access Article is licensed under a
 Creative Commons Attribution 3.0 Unported Licence
Acoustic suppression of the coffee-ring effect†‡
Dileep
Mampallil
a,
Julien
Reboud
 a,
Rab
Wilson
a,
Douglas
Wylie
b,
David R.
Klug
b and
Jonathan M.
Cooper
*a
a,
Rab
Wilson
a,
Douglas
Wylie
b,
David R.
Klug
b and
Jonathan M.
Cooper
*a
aDivision of Biomedical Engineering, University of Glasgow, Oakfield Avenue, Glasgow, UK G12 8LT. E-mail: jon.cooper@glasgow.ac.uk; Tel: +44 1413305231
bInstitute of Chemical Biology, Imperial College London, South Kensington, SW7 2AZ, London, UK
First published on 20th July 2015
Abstract
We study the influence of acoustic fields on the evaporative self-assembly of solute particles suspended inside sessile droplets of complex fluids. The self-assembly process often results in an undesirable ring-like heterogeneous residue, a phenomenon known as the coffee-ring effect. Here we show that this ring-like self-assembly can be controlled acoustically to form homogeneous disc-like or concentrated spot-like residues. The principle of our method lies in the formation of dynamic patterns of particles in acoustically excited droplets, which inhibits the evaporation-driven convective transport of particles towards the contact line. We elucidate the mechanisms of this pattern formation and also obtain conditions for the suppression of the coffee-ring effect. Our results provide a more general solution to suppress the coffee-ring effect without any physiochemical modification of the fluids, the particles or the surface, thus potentially useful in a broad range of industrial and analytical applications that require homogenous solute depositions.
Introduction
Evaporation of droplets of complex fluids including colloidal suspensions and solutions of polymers and biomolecules on solid surfaces leaves behind residues with thick edges along the contact line. This phenomenon, known as the coffee-ring effect,1–3 is caused by the combination of two effects: the pinning of the contact line of the droplet on the solid surface and the resulting convective flux of liquid that transports the suspended particles towards the contact line. The resulting heterogeneous self-assembly of solute particles and macromolecules has important implications in a number of fields including printing,4 biochemical analysis,5–8 and in understanding the basics of evaporative self-assembly,3,9,10 fractures during self-assembly11,12 and the collective motion and adhesion of bacterial colonies.13,14Mitigating the coffee-ring effect is a long-standing problem as inhomogeneous solute depositions are undesirable in many industrial and analytical applications, for example, printing, fluorescent microarrays and MALDI§ spectrometry.4–8 Thus, it led to a range of solutions that involve preventing the pinning of the contact line or preventing the deposition of solutes near the contact line. The former can be achieved by using hydrophobic surfaces with low contact angle hysteresis15 or electrowetting16 induced oscillations of the contact line17,18 to counter the hysteresis. These methods are not suitable when the surface is required to be hydrophilic. In such scenarios, introducing flows that counteract the evaporation-driven ones can minimize the deposition of solutes at the contact line. This is often achieved by generating Marangoni flows13,19 by adding surfactants to the droplet, heating the substrate20 or introducing electric fields.21,22 To avoid the use of chemicals or the application of heat or electric fields, recent strategies have involved capturing the solute particles in force fields, simply preventing them from being carried along with the evaporation-driven flows. In this case, the coffee-ring effect is suppressed regardless of the presence of the pinning of the contact line and the resulting flows towards the contact line. Anyfantakis et al. demonstrated this strategy of capturing the particles using photosensitive cationic surfactants, which induced stickiness of anionic nanoparticles at the air–water interface blocking the transport of the particles to the contact line.23 A similar, but additive-free, strategy was demonstrated by using ellipsoidal particles in the droplet.24 In this case, the shape-dependent capillary attractions caused the particles to form arrested structures at the air–water interface, finally forming homogeneous disc-like residues. This method is suitable for hydrophilic surfaces. Unfortunately, it is successful only when large amounts of ellipsoidal particles are present in the droplet. Methods that involve modification of the solute particles or the fluids may not allow dynamic control of the suppressing process. Thus, in effect, a more generic method to control the coffee-ring effect without any physiochemical modification of the solute particle, the surface, and the fluids is lacking. A generic and simple method is required for the versatile conditions encountered in practical scenarios.
In seeking a simple and more general solution to this challenge, we study the interaction of surface acoustic waves (SAWs)25–29 with evaporating droplets of complex fluids, which involve colloidal suspensions, blood and solutions containing biomolecules. We introduce a new method involving SAWs to suppress the coffee-ring effect by preventing the transport of the particles towards the contact line. Recently, SAWs have been widely applied in microfluidic systems, e.g. for the formation of colloidal islands and erasure,25 the manipulation of colloidal particle and cells,27,28 diagnostics,29,30 nanoparticle self-assembly by acoustic wave atomization31 and to pattern nanowires.32 Here, we demonstrate that acoustic excitation forms concentric dynamic patterns of colloidal particles in evaporating droplets. This pattern formation inhibits the evaporation-driven convective transport of particles so influencing the process of colloidal self-assembly. We establish that the behaviour of the concentric circular patterns during evaporation follows dynamic changes in the distribution of the capillary waves at the liquid–air interface. Subsequently, we propose a threshold condition, corroborated empirically, to obtain the successful suppression of the coffee-ring effect. Our strategy offers a broader applicability as the acoustic forcing is effective independent of the shape of the particles or composition of the fluid. As a result, we can controllably produce concentrated spot-like or disc-like residues in a range of circumstances, including when the surface is hydrophilic (Fig. 1).
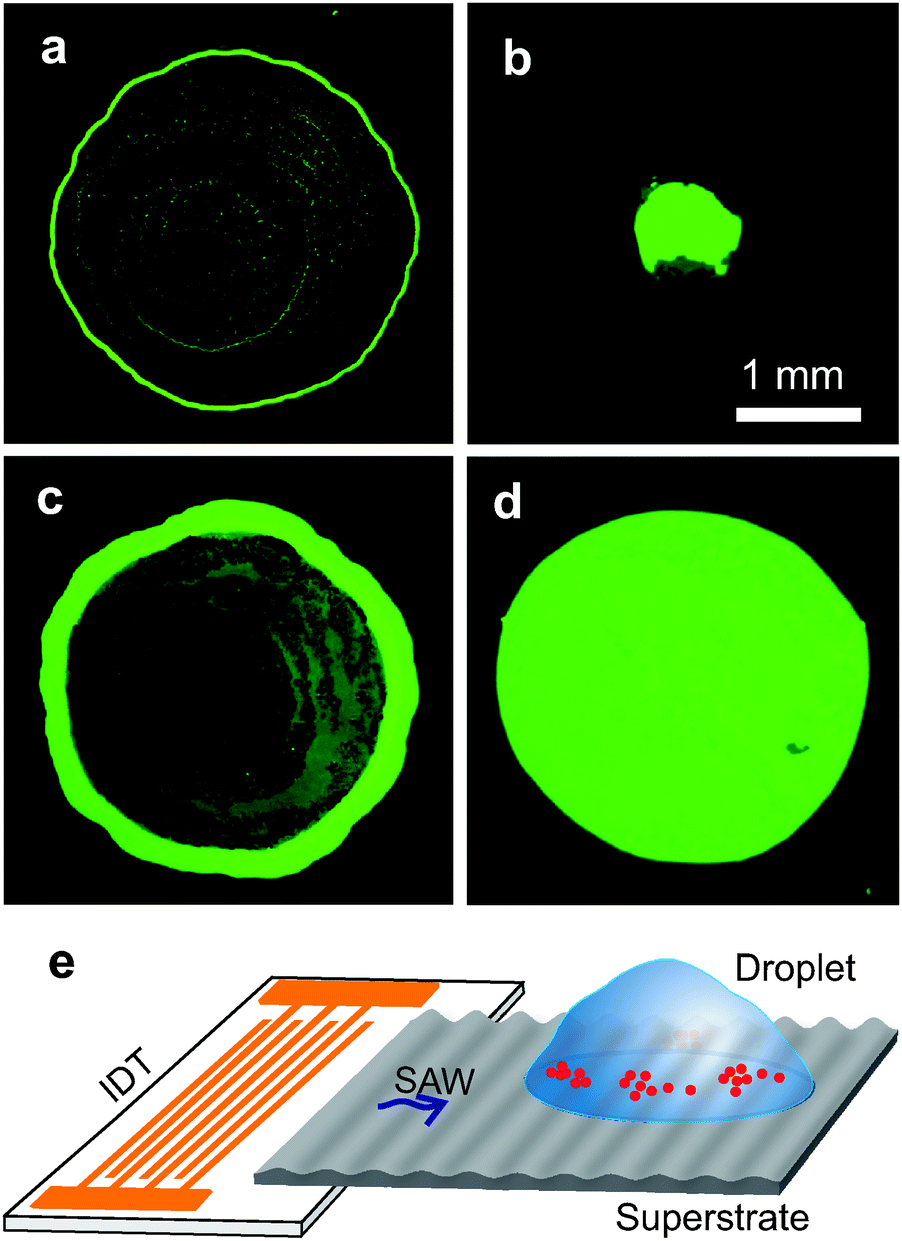 | ||
| Fig. 1 Fluorescent images of the residues formed by 2 μl water droplets containing polystyrene particles of diameter 2 μm on a hydrophilic glass surface when dried (a and c) undisturbed and (b and d) with the application of SAW. The applied frequencies were (b) 9.7 MHz and (d) 20 MHz, and the initial volume fractions of particles were (a and b) 0.1% and (c and d) 2.5%. A spot-like residue (b) is formed at lower volume fractions of particle while a disc-like one (d) is formed at increased frequencies and particle volume fractions (see main text). (e) Schematic illustration of the experimental setup. SAW, generated by the IDT, is coupled to the superstrate on which the droplet is deposited. (Illustration e is not to scale). | ||
Experiments
The experimental procedures are detailed in the ESI.† In short, Fig. 1 illustrates the experimental set-up, where SAWs were generated from an interdigitated transducer (IDT)29 and were coupled into a disposable superstrate29 on which the liquid droplet (typical volume 2 μl) was deposited and allowed to evaporate. This configuration allows the use of any surface, where acoustic waves can couple in, as the superstrate, at low cost. The IDT, described previously,29 consisted of gold interdigitated electrodes, with a pitch d = 350 μm, and width w = 175 μm on a 128° Y-cut X-propagating LiNbO3 wafer. Unless otherwise specified, we used standard microscope glass slides (having equilibrium and receding contact angles for water 28 ± 2° and 10 ± 2°, respectively) as the superstrate. In addition to working with glass, the experimental configuration also enabled us to investigate this phenomena on gold thin films, steel and hydrophobic surfaces.The droplets comprised of deionized water with dispersed polystyrene particles (Bangs Laboratories Inc.) or silica particles (Microparticle Germany) of diameter ranging from 0.1 to 10 μm (at volume fractions ranging from 0.05% to 5%), KCl or blood 10× diluted in phosphate buffered saline (PBS) solutions. Unless otherwise specified, the frequency and power applied to the IDT were 9.7 MHz and 30 dBm (or 1 W), respectively. The frequency was modulated periodically by sweeping linearly by 0.2 MHz with an interval of 2 s. The droplets were imaged through an inverted microscope (Zeiss) with a CCD camera (ProgRes, Jenoptik) or a fast camera (Motionscope).
Results
Effect of the acoustic fields
When the droplet is excited with SAWs, both standing acoustic pressure waves and standing capillary waves are formed in the droplet as illustrated in Fig. 2a. The particles are trapped in the nodes of these standing waves generating patterns. In Fig. 2b–g (also see Movie 1, ESI†), we demonstrate how these patterns change during the evaporation process in the case of a droplet containing polystyrene particles (density = 1.05 g cm−3). Immediately after applying the SAW, closely spaced concentric patterns formed, as the particles were trapped at the nodes of the standing acoustic pressure waves (Fig. 2b). The distance between two adjacent trapped regions was half the wavelength of the standing acoustic pressure waves, λPW/2 (inset of Fig. 2b). We measured this distance as 75 ± 7 μm (standard deviation of 10 measurements), consistent with the calculated value of λPW/2 (=76 μm), taking the speed of sound in water as 1480 m s−1 (at room temperature) and the mean applied frequency as 9.7 MHz. A few seconds after applying the SAWs, thick concentric accumulations of particles appeared near the liquid–air interface (Fig. 2, and Movie 1, ESI†). We observed that the separation between these concentric accumulations increased with time and the resulting number of contained circles decreased (Fig. 2c–f).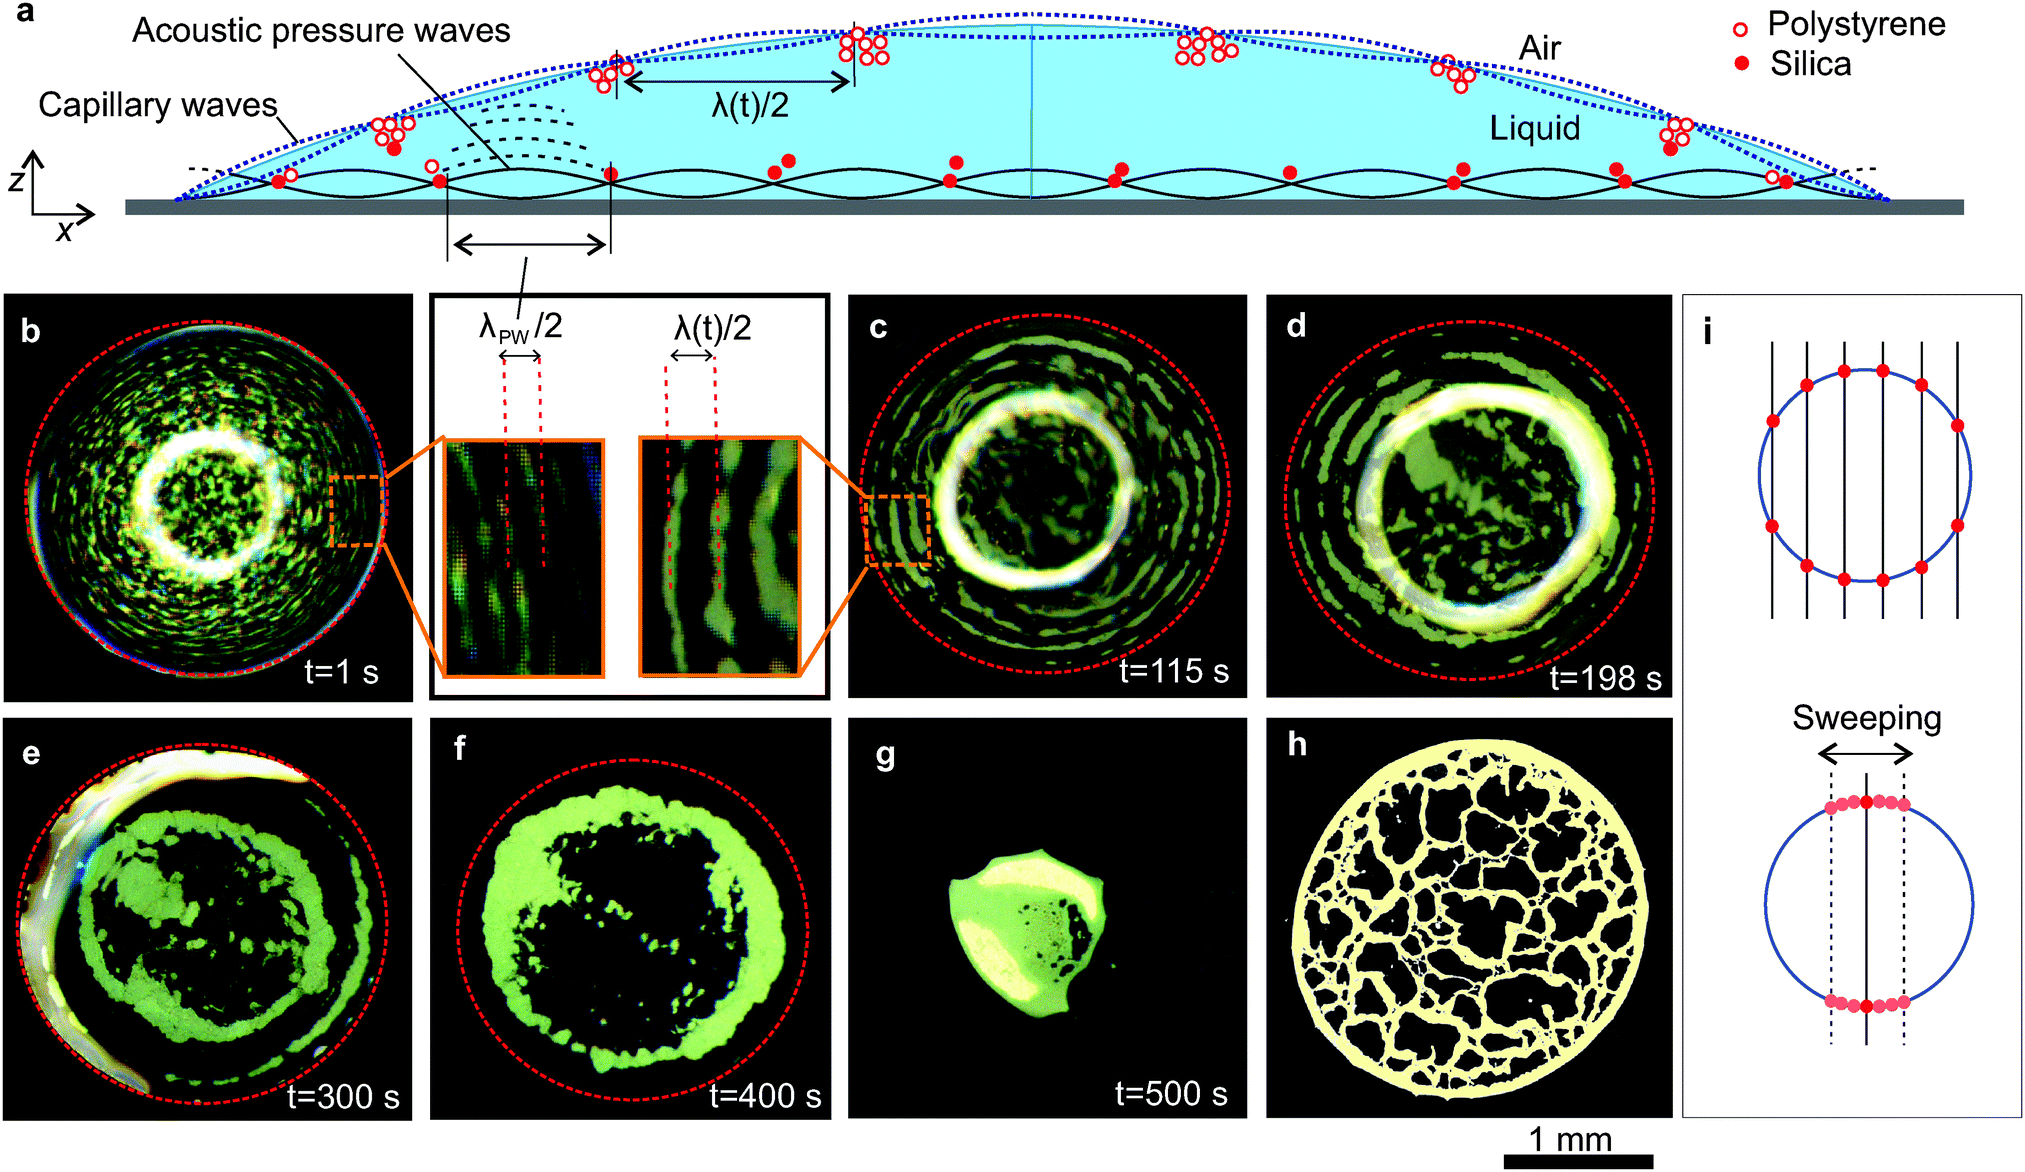 | ||
| Fig. 2 (a) Schematic illustration of a droplet excited by SAW. (b–h) Bright field images of drying of a droplet containing polystyrene particles of diameter 4.8 μm at an initial volume fraction of 0.5%. (b) Immediately after applying the SAW, particles are trapped in the nodal regions of standing acoustic pressure waves. (b-inset) The separation between these adjacent nodal regions is λPW/2. (c–f) After a few seconds, the majority of the particles are trapped in the nodal circles of the standing capillary waves. The separation between the nodal circles (λ/2) increases with time. (g) Finally, the droplet dries out to form a concentrated residue, which is significantly smaller than in the case of undisturbed drying (h). The red circle represents the edge of the droplet and the bright thick circles in (b)–(d) and streak in (e) are reflection of the illumination. (i) The intersection of high frequency standing acoustic pressure waves (represented by the lines) with a nodal circle of the standing capillary waves. Sweeping the frequency of SAW shifts the lines (only one is shown) filling the particles at the intersection (red filled circles) along the nodal circle. | ||
Using a scaling analysis, we show that these thick concentric accumulations of particles are nodal circles, which are dependent upon the nature of the capillary waves. In Fig. 3 (open symbols), we show how the distance λ/2 (half wavelength) between adjacent nodal circles changes during evaporation. The Rayleigh equation33 shows that the square of the angular frequency of the capillary resonant oscillations scales as ω2 ∼ R−3, where R is the radius of curvature of the droplet. Neglecting gravity, from the dispersion relationship for the capillary waves,34ω2 ∼ λ−3; this implies that λ ∼ R or λ ∼ sin![[thin space (1/6-em)]](https://www.rsc.org/images/entities/char_2009.gif) θ−1, where R = Rb/sinθ with Rb and θ being the base radius and contact angle of the droplet, respectively. In the inset of Fig. 3, we confirm this scaling relation by plotting log(λ) versus log(sinθ), obtaining a slope of −0.94 ± 0.07 (standard error) that is close to the expected value −1.0 (so confirming that the concentric accumulations near the liquid–air interface are dependent upon the capillary waves). The solid line in the main figure corresponds to the fit in the inset considering the fact that θ decreased linearly with time until t/tevp ∼ 0.8 when the contact line started to recede.
θ−1, where R = Rb/sinθ with Rb and θ being the base radius and contact angle of the droplet, respectively. In the inset of Fig. 3, we confirm this scaling relation by plotting log(λ) versus log(sinθ), obtaining a slope of −0.94 ± 0.07 (standard error) that is close to the expected value −1.0 (so confirming that the concentric accumulations near the liquid–air interface are dependent upon the capillary waves). The solid line in the main figure corresponds to the fit in the inset considering the fact that θ decreased linearly with time until t/tevp ∼ 0.8 when the contact line started to recede.
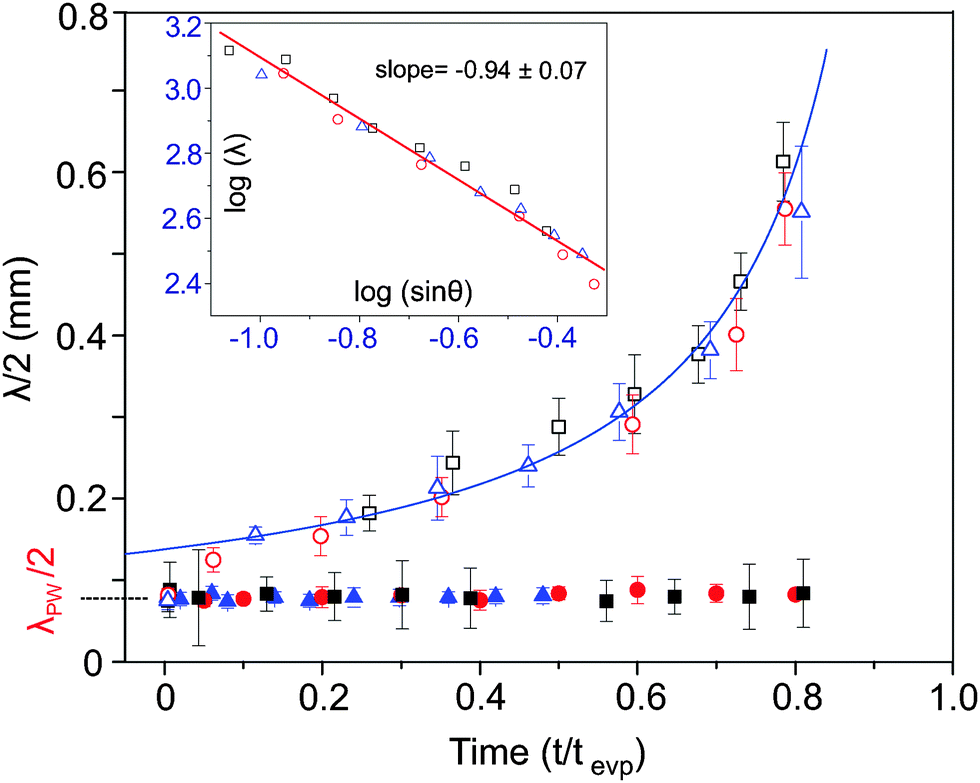 | ||
| Fig. 3 Distance (λ/2) between adjacent nodal circles as a function of time (t/tevp). Droplets contained polystyrene or silica particles of diameter 4.8 μm at an initial volume fraction 0.5%. Initially the separation between the adjacent nodal regions is equal to λPW/2 for both polystyrene (open symbols) and silica particles (filled symbols), as they are trapped in the nodes of the standing pressure waves. A few seconds after applying the SAW, lighter polystyrene particles get trapped in the nodal regions dictated by the capillary waves, and λ/2 increases as the shape of the droplet changes during the evaporation. Silica particles are trapped only at the nodes of the acoustic pressure waves and thus λ/2 stays constant at λPW/2 during the evaporation. Inset shows inverse linear scaling (expected slope −1) between log(sin(θ)) and log(λ). The solid line in the main figure corresponds to the fit in the inset (see main text). The time is normalized by tevp, the time taken for complete drying of a droplet. The different colours/symbols represent three different droplets. The error bars are the standard deviation of at least 12 different data points taken from different locations in the droplet. | ||
Both capillary waves and acoustic pressure waves interact within the droplet. As a result, colloidal islands are formed due to the accumulation of particles at nodal regions where the standing pressure waves and capillary waves intersect.25 We periodically varied the frequency of the SAW by 0.2 MHz with an interval of 2 s, moving the individual islands along the nodal circle of the standing capillary wave and filling the entire nodal circle with particles (Fig. 2i). The characteristics of capillary waves are defined by the dimensions of the droplet, whereas the pressure waves are linked to the acoustic excitation. Small variations in the acoustic excitation frequency do not change the position of the nodal circle of the standing capillary waves, but do change the position of the nodal point where the standing capillary waves and pressure waves intersect. Therefore particles in the islands are distributed along the nodal circle of the capillary waves. It also facilitated visualizing the nodal circles of the standing capillary waves as concentric particle accumulations. We noted that the islands-like patterns tend to reappear when frequency sweeping was stopped.
To decouple the effects of the standing capillary waves near the liquid–air interface from those caused by the pressure waves that are dominating near the superstrate surface within the liquid, we evaporated droplets containing dispersions of silica particles, which, due to their higher density (1.9 g cm−3) sink to the liquid–superstrate interface. The silica particles were trapped in the nodes of standing acoustic pressure waves (Fig. S2 in the ESI†) and the separation between the adjacent accumulations remained constant as λPW/2 (Fig. 3, filled symbols) during the evaporation. λPW is determined by the frequency of the SAW which remained constant at the mean value of 9.7 MHz. As the height of the droplet decreased and the liquid–air interface approached the superstrate surface, some of the particles were trapped in the nodal circle of the capillary waves as seen in Fig. S2 and Movie 2 (ESI†).
Our results with polystyrene and silica particles demonstrate that two different patterns co-exist in the droplet: one, due to the standing acoustic pressure waves alone within the fluid, a second due to the regions defined by the intersection of the nodes of standing capillary and pressure waves, close to the air–liquid interface. The contribution of particles to these patterns depends on their position in the droplet.
Suppression of the coffee-ring effect
Since the particles are trapped within the patterns, the evaporation-driven capillary flow cannot transport them towards the contact line. Therefore, the contact line remains free of particle deposits and recedes freely. We observed that regardless of the type of the particle in the droplet, the contact line recedes after ∼80% of the total evaporation time (on the glass surfaces). Eventually, the trapped particles converged to form a spot-like residue, suppressing the coffee-ring effect (Fig. 1b and 2g).The spot-like residues are formed only when the initial particle concentration is low. As the initial particle concentration increases in the droplet, the size of the residues also increases. At higher frequencies of SAW, the separation between the contact line and the nearest nodal region λPW/4 is short, which may result in the pinning of the contact line due to the close proximity of particles, especially at increased particle concentrations or when the particle size is comparable to λPW/4 (vide infra). Also when the frequency increases (wavelength decreases) the nodal regions in the droplet are more closely spaced. When the initial particle concentration is high, the contact line stays pinned. These scenarios, with frequency 20 MHz and volume fraction 2.5%, resulted in a uniform disc-like residue (Fig. 1d). For the same volume fraction, when the frequency was 9.7 MHz, disc-like residues were also formed, although they showed regions of lower particle density (Fig. S3 in ESI†).
Threshold condition for successful suppression
The competition between the acoustic force driving the particles towards the nodes, and the force due to the evaporation driven capillary flows dragging the particles out of the nodes, determines the success of the suppression process. For simplicity, we consider only the transport of particles towards the nodes of standing pressure waves, while the effects of capillary waves are neglected (ESI†). The evaporation driven capillary flows exert a Stokes drag force, 6πηauevp on the particle (η is the liquid viscosity, a is the diameter of the particle and uevp is the evaporation-driven flow velocity). We measured uevp 100 μm away from the contact line in a droplet evaporated on a glass surface, through tracking the particles on a microscope video. Fig. 4a shows that uevp, stayed constant until it increased sharply at the end of the evaporation process, consistent with the findings of Marin et al.9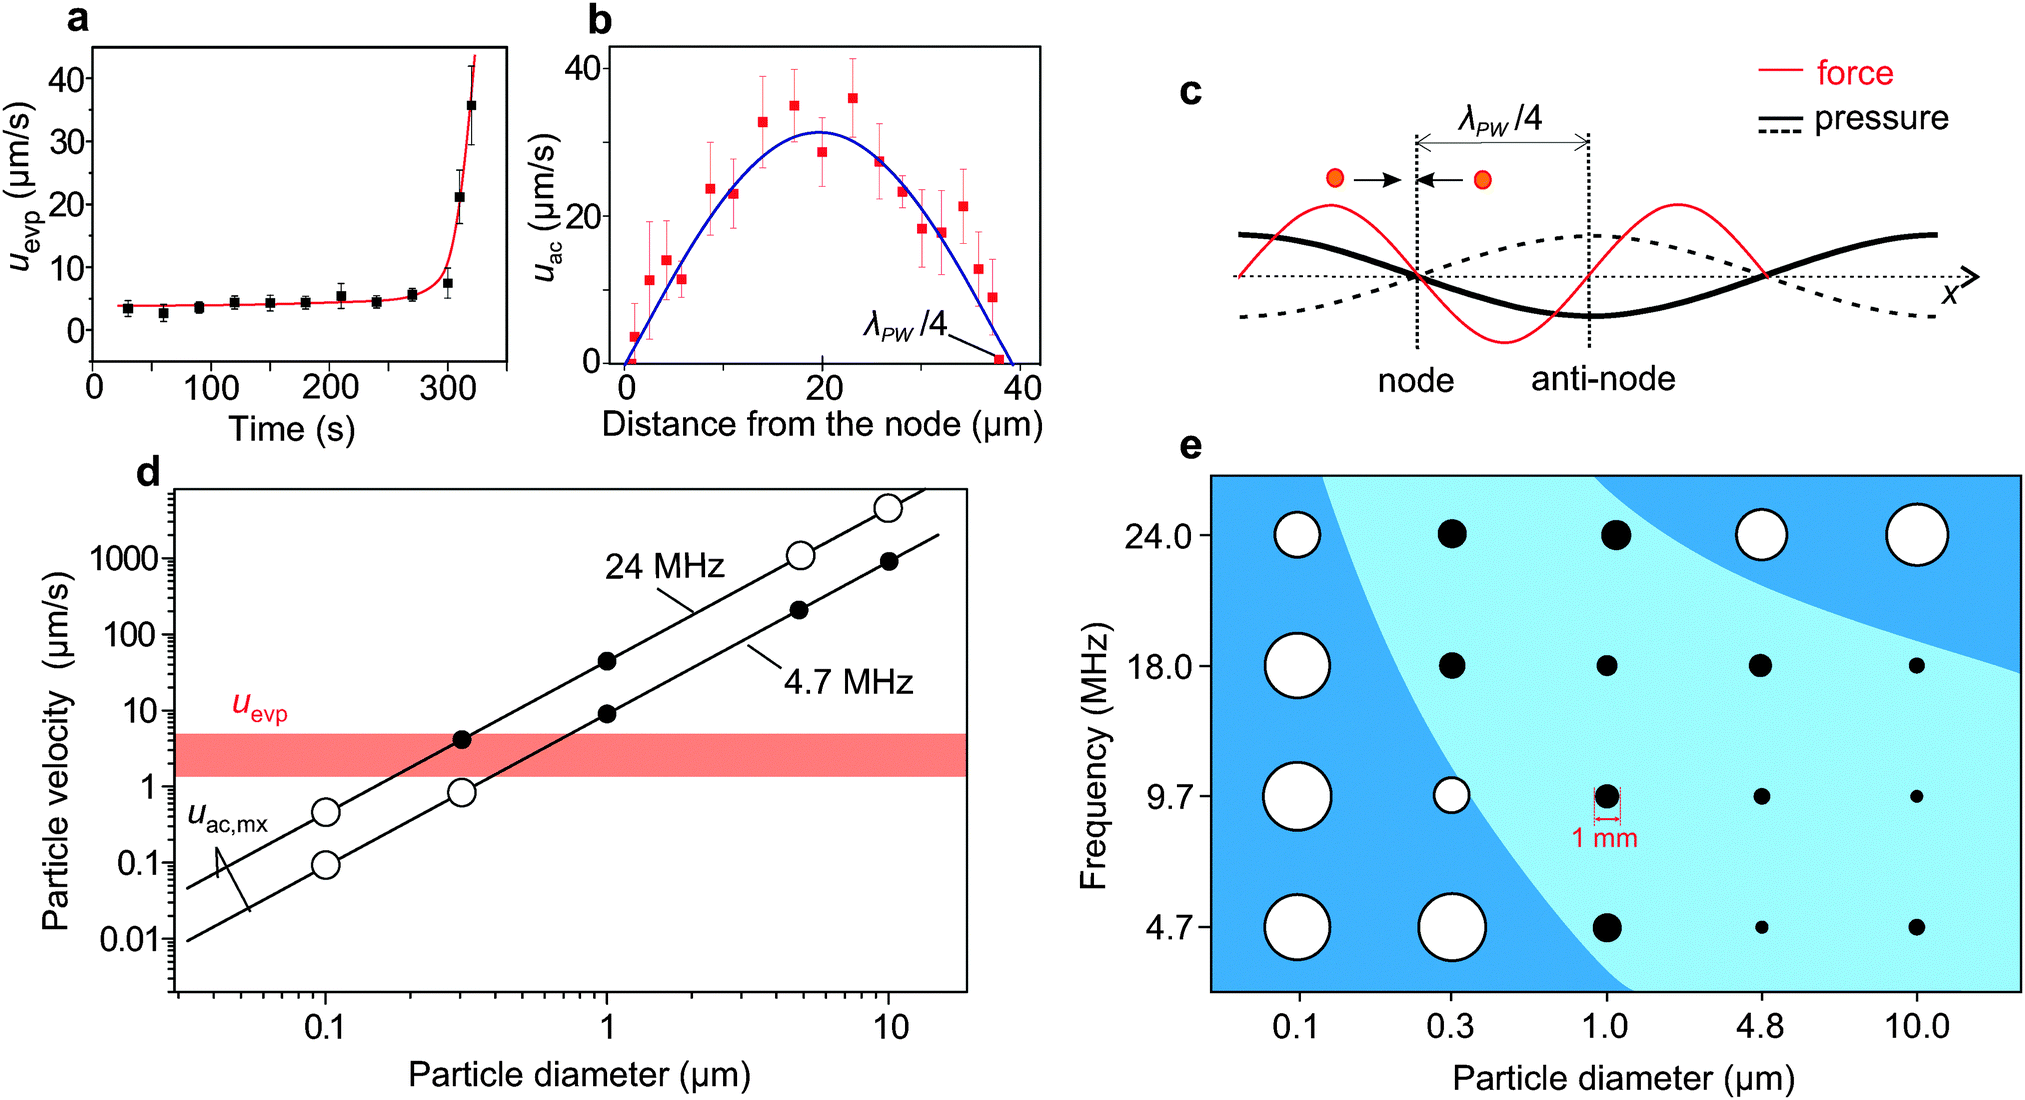 | ||
| Fig. 4 (a) Without SAW, the evaporation-driven flow velocity (uevp) stays constant until the end of the drying process when it increases sharply. The solid line is a guide to the eyes. (b) uac varies sinusoidally along a distance λPW/4 from a node. The input power and frequency were 21 dB m and 9.7 MHz, respectively. The solid line is a sinusoidal fit. The error bars are the standard deviation of at least ten particle trajectories. (c) Illustration of the pressure and the force variation in the acoustic standing wave. (d) Calculated value of uac,mx (maximum value of uac) for Eac = 4 J m−3 (∼32 dB m) as a function of particle diameter at two frequencies. The red shaded region represents the initial constant value of uevp (3.5 ± 2.2 μm s−1) obtained from (a) with the width of the shading being the standard deviation. The open and filled circles represent un-suppressed and suppressed states, respectively. The suppression requires that uac,mx > uevp. At 24 MHz, the suppression did not occur with large particles (4.8 and 10 μm) since they are trapped too close (λPW/4 = 15 μm) to the contact line obstructing its receding. (e) Spot size as a function of the frequency and particle diameter. The maximum standard deviation is 15%. The region shaded in light blue illustrates the parameter space where the suppression occurs, while it is unsuccessful in the darker blue regions. The particles were of polystyrene with diameter 4.8 μm (vol. fraction 0.05%.). | ||
When SAW was applied, the acoustic force (1D)28 on a spherical particle with a ≪ λPW, in a planar standing wave can be written as,
| Fac(x) = 4π a3kEacΦ sin(2kx), | (1) |
 | (2) |
For polystyrene particles in water, eqn (2) can reduce to uac,mx = 0.47 (a2fEac). In the steady state, due to the direct correspondence between forces and velocities, arising from the balance between the acoustic force and the drag force, one would expect that for the condition uac,mx > uevp the particles trapped by the acoustic force cannot be dragged away by the evaporation-driven capillary flows, resulting in the suppression of the coffee-ring effect.
The experimental parameters (a, f and Eac) present in eqn (2) can be adjusted to obtain the condition uac,mx > uevp. We calculated the values of uac,mx from eqn (2) as a function of a, at fixed values of f (=4.7 and 24.0 MHz) and Eac (=4 J m−3 ∼ 32 dB m), as plotted in Fig. 4d, confirming that when uac,mx < uevp the coffee-ring effect was not suppressed (e.g. 0.1 and 0.3 μm particles). However, when uac,mx > uevp, the effect was suppressed (e.g. 1.0, 4.8 and 10.0 μm particles), as represented by open and filled circles, respectively.
Fig. 4d (also eqn (1)) suggests a monotonous behaviour, where large particles should still be affected for frequencies used for smaller particles. Surprisingly, at 24 MHz, no suppression was found with larger particles (over 4.8 μm), while suppression could be achieved with 0.3 and 1 μm particles. This could be explained by the fact that the separation, λPW/4 (=15.2 μm), between the contact line and the nearest nodal region is on the same scale as the particle diameter (4.8 and 10 μm). The proximity of the trapped particles to the contact line enhanced its pinning. These aspects are summarised in Fig. 4e for (a = 0.1, 0.3, 4.8 and 10 μm) and (f = 4.7, 9.7, 18 and 24 MHz).
The technique that we have developed is applicable in a wide range of circumstances. It is successful on other superstrates materials, where the acoustic waves can propagate, for example, gold and steel. These hydrophilic surfaces, when used without SAW (i.e. undisturbed drying) lead to the appearance of pronounced coffee-rings, due to their low receding contact angles (62 ± 21° (35 ± 21°) and 64 ± 21° (20 ± 21°), respectively, for water droplets (ESI†)). Finally, the technique is also successful with droplets of biological samples such as blood (diluted 10× in PBS), where the particles of interest are the blood cells, and bovine serum albumin (10 mg ml−1) solution with dispersed polystyrene particles (ESI†). Since the abundant proteins cannot be trapped acoustically due to their small size, they accumulated at the contact line producing thick edges in both cases. However, the particles (blood cells or polystyrene particles) in the solutions are concentrated at a spot. The presence of salt is an important factor influencing the evaporative self-assembly process35 by determining the strength of electrostatic interactions between the particles and the surface due to the formation of electric double layers. Crystallization of the salt at the contact line also enhances the pinning. Varying the salt (KCl) concentrations in water (up to 1 M), we confirmed that our technique is able to prevent the coffee-ring effect until the solution becomes saturated, creating crystals within the drop and on the surface (Fig. 5).
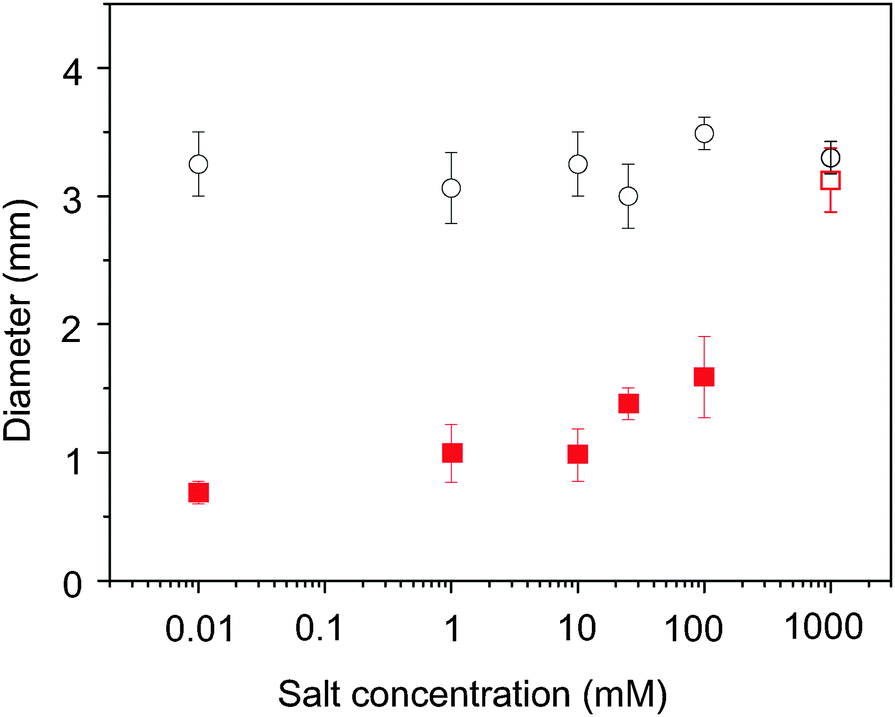 | ||
| Fig. 5 The residue size (the diameter of the smallest circle that encloses all of the residue) as a function of salt (KCl) concentration in the droplet. Rectangles and circles represent the evaporation process with and without the application of SAWs, respectively. The filled symbols represent a successful suppression. Above 10 mM concentration, the size increased because the residue contained the salt crystals also. At 1 M concentration the suppression did not occur due to the formation of large crystals within the drop during the evaporation. The initial droplet of volume 2 μl contained polystyrene particles of diameter 4.8 μm with an initial volume fraction of 0.05%. | ||
Although hydrophobic surfaces can alleviate the coffee-ring effect, they are not effective in combination with droplets containing molecules that adsorb onto the surface or large concentration of solute particles. In this respect, we also show that our method can overcome both these challenging conditions, as demonstrated using a hydrophobized silicon superstrate (ESI†). Even when the receding contact angle is 0°, i.e. when the contact line is pinned during the entire drying process as in the case for a glass surface treated with oxygen plasma, suppression and partial spot-like accumulation of particles were achieved (ESI†).
Discussion
Whilst the trapping of particles at the nodes of the standing waves is the main mechanism that suppresses the coffee-ring effect, the technique also benefits from other effects linked to acoustic actuation, such as levitation effects36 and the continual displacement of the particles due to sweeping the frequency, both of which decrease surface adherence. The sweeping of the frequency did not affect trapping since the typical time (λPW/4)/uac,mx for trapping (for example, 0.1 s at 31 dB m) is much shorter than the sweeping interval (2 s).Our method is non-invasive, i.e., it neither requires chemical additives nor does it require electric fields. Methods that introduce electric fields or surfactants (for generating Marangoni flows) in the droplet can interfere with the sample. Additionally, electrode patterning on the surface and the required precision of deposition of droplets add to the complexity of these methods.
Further advantages include the observation that our technique is independent of the wetting nature of the surface and does not require any modification to the surface or particles. It is compatible with particles of different size and densities, and a wide range of surfaces onto which the SAW can be coupled. These advantages have the potential to provide more generic and useful solutions in various applications such as printing, microarrays and mass spectrometry.4–8,37
Conclusions
We demonstrate that self-assembly can be controlled in droplets of complex fluids by simply evaporating them on solid surfaces onto which acoustic waves are coupled. The dynamic patterns of solute particle formed inside the droplet inhibit the evaporation driven transport of the particles towards the contact line, thereby suppressing the coffee-ring effect. Thus, our method, which is non-invasive and versatile, provides a solution to a problem where previously proposed techniques15–24 have encountered limitations.Acknowledgements
Authors are grateful for EPSRC support (EP/I017887/1 – Proxomics). JMC acknowledges EPSRC support (EP/K027611/1) and his ERC advanced investigator award (340117 – Biophononics). JR acknowledges a Lord Kelvin and Adam Smith research fellowship (University of Glasgow). We thank Prof Richard Burchmore (GU), Dr Andrew Glidle (GU) and Prof Andrew Pitt (Aston) for fruitful discussions, and Dr Lisa D. Haigh (IC) for experimental support.Notes and references
- R. D. Deegan, O. Bakajin, T. F. Dupont, G. Huber, S. R. Nagel and T. A. Witten, Nature, 1997, 389, 827–829 CrossRef CAS.
- R. D. Deegan, O. Bakajin, T. F. Dupont, G. Huber, S. R. Nagel and T. A. Witten, Phys. Rev. E: Stat. Phys., Plasmas, Fluids, Relat. Interdiscip. Top., 2000, 62, 756–765 CrossRef CAS.
- W. D. Ristenpart, P. G. Kim, C. Domingues, J. Wan and H. A. Stone, Phys. Rev. Lett., 2007, 99, 234502 CrossRef CAS.
- J. Park and J. Moon, Langmuir, 2006, 22, 3506–3513 CrossRef CAS PubMed.
- R. Blossey and A. Bosio, Langmuir, 2002, 18, 2952–2954 CrossRef CAS.
- V. Dugas, J. Broutin and E. Souteyrand, Langmuir, 2005, 21, 9130–9136 CrossRef CAS PubMed.
- S. Weidner, P. Knappe and U. Panne, Anal. Bioanal. Chem., 2011, 401, 127–134 CrossRef CAS PubMed.
- J. B. Hu, Y. C. Chen and P. L. Urban, Anal. Chim. Acta, 2013, 766, 77–82 CrossRef CAS PubMed.
- A. G. Marin, H. Gelderblom, D. Lohse and J. H. Snoeijer, Phys. Rev. Lett., 2011, 107, 085502 CrossRef.
- P. J. Yunker, M. A. Lohr, T. Still, A. Borodin, D. J. Durian and A. G. Yodh, Phys. Rev. Lett., 2013, 110, 035501 CrossRef.
- E. R. Dufresne, E. I. Corwin, N. A. Greenblatt, J. Ashmore, D. Y. Wang, A. D. Dinsmore, J. X. Cheng, X. S. Xie, J. W. Hutchinson and D. A. Weitz, Phys. Rev. Lett., 2003, 91, 224501 CrossRef CAS.
- A. Sarkar and M. S. Tirumkudulu, Phys. Rev. E: Stat., Nonlinear, Soft Matter Phys., 2011, 83, 051401 CrossRef.
- W. Sempels, R. De Dier, H. Mizuno, J. Hofkens and J. Vermant, Nat. Commun., 2013, 4, 1757 CrossRef PubMed.
- T. V. Kasyap, D. L. Koch and M. Wu, Phys. Fluids, 2014, 26, 111703 CrossRef PubMed.
- L. H. Mujawar, W. Norde and A. van Amerongen, Analyst, 2013, 138, 518–524 RSC.
- F. Mugele and J. C. Baret, J. Phys.: Condens. Matter, 2005, 17, R705–R774 CrossRef CAS.
- H. B. Eral, D. Mampallil, M. H. G. Duits and F. Mugele, Soft Matter, 2011, 7, 4954–4958 RSC.
- D. Mampallil, H. B. Eral, D. van den Ende and F. Mugele, Soft Matter, 2012, 8, 10614–10617 RSC.
- H. Hu and R. G. Larson, J. Phys. Chem. B, 2006, 110, 7090–7094 CrossRef CAS PubMed.
- Y. Li, C. Lv, Z. Li, D. Quéré and Q. Zheng, Soft Matter, 2015, 11, 4669–4673 RSC.
- S. J. Kim, K. H. Kang, J. G. Lee, I. S. Kang and B. J. Yoon, Anal. Chem., 2006, 78, 5192–5197 CrossRef CAS PubMed.
- A. W. Wray, D. T. Papageorgiou, R. V. Craster, K. Sefiane and O. K. Matar, Langmuir, 2014, 30, 5849–5858 CrossRef CAS PubMed.
- M. Anyfantakis and D. Baigl, Angew. Chem., Int. Ed., 2014, 53, 14077–14081 CrossRef CAS PubMed.
- P. J. Yunker, T. Still, M. A. Lohr and A. G. Yodh, Nature, 2011, 476, 308–311 CrossRef CAS PubMed.
- H. Li, J. R. Friend and L. Y. Yeo, Phys. Rev. Lett., 2008, 101, 084502 CrossRef.
- L. Y. Yeo and J. R. Friend, Annu. Rev. Fluid Mech., 2014, 46, 379–406 CrossRef.
- X. Ding, S.-C. Steven Lin, B. Kiraly, H. Yue, S. Li, I.-K. Chiang, J. Shi, S. J. Benkovic and T. J. Huang, Proc. Natl. Acad. Sci. U. S. A., 2012, 109, 11105–11109 CrossRef CAS PubMed.
- R. Barnkob, P. Augustsson, T. Laurell and H. Bruus, Phys. Rev. E: Stat., Nonlinear, Soft Matter Phys., 2012, 86, 056307 CrossRef.
- J. Reboud, R. Wilson, Y. Zhang, M. H. Ismail, Y. Bourquin and J. M. Cooper, Lab Chip, 2012, 12, 1268–1273 RSC.
- J. Reboud, Y. Bourquin, R. Wilson, G. S. Pall, M. Jiwaji, A. R. Pitt, A. Graham, A. P. Waters and J. M. Cooper, Proc. Natl. Acad. Sci. U. S. A., 2012, 109, 15162–15167 CrossRef CAS PubMed.
- K. C. Ng, A. Qi, L. Y. Yeo, J. Friend and W. Chen, Proc. SPIE 8204, 2011, Smart Nano-Micro Materials and Devices, 820434.
- Y. Chen, X. Ding, S.-C. S. Lin, S. Yang, P.-H. Huang, N. Nama, Y. Zhao, A. A. Nawaz, F. Guo, W. Wang, Y. Gu, T. E. Mallouk and T. J. Huang, ACS Nano, 2013, 7, 3306–3314 CrossRef CAS PubMed.
- L. Rayleigh, Proc. R. Soc. London, 1879, 29, 71–97 CrossRef.
- K. U. Ingard, Fundamentals of waves and oscillations, Cambridge University Press, 1993 Search PubMed.
- S. Paria, R. G. Chaudhuri and N. N. Jason, New J. Chem., 2014, 38, 5943–5951 RSC.
- D. Foresti, M. Nabavi, M. Klingauf, A. Ferrari and D. Poulikakos, Proc. Natl. Acad. Sci. U. S. A., 2013, 110, 12549–12554 CrossRef CAS PubMed.
- T. Maier, S. Klepel, U. Renner and M. Kostrzewa, Nat. Methods, 2006, 3 DOI:10.1038/nmeth870.
Footnotes |
| † Electronic supplementary information (ESI) available. See DOI: 10.1039/c5sm01196e |
| ‡ We would also want to draw the attention of the reader to the availability of the dataset associated with this paper, available here (http://dx.doi.org/10.5525/gla.researchdata.198). |
| § Matrix assisted laser desorption–ionization. |
| This journal is © The Royal Society of Chemistry 2015 |