 Open Access Article
Confined self-assembly of cellulose nanocrystals in a shrinking droplet†
Fernando
Jativa
ab,
Christina
Schütz
cd,
Lennart
Bergström
c,
Xuehua
Zhang
b and
Bernd
Wicklein‡
*d
aDepartment of Mechanical Engineering, University of Melbourne, Parkville, VIC 3010, Australia
bDepartment of Civil, Environmental & Chemical Engineering, RMIT University, Melbourne, VIC 3001, Australia
cDepartment of Materials and Environmental Chemistry, Stockholm University, 106 91 Stockholm, Sweden
dWallenberg Wood Science Center, KTH, Teknikringen 56, 100 44 Stockholm, Sweden. E-mail: bernd@icmm.csic.es
First published on 4th June 2015
Abstract
We have studied how cellulose nanocrystals (CNC) self-assemble into liquid crystalline phases in shrinking, isolated droplets. By adjusting the water dissolution rate of an aqueous CNC droplet immersed in a binary toluene–ethanol mixture we can control the final morphology of the consolidated microbead. At low ethanol concentration in the surrounding fluid dense microbeads of spherical morphology are produced while collapsed core–shell particles are obtained at high ethanol concentration. Polarized light microscopy was used to follow the spatial evolution and coalescence of birefringent spheroids during droplet shrinkage. Electron microscopy reveals the resultant nematic microstructure. This method of confined CNC assembly provides thus the possibility to prepare ordered microbeads, which can be useful as templates or for their optical properties.
Introduction
Disintegration of plant fibres by e.g. acid hydrolysis liberates nanocellulose in different forms.1 The outstanding mechanical properties and good chemical durability of this biodegradable biopolymer2 makes it an important component in the fabrication of devices and new materials for various technical and biomedical applications.3,4 Gray and coworkers showed that the rod-like cellulose nanocrystals (CNC) can form liquid crystalline phases5–7 and recent work has illustrated how environmentally benign high-performance materials can be designed by biomimetic self-assembly routes.3,8 In this way, chiral nematic films can be prepared that display optical properties such as iridescence or birefringence.9,10Previous work has shown that the formation of the chiral nematic phase primarily depends on the aspect ratio, the CNC concentration and on particle interactions.5,11 Liquid crystal self-assembly competes with gelation and/or glass formation at high CNC concentrations where the mobility of the CNC rods becomes restricted locking the system into an arrested or “frozen” state.11 While the (equilibrium) phase behavior of CNC at low and moderate concentrations (up to 1–7 vol%) is relatively well understood,11 the assembly at higher concentrations and under confined conditions has only been sparsely investigated. Recent work by Mu and Gray12 suggests that modifying the onset of gelling by e.g. the addition of glucose, can control the helicoidal arrangement of CNC rods in dried films.
While evaporation of water from a dilute dispersion of CNC that is spread onto a substrate can produce films with chiral nematic structures, studies on how to produce CNC materials with a chiral nematic structure in other shapes, e.g. as microspheres, are sparse. Structured nanocellulose microspheres are of interest for controlled delivery of e.g. drugs and fragrances.13 Assemblies of optically active colloidal particles can also be used to produce discrete colloidal crystals with photonic properties or serve as templates for synthesis of inverted opals.14,15 Using shape anisotropic colloids such as the rod-shaped cellulose nanocrystals opens up possibilities for producing microspheres with diverse microstructures (ordered or amorphous) and different textures (nematic, smectic, or cholesteric).16,17
The most common method to form spherical colloidal arrays is based on evaporation induced self-assembly of drops of colloidal dispersions.16,18–20 However, the control over the drying rate is not always easy and may thus compromise the quality of the assembled structure.19 Zhang and coworkers21,22 have recently shown how two dimensional nanosheets can assemble into microspheres by dissolution of an isolated droplet dispersion that is immersed in a binary liquid phase. This method allows the dissolution rate to be controlled by the composition of the surrounding binary liquid phase and also yield assemblies in the form of microbeads.
Here, we study shrinking droplets of aqueous cellulose nanocrystal dispersions by a combination of real-time polarized microscopy of the emerging liquid crystalline phase with electron microscopy of the surface and fractured spheres. We show that liquid crystalline tactoids that form at low shrinkage rates first occur close to the surface of the droplet and then eventually fuse together and form large ordered domains as the CNC concentration increases. The CNC assembly is arrested at high shrinkage rates and results in the formation of a rigid shell at the droplet surface that eventually results in collapsed dry spheres with a hollow interior.
Experimental section
1. Materials and chemicals
Cellulose nanocrystals (CNC) were prepared by hydrochloric acid hydrolysis of Tempo (2,2,6,6-tetramethylpiperidine-1-oxyl)-mediated oxidized cellulose nanofibres (CNF) displaying surface –COOH groups.23 In brief, hydrochloric acid was added to 1 g of CNF to reach a final concentration of 2.5 M and the mixture was heated to 130 °C for 6 h. The reaction was quenched by dilution with deionized water. The resulting suspension was washed and the precipitant was collected and dialyzed against de-ionized water. After dialysis the suspension was sonicated for 10 min (Sonics Vibracell, USA) and centrifuged to obtain isolated nanocrystals. The concentration of the final CNC dispersion was 0.75 vol% and polyelectrolyte titration revealed a surface charge of 0.31 mmol g−1. The crystals have a length distribution of 264 ± 118 nm and a thickness distribution of 2.9 ± 1.3 nm as determined by analysis of AFM images (Fig. S1, ESI†). The crystals consist of tightly packed β(1–4) linked D-glucose chains held together by extensive hydrogen bonding and van der Waals forces,2 which effectively impede water penetration and subsequent swelling.242. Droplet dissolution rate
Dissolution of aqueous droplets containing 0.3 or 0.75 vol% CNC was carried out in 20 ml of different binary toluene–ethanol solutions containing 0.5, 1, 5, 10, and 15 vol% of ethanol, respectively. Toluene (≥99.9 vol%) and ethanol (98 vol%) were purchased from Sigma-Aldrich. Droplets of 1–10 μl were placed on hydrophobic octadecyltrichlorosilane (OTS) coated silicon substrates,25 which were immersed in the binary solution. The experiment was performed in a glass vial that was cleaned with a sodium hydroxide solution (10 g ml−1) for 30 min, rinsed with Milli-Q® water and ethanol and finally oven dried at 60 °C before usage. The dissolution dynamics were assessed by monitoring the droplet size over time. A contact angle measurement system (OCA20, Dataphysics Instruments GmbH, Germany) recorded side-view images of the shrinking droplet in a sealed glass container at different times (Fig. S2, ESI†). Each image was analyzed using automated shape recognition software (SCA202, DataPhysics Instruments), which evaluated the shape of the droplet and calculated its volume and the equivalent radius of a sphere, respectively.3. Droplet imaging
Real-time polarized video microscopy of the liquid crystal formation in the shrinking droplets was performed using a Nikon Eclipse FN1 light microscope (Japan). The aqueous CNC-containing droplet was placed in a custom-made, aluminium container with a cover plate that has a glass window to allow for reflection polarized microscopy imaging. The container was placed between cross-polarizers and the videos were recorded using an inline camera with 2 megapixel CCD sensor (Kappa Zelos-02150C GV, Kappa Optronics GmbH, Germany). The frame rate was adjusted according to the shrinkage rate of the droplets.4. Microstructural characterization
The surface of air-dried CNC microspheres was imaged by scanning electron microscopy (SEM). The microspheres were deposited on double-sided carbon tape and coated with either gold or carbon nanoparticles. The SEM images were acquired using a Philips XL30 field-emission (FE)-SEM and a JEOL JSM-7401F FE microscope for high-resolution SEM images. The internal structure of dried CNC spheres was characterized by transmission electron microscopy (TEM) of ultramicrotome-sectioned samples. CNC spheres were incubated twice in 100% LR-white resin and subsequently embedded in capped gelatin capsules. After a polymerization step at 60 °C for 24 h the embedded spheres were sectioned with a diamond knife on a Leica Ultracut S microtome and ultra-thin sections (90 nm) were collected onto formvar-coated TEM grids. The sections were sequentially stained with saturated uranyl acetate for 10 min and triple lead stain for 5 min26 and viewed in an FEI Tecnai Spirit transmission electron microscope at 120 kV. Images were captured with a Gatan Eagle digital camera at a resolution of 2k × 2k pixels.Results and discussion
Liquid crystalline phase formation in a shrinking droplet
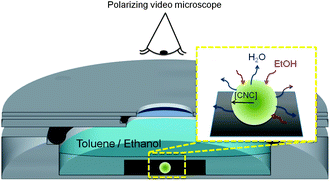
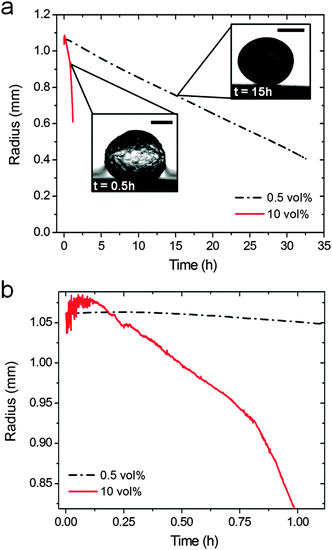
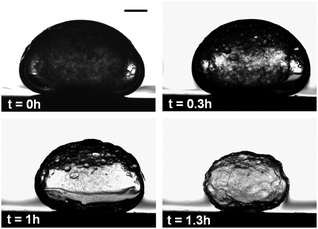
We have followed the evolution of a liquid crystalline phase in the confined space of an isolated, shrinking CNC-containing droplet immersed in a binary toluene–ethanol mixture (Fig. 1). The contact angle of the shrinking droplet residing on the hydrophobized substrate is so high (∼155°) that the spherical shape of the droplet is maintained throughout the drying process (see Fig. S3, ESI†).Fig. 2a demonstrates that the droplet shrinkage rate greatly increases with the ethanol concentration in the surrounding toluene solution. The shrinkage curves show that the droplets initially expand (Fig. 2b), which can be related to an uptake of ethanol into the aqueous CNC dispersion. After the initial expansion, the size of the droplet decreases steadily until the shrinkage is hindered by the assembled CNC rods. The shrinkage of the droplets can be described by a linear decrease of the droplet radius, R, as a function of time (see Fig. 2). Such a shrinkage rate dependency has been observed previously and related with non-ideal mixing of multi-component droplets in partially immiscible liquids.21,27 Additionally, convective effects can be expected from the observed droplet vibration during dissolution. Such motions can effectively disturb the boundary layer around the droplet and as a consequence significantly enhance water diffusion into the surrounding phase.28,29 At high ethanol concentration (10 vol%) a change in the curvature of the shrinkage curve is observed (Fig. 2b). This may be related with self-propelled droplet movement on the hydrophobic substrate28,30 during the first stage of the shrinkage process.
Table 1 tabulates the shrinkage rates for the region where the shrinking droplet radius is between 40 and 80% of the initial radius, corresponding to CNC concentrations between 1 and 13 vol%. The shrinkage rates differ by more than one order of magnitude, which provides the possibility to control the assembly dynamics and consequently the particle packing as will be discussed below.
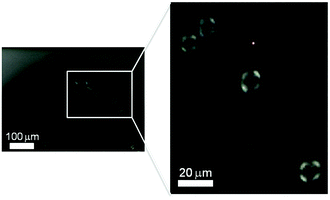
We have followed the formation and evolution of birefringent ordered domains within the shrinking CNC dispersion droplets by polarized video microscopy, illustrated in Fig. 1. It is well established that colloidally stable CNC dispersions undergo an isotropic-to-nematic phase transformation as the CNC concentration increases and birefringent, liquid crystalline domains emerge under cross-polarized light.6,10 The carboxylated CNC system shows a biphasic region from an onset concentration of 0.4 vol% CNC until 0.75 vol% for the fully developed liquid crystalline phase (Fig. S4, ESI†). Fig. 3 shows that as the CNC dispersion droplets shrink and the CNC concentration within the droplet increases, highly mobile spherical liquid crystalline domains, i.e. tactoids6,31 are formed. The absence of black extinction lines in the polarized images of the tactoids suggests that the carboxylated cellulose nanocrystals used in this work do not develop a helical arrangement under the dynamic conditions of this study. In fact, the phase separation and formation of the helical pitch in dispersions of these nanocrystals is time dependent32 and was observed only after several months of equilibrium (Fig. S5, ESI†).
The tactoids first appear close to the interface with the surrounding toluene/ethanol solvent. This observation indicates a radial CNC concentration gradient within the shrinking droplet. Previous work on self-assembling nanoparticles during evaporation-induced assembly has shown that the competition between the diffusion rate and the droplet shrinkage rate can result in significant concentration gradients close to the interface.33 We have estimated the diffusion constant for freely rotating CNC rods and infinite dilution based on the Stoke–Einstein relation to D = 8.1 × 10⁻¹³ m2 s−1, which is comparable to values for CNC previously reported in literature.34 Comparison of diffusion distances estimated from (2Dt)1/233 with the droplet shrinkage rate suggests that diffusion is not able to keep up with the shrinking liquid–liquid interface when the ethanol concentration in the surrounding fluid is 5% or above. These estimates thus corroborate the observations of tactoid formation close to the liquid–liquid interface in Fig. 3. Similar solute concentration gradients were also observed in evaporating colloidal droplets leading in some cases to the so-called skin effect.20,35
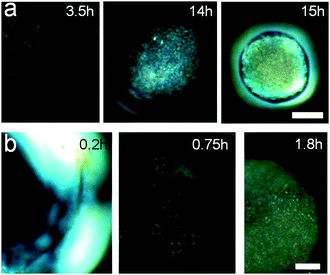
There is a significant difference in the time-dependent evolution of the liquid crystalline phase during droplet shrinkage at 5 and 15% EtOH in the surrounding fluid. Fig. 4a shows that discrete tactoids in CNC dispersion droplets immersed in solutions containing 5% EtOH emerge about 1–2 h after immersion. The tactoids gradually grow in number and then coalesce to finally form an entirely birefringent microbead. In contrast, fast droplet shrinkage at 15% EtOH in the surrounding solution leads to a different consolidation path where large birefringent, halo-like regions instantly emerge at the interface of the droplet (Fig. 4b, 0.2 h). These metastable birefringent regions only exist for a relatively short period of time until they are replaced by large tactoids (Fig. 4b, 0.75 h) that with time merge to form a stable, birefringent shell.
The very high droplet shrinkage rate associated with this high ethanol concentration appears to result in a rapid increase of the CNC concentration at the interface, which induced the formation of a thin liquid crystalline “skin” at the droplet surface. However, the subsequent dissolution of this skin suggests that the convection inside the rapidly shrinking and erratically moving droplet may reduce the local CNC concentration below the phase boundary. After this initial stage the droplet stopped moving about and it appears that the fast droplet shrinkage produces a stable supersaturation of CNC at the interface leading to large tactoids. These highly concentrated CNC clusters can form a rigid shell-like structure, which may resist further droplet shrinkage (Fig. 5). The buckling of the shell may be due to the mechanical instability in response to the shrinkage of the droplet, similar to the buckling of the emulsion droplet shells caused by the rapid droplet contraction.36 It should be noted that the entire droplet shrinkage process is finished after less than 2 h at 15% EtOH while the consolidation process can take as long as 37 h at 0.5% EtOH.
Microstructure of CNC microspheres
We find that the CNC assemblies formed in <5 vol% ethanol have an oblate, ellipsoid-like shape (Fig. 6a) while the assemblies formed at higher ethanol concentrations (>10 vol%) adopt a collapsed, discoidal shape (Fig. 6b). The average diameter of the dry, oblate microbeads is ∼300–800 μm, which corresponds to a final volume about 1–10% of the initial droplet volume. The final microbead size depends on the initially dispensed droplet volume and on the ethanol concentration, generally resulting in smaller microbeads at low shrinkage rates (i.e. low vol% EtOH).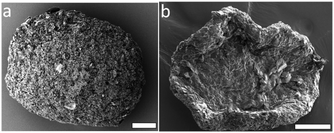 | ||
| Fig. 6 SEM images of dried CNC microbeads formed in toluene solutions containing (a) 0.5 vol% and (b) 10 vol% ethanol. The scale bars are 100 μm. | ||
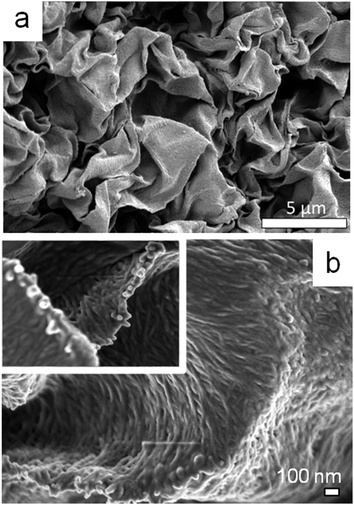
The SEM image in Fig. 7a shows that the surface of the CNC microbeads displays an open, crumpled structure with multiple sheets folded one over another. In fact, the CNC rods appear to be oriented within these sheets adopting an overall nematic order with local helicoidal nanocrystal arrangement (inset Fig. 7b). The nematic texture is observed independently of the droplet shrinkage rate, reflecting thus the tactoid formation during the dissolution process.
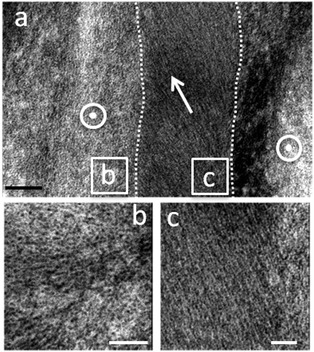
The TEM images of ultramicrotome-sectioned solid spheres show a textured interior with densely packed and aligned CNC rods with intercrystal distances of less than 5 nm (Fig. 8). The CNC rods display nematic ordering within discrete domains of different predominant orientations that hints to a local helical order (Fig. 8b and c). Conversely, we did not observe any pitch lines or reflection colours in the assembled spheres, which is a difference compared to thin CNC films commonly produced from slow evaporation of CNC suspensions.8,10,12 Such films often show iridescent colours originating from the helicoidal arrangement of the nanocrystals and pitch lines during solvent evaporation. A principal reason for this difference may be related with the fast, non-equilibrium assembly of the nanocrystals inside the shrinking droplets. In fact, this CNC dispersion requires several months of equilibrium before a chiral nematic phase separation occurs (Fig. S5, ESI†). This finding underpins the importance of the kinetics on cellulose nanocrystal self-assembly.37
Model for dissolution-driven CNC self-assembly
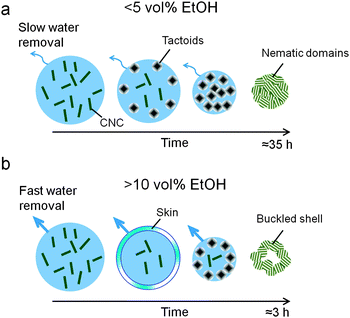
A schematic description summarizing the evolution of the microstructures obtained at low and at high ethanol concentration in the surrounding solvent phase is presented (Fig. 9). At ethanol concentrations below 5 vol%, the droplet shrinkage rate is sufficiently small to ensure a gradual and radial increase of the CNC concentration. This process results in the formation of liquid crystalline tactoids in the interphase region, which subsequently merge together and form an ordered, nematic phase in the entire volume of the droplet (Fig. 9a) In contrast, at high droplet shrinkage rates (Fig. 9b) the droplet immediately forms a thin and flexible birefringent “skin” at the interface (see Fig. 4b, panel 0.2 h) since the droplet dissolves very fast and the CNC concentration close to the surface rapidly jumps above the critical concentration for the isotropic-to-nematic transformation. However, this birefringent surface layer is readily disturbed or even dissolved, as evidenced by the disappearance of the bright zones (see Fig. 4b, panel 0.75 h.) as the droplet continues to shrink. Eventually, a shell surrounding a depleted, empty sphere is produced, which buckles and collapses upon drying. Such mechanical instabilities have previously been attributed to the formation of permeable rigid “skins” during the drying of colloidal sessile droplets,20 or the dissolving of microdroplets of nanosheet suspensions.22Conclusions
We studied the relationship of CNC self-assembly in shrinking droplets with the water dissolution rate of the droplet immersed in a binary toluene–ethanol mixture. The dissolution rate of the CNC droplet strongly depends on the composition of the bulk liquid. Dense spheroid beads were produced at low dissolution rate or collapsed discoidal particles at high water removal rates. This allows for the effective control of the morphology of the resultant colloidal assemblies by adjusting the ratio of the two liquids in the bulk phase. Remarkably, however, is that the nematic microstructure of the assemblies appears to be independent of the dissolution rate, presumably as result of the tactoid formation at early stages of the dissolution process. Self-assembling of CNCs in the confined space of isolated droplets not only provides fundamental insights in the structural evolution of liquid crystalline CNC phases but also offers precise nanostructures that can be advantageous for photonic or nanotechnological applications.Acknowledgements
LB, BW and CS acknowledge the Wallenberg Wood Science Center and the Swedish foundation for strategic research for financial support. XHZ acknowledges the support from the Australian Research Council (FT120100473, DP140100805) and FJ thanks the Ecuadorian Government for a SENESCYT scholarship and the University of Melbourne for the “Summer research experience” program. The authors thank Michael Agthe for the design of the cell used in polarized microscopy imaging. Dr Salajkova is thanked for providing the cellulose and Cris Luengo for the MatLab script used to determine the CNC width distribution. Simon Crawford is acknowledged for his assistance with microtome sectioning and electron microscopy imaging, respectively.References
- I. Siró and D. Plackett, Cellulose, 2010, 17, 459–494 CrossRef.
- R. J. Moon, A. Martini, J. Nairn, J. Simonsen and J. Youngblood, Chem. Soc. Rev., 2011, 40, 3941–3994 RSC.
- B. Wicklein and G. Salazar-Alvarez, J. Mater. Chem. A, 2013, 1, 5469–5478 CAS.
- A. Dufresne, Nanocellulose: From Nature to High Performance Tailored Materials, Walter de Gruyter, 2012 Search PubMed.
- J. F. Revol, L. Godbout, X. M. Dong and D. G. Gray, Liq. Cryst., 1994, 16, 127–134 CrossRef CAS PubMed.
- J. F. Revol, H. Bradford, J. Giasson, R. H. Marchessault and D. G. Gray, Int. J. Biol. Macromol., 1992, 14, 170–172 CrossRef CAS.
- Y. Habibi, L.A. Lucia and O. J. Rojas, Chem. Rev., 2010, 110, 3479–3500 CrossRef CAS PubMed.
- A. G. Dumanli, G. Kamita, J. Landman, H. van der Kooij, B. J. Glover, J. J. Baumberg, U. Steiner and S. Vignolini, Adv. Opt. Mater., 2014, 2, 646–650 CrossRef CAS PubMed.
- J. Kelly, M. Giese, K. E. Shopsowitz, W. Y. Hamad and M. J. MacLachlan, Acc. Chem. Res., 2014, 47, 1088–1096 CrossRef CAS PubMed.
- J. H. Park, J. Noh, C. Schütz, G. Salazar-Alvarez, G. Scalia, L. Bergström and J. P. F. Lagerwall, ChemPhysChem, 2014, 15, 1477–1484 CrossRef CAS PubMed.
- J. P. F. Lagerwall, C. Schütz, M. Salajkova, J. Noh, J. Hyun Park, G. Scalia and L. Bergström, NPG Asia Mater., 2014, 6, e80 CrossRef CAS PubMed.
- X. Mu and D. G. Gray, Langmuir, 2014, 30, 9256–9260 CrossRef CAS PubMed.
- T. Nypelö, C. Rodriguez-Abreu, Y. V Kolen'ko, J. Rivas and O. J. Rojas, ACS Appl. Mater. Interfaces, 2014, 6, 16851–16858 Search PubMed.
- F. Li, D. P. Josephson and A. Stein, Angew. Chem., Int. Ed., 2011, 50, 360–388 CrossRef CAS PubMed.
- K. E. Shopsowitz, H. Qi, W. Y. Hamad and M. J. MacLachlan, Nature, 2010, 468, 422–425 CrossRef CAS PubMed.
- S.-Y. Zhang, M. D. Regulacio and M.-Y. Han, Chem. Soc. Rev., 2014, 43, 2301–2323 RSC.
- V. R. Dugyala, S. V. Daware and M. G. Basavaraj, Soft Matter, 2013, 9, 6711–6725 RSC.
- A. G. Marín, H. Gelderblom, A. Susarrey-Arce, A. van Houselt, L. Lefferts, J. G. E. Gardeniers, D. Lohse and J. H. Snoeijer, Proc. Natl. Acad. Sci. U. S. A., 2012, 109, 16455–16458 CrossRef PubMed.
- K. Uetani and H. Yano, Soft Matter, 2013, 9, 3396 RSC.
- L. Pauchard and C. Allain, C. R. Phys., 2003, 4, 231–239 CrossRef CAS.
- H. Yang, Y. Wang, Y. Song, L. Qiu, S. Zhang, D. Li and X. Zhang, Soft Matter, 2012, 8, 11249–11254 RSC.
- Y. Song, H. Yang, Y. Wang, S. Chen, D. Li, S. Zhang and X. Zhang, Nanoscale, 2013, 5, 6458–6463 RSC.
- M. Salajková, L. A. Berglund and Q. Zhou, J. Mater. Chem., 2012, 22, 19798–19805 RSC.
- M. Müller, C. Czihak, H. Schober, Y. Nishiyama and G. Vogl, Macromolecules, 2000, 33, 1834–1840 CrossRef.
- X. Zhang, N. Maeda and V. Craig, Langmuir, 2006, 22, 5025–5035 CrossRef CAS PubMed.
- T. Sato, J. Electron Microsc., 1968, 17, 158–159 CAS.
- T. Ban, T. Yamada, A. Aoyama, Y. Takagi and Y. Okano, Soft Matter, 2012, 8, 3908–3916 RSC.
- P. Poesio, G. Beretta and T. Thorsen, Phys. Rev. Lett., 2009, 103, 064501 CrossRef.
- P. Zhu, T. Harris and M. Driver, J. Phys. Chem. C, 2009, 113, 16458–16463 CAS.
- T. Ban, A. Aoyama and T. Matsumoto, Chem. Lett., 2010, 39, 1294–1296 CrossRef CAS.
- Y. Bouligand, F. Livolant, F. L. The and J. De Physique, J. Phys., 1984, 45, 1899–1923 CAS.
- C. F. Castro-Guerrero and D. G. Gray, Cellulose, 2014, 21, 2567–2577 CrossRef CAS PubMed.
- T. P. Bigioni, X.-M. Lin, T. T. Nguyen, E. I. Corwin, T. A. Witten and H. M. Jaeger, Nat. Mater., 2006, 5, 265–270 CrossRef CAS PubMed.
- J. H. Sim, S. Dong, K. Röemhild, A. Kaya, D. Sohn, K. Tanaka, M. Roman, T. Heinze and A. R. Esker, J. Colloid Interface Sci., 2015, 440, 119–125 CrossRef CAS PubMed.
- R. Duggal, F. Hussain and M. Pasquali, Adv. Mater., 2006, 18, 29–34 CrossRef CAS PubMed.
- S. Sacanna, W. T. M. Irvine, P. M. Chaikin and D. J. Pine, Nature, 2010, 464, 575–578 CrossRef CAS PubMed.
- C. Schütz, M. Agthe, A. B. Fall, K. Gordeyeva, V. Guccini, M. Salajkova, T. S. Plivelic, J. P. F. Lagerwall, G. Salazar-Alvarez and L. Bergström, Langmuir, 2015 DOI:10.1021/acs.langmuir.5b00924.
Footnotes |
| † Electronic supplementary information (ESI) available. See DOI: 10.1039/c5sm00886g |
| ‡ Present address: Materials Science Institute of Madrid-CSIC, Spain. |
| This journal is © The Royal Society of Chemistry 2015 |

