DOI:
10.1039/C5SM00793C
(Paper)
Soft Matter, 2015,
11, 5641-5646
Tubular growth and bead formation in the lyotropic lamellar phase of a lipid
Received
2nd April 2015
, Accepted 24th May 2015
First published on 26th May 2015
Abstract
We use fluorescence confocal polarised microscopy (FCPM) to study tubular growth upon hydration of dry DOPC (1,2-dioleoyl-sn-glycero-3-phosphocholine) in water and water–glycerol mixtures. We have developed a model to relate the FCPM intensity profiles to the multilamellar structures of the tubules. Insertion of an additional patch inside a tubule produces a beaded structure, while a straight configuration is retained if the growth is on the outside. We use a simple model to suggest that reduction in overall curvature energy drives bead formation.
1 Introduction
Virchow reported the observations of tubular structures that form upon adding water to the lipid extracts obtained from various organs, back in 1854. He named these structures “myelins”.1 In 1966, Chapman and Fluck observed similar structures when the synthetic phospholipid dipalmitoyl phosphatidylcholine (DPPC) is hydrated above the chain melting transition temperature,2,3 indicating that a necessary condition for myelin figures (MFs) during or upon hydration is the non-crystalline, fluid phase of the amphiphilic lipids. Subsequent observations under a scanning electron microscope equipped with a cryo-stage revealed that these tubules are multi-lamellar, with a central core filled with the solvent.4 In the more recent contact experiments reported by Zou and Nagel,5 myelins were produced by hydrating previously humidified, fully swollen surfactant plaques. In another experiment, they showed that puncturing the fully swollen lamellar stacks in excess water leads to tubular growth from the punctured site. They reconcile these observations by suggesting that myelin figures are non-equilibrium structures formed only in the presence of a net driving force, such as that provided by a hydration differential. Zou has proposed a microscopic theory in which myelin growth is attributed to surfactant flow at the surfactant/water interface6 in the presence of hydration stress. Following the reverse dehydration experiment, Huang et al.7 have proposed a slightly different model for myelin (hereafter called tubule) formation from a multilamellar disk upon evaporation of the solvent. In this model, reduced bilayer repeat spacing (due to dehydration) increases the bilayer repulsion. If flat bilayers transform into cylinders, bilayer repeat spacing increases, keeping the total area and the lamellar volume constant. Assuming the core radius of tubules to be half the layer spacing, they find that the decrease in inter-bilayer repulsion through the topological lamellar-to-tubular transition more than compensates for additional curvature energy of the incipient tubules.
Herein we describe the experiments in which a nominally dry pool of a fluid-phase lipid DOPC reservoir undergoes swelling by capillary action. We find that an abrupt “burst” event characterised by rapid appearance of microscopic initial tubules locally triggers the formation of long-lived additional new multilamellar tubules. In these post-burst, long-lived tubules an unusual complex topography appears reproducibly. Specifically, we observe localised bulging of some tubules (bead formation) in which additional lamellar inclusions are found within the tubule interior. We also observe tubules with exterior lamellar attachments, which do not lead to the formation of beads. We propose a simple phenomenological model for the structure and stability of bead-encapsulating myelin tubules. This paper is organised as follows: the description of experimental methods is followed by a summary of observations. The modelling and analysis essential for extracting structural information from FCPM images are discussed in the next two sections. This is followed by the description of structural details of observed, representative morphologies. The phenomenological model for the structure and stability of beads is discussed in the last section.
Structurally analogous multilamellar tubules, also known as MFs, are also seen in biological systems; a prominent example being myelin figures in pulmonary lining,8 an extra-cellular lipid–protein coat at the lung alveolar surface. The composition and the conditions under which MFs are found in biological systems differ from those of multilamellar tubules discussed in this paper. However, the structural aspects as well as physical processes (such as the mechanism of bead formation) discussed here may be of relevance in biological contexts. Membrane tubules are also being explored for applications such as templates for nanofluidic conduits and networks,9 and as deformable containers for the study of biochemical reactions in nanoscale confinement.10 Controlled introduction of beaded protrusions in multilamellar tubules may have practical use in such applications.
2 Experimental methods
We prepare stock solutions of the lipid DOPC (purchased from Sigma) and the membrane dye, lissamine rhodamine B 1,2-dihexadecanoyl-sn-glycero-3-phosphoethanolamine, triethylammonium salt (rhodamine DHPE, purchased from Molecular Probes) in chloroform. Dye solution is added to lipid stock (2 mg ml−1) such that dye concentration is about 0.002 mole per mole of lipid. In the lamellar phase, dye molecules are known to be incorporated in lipid bilayers.11 Sample cells are prepared, which consist of a glass coverslip onto which about 20–50 μl of lipid solution is pipetted at the center (using a Hamilton syringe). Sample-cells are gently dried under a nitrogen stream and kept covered inside a desiccator overnight. For some experiments, coverslips were spin-coated at 4000 rpm with the same lipid sample. A coated coverslip with the dried sample was glued to a larger cover-slip at the edges using mica spacers of about 100 μm thickness. Solvent was introduced between coverslips of sample cells by capillary action. For some experiments the open edges were sealed using silicone glue, immediately after the solvent filled the whole gap (sealed sample cells). We have used the following solvents: water (refractive index (RI) 1.33), water–glycerol 80–20 v/v (RI 1.357) and water–glycerol 10–90 v/v (RI 1.469). The ordinary RI no of neat DOPC12 is about 1.46. We calculate the ordinary RI (noL) in the lamellar phase (solvent of RI ns) using noL = noϕl + nsϕs where ϕl and ϕs are respectively the volume fractions of DOPC and solvent.12 The birefringence in the lamellar phase of DOPC (20 wt%) in a glycerol–water (91![[thin space (1/6-em)]](https://www.rsc.org/images/entities/char_2009.gif) :9 w/w%) mixture (295 K, 589 nm wavelength)13 is about 0.026. Sample cells are observed under an epi-fluorescence microscope (Zeiss) and an FCPM (LEICA TCS-SP2, He–Ne laser (543 nm) source) equipped with a 40× dry objective (0.85 N.A.) having a correction collar. We take multiple confocal z-slices of each tubule, from bottom to top of each tubule and select the xy-scan corresponding to the largest horizontal (z = 0) cross-section, and average over the repeated scans of this cross-section, for analysis. The epi-fluorescence microscope is equipped with an EMCCD-camera (Cascade 650, Photonics) and a mercury-lamp.
:9 w/w%) mixture (295 K, 589 nm wavelength)13 is about 0.026. Sample cells are observed under an epi-fluorescence microscope (Zeiss) and an FCPM (LEICA TCS-SP2, He–Ne laser (543 nm) source) equipped with a 40× dry objective (0.85 N.A.) having a correction collar. We take multiple confocal z-slices of each tubule, from bottom to top of each tubule and select the xy-scan corresponding to the largest horizontal (z = 0) cross-section, and average over the repeated scans of this cross-section, for analysis. The epi-fluorescence microscope is equipped with an EMCCD-camera (Cascade 650, Photonics) and a mercury-lamp.
3 Summary of observations
In unsealed syringe-coated sample cells, dried lipid on the substrate swells upon adding water, resulting in the nucleation of multilamellar structures (Fig. 1a) as can be seen coming out from the lipid-reservoir. After about 20–40 minutes of swelling, a sudden and dramatic instability event (burst) is observed where the pre-existing lipid structures are co-operatively pushed away from the lipid-reservoir into the solvent leaving behind tethers (thin lipid tubes) as connections to the lipid reservoir (Fig. 1b). The thin tubes retract slowly into the reservoir. From the same region (where the burst has occurred), the nucleation and growth of tubules of diameter in the range of a few μm (Fig. 1c) are observed. We have also observed fast-retraction and bulging of tubules, growth of branched tubular structures, etc. The growth and retraction rates of these new tubules are found to be linear and vary from 1 to 40 μm s−1. Tubules retract as the solvent starts to evaporate. Upon adding water again, swelling and growth of tubules are observed, but we do not observe the burst event. We slow down the growth of tubules by using a glycerol–water mixture as solvent. In this case we do not observe the burst, although tubules grow and remain stable until the solvent starts to evaporate, in about half a day.
 |
| | Fig. 1 Epi-fluorescence images: (a) before burst. (b) The burst, about 22 minutes after adding water. (c) About 20 minutes post-burst. Scale bar 20 μm. | |
We found that in the sealed sample cells, the tubules remain stable for a couple of days and thereafter undergo a series of morphological transitions. A uniform cylindrical shaped single core tubule after 2 days becomes a complex multi-lamellar tube with multiply connected cores and later dissolves completely into the solvent.
FCPM images show that tubules originate from defects which appear to be holes or edges in the lipid reservoir (Fig. 2a and b). This is further supported by the observation that tubules do not grow upon adding water in unsealed spin-coated samples. The “puncturing experiment” reported previously5 is also in agreement with our observations. Epi-fluorescence observations clearly show that tubules with uniform cross-section often acquire additional layers as inclusions in the core and develop a bulge (bead) (Fig. 2c). Typically, beads appear near the reservoir and move away as tubules grow. Confocal scans at the largest cross-section of two beads shown in Fig. 3(a) and 4(a) clearly reveal the inclusion of additional lamellar patches within the tubule interior. Tubules with additional lamellar patches attached to the exterior (Fig. 5(a)) do not form beads.
 |
| | Fig. 2 (a) FCPM image (30 μm × 38 μm) of a tubule growing from the reservoir. (b) The same region at a lower value of z, showing defects at the tubule base. (c) Epi-fluorescence image of a bulged portion or “bead” on a tubule, showing multilamellar morphology, with additional layers inside the main tubule, scale bar 20 μm. | |
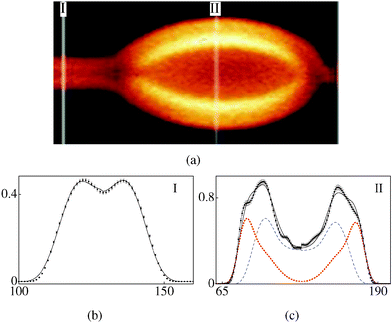 |
| | Fig. 3 (a) FCPM image of a bead on a tubule (polarisation along the tubule axis), 80–20 v/v water–glycerol solvent. (b, c) Intensity profiles (arbitrary units, plotted against pixel number). (b) Cross-section I: experimental (with error bars), model (smooth curve) (rc,ro) = (0.4,0.8) μm, α = 0.46. (c) Cross-section II: bead composed of two tubules, experimental (with error bars), model (black curve), constituent tubules (dotted and dashed curves), ((rc1,ro1), (rc2,ro2)) = ((1.2,2.1), (2.1,2.4)) μm, α = 0.6. | |
 |
| | Fig. 4 (a) FCPM image of a beaded tubule with a much larger diameter as compared to the one shown in (a). 10–90 v/v water–glycerol solvent. (b) Cross-section I: (rc,ro) = (2.1,3.1) μm, α = 0.2. (c) Cross-section II: ((rc1,ro1), (rc2,ro2)) = ((2.8,3.6), (3.8,5.0)) μm, α = 0.26, we follow the convention used in Fig. 3(b) and (c) to represent experimental and model curves. | |
 |
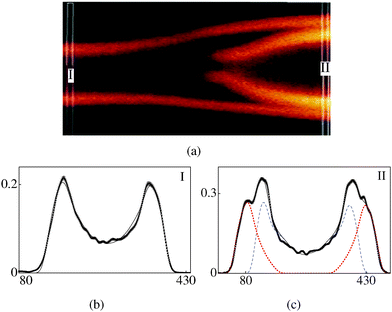
| | Fig. 5 (a) FCPM image of a tubule with additional exterior patches burrowing into it, 10–90 v/v water–glycerol solvent. (b) ((rc1,ro1), (rc2,ro2)) = ((1.5,1.6), (1.8,2.4)) μm, α = 0.43, (c) ((rc1,ro1),(rc2,ro2), (rc3,ro3)) = ((1.5,1.8), (1.8,2.5), (3.4,3.5)) μm, (d) ((rc1,ro1), (rc2,ro2), (rc3,ro3), (rc4,ro4)) = ((1.5,1.6), (1.6,2.2), (2.7,3.0), (3.2,3.4)) μm, α = 0.43. In (b)–(d), α = 0.42. | |
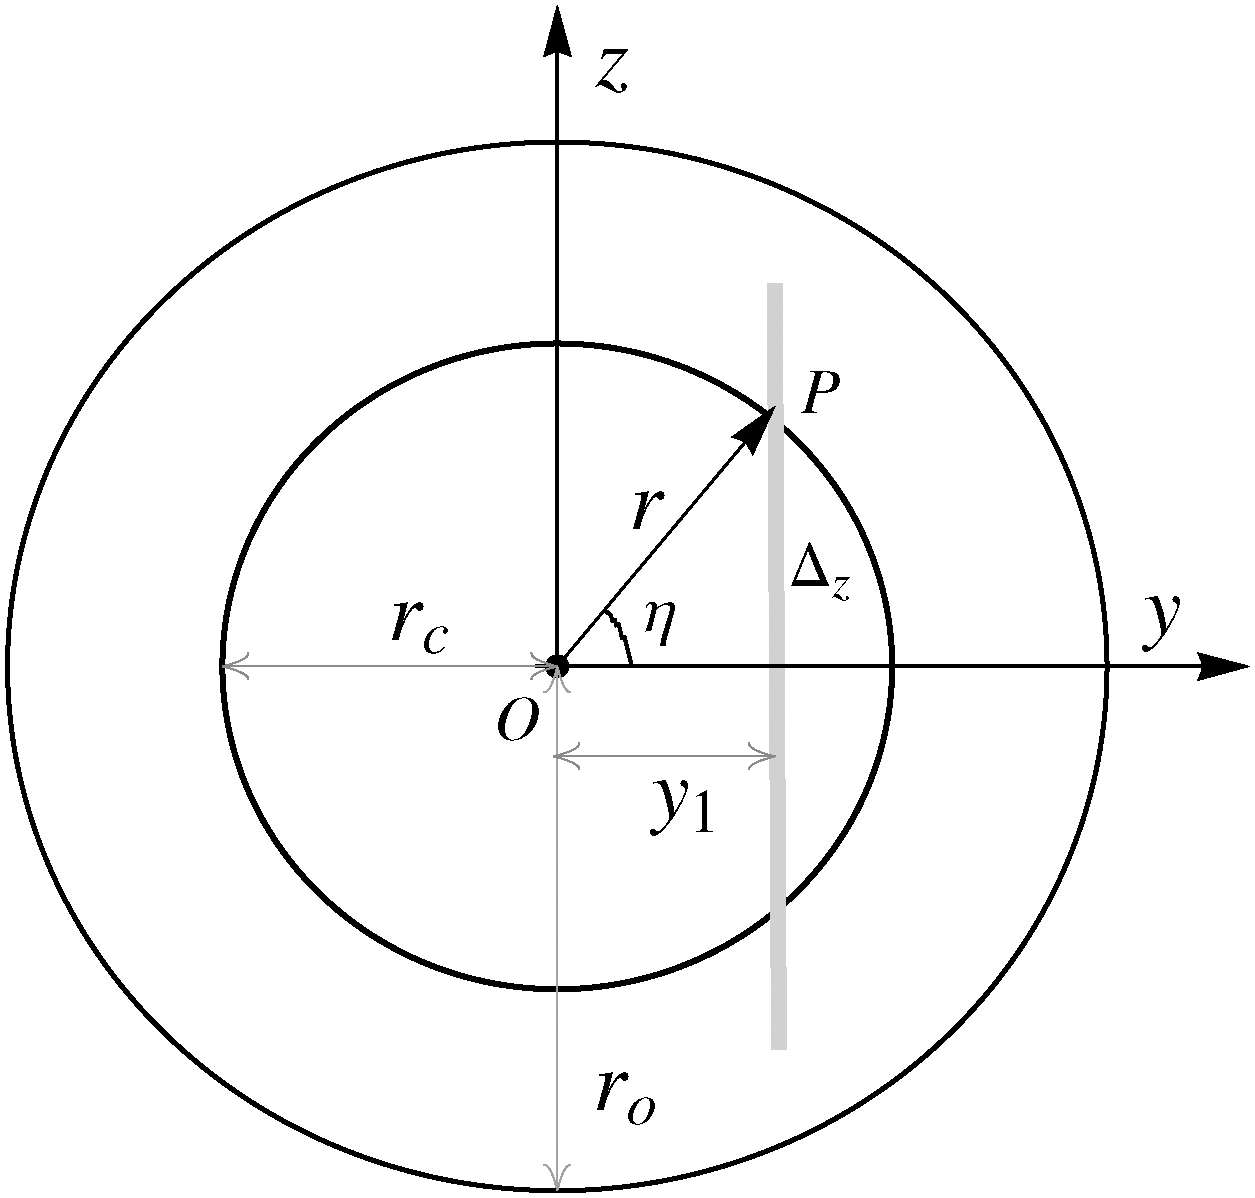
4 Modelling tubules for FCPM
We model tubules as cylindrically symmetric structures with fixed lamellar spacing. Dye molecules orient with their long axes along ![[r with combining circumflex]](https://www.rsc.org/images/entities/i_char_0072_0302.gif) ; of the cylindrical polar coordinate system (r,η,x), with polar angle η defined in the yz-plane (Fig. 6). The absorption transition dipole moment of dye molecules
; of the cylindrical polar coordinate system (r,η,x), with polar angle η defined in the yz-plane (Fig. 6). The absorption transition dipole moment of dye molecules ![[d with combining circumflex]](https://www.rsc.org/images/entities/i_char_0064_0302.gif) a lies in the bilayer plane,11 orthogonal to . Excited dye molecules emit fluorescence radiation isotropically. The detected fluorescence intensity ID(x,y = y1) has contributions from all the differently oriented dye molecules within the confocal slice thickness Δz at y = y1. The image is formed by rays entering the objective after taking distinct paths within the sample cell. We therefore need to (i) average over all possible orientations of the dye molecules, and (ii) trace the path of rays entering the objective, for all points (such as P (Fig. 6)) within the confocal slice. The electric field Êi of the incident linearly polarised laser beam makes an angle ψ with the x-axis. The probability of photon absorption (and therefore, emission) by a dye molecule at the point P(r,η,x = 0) is Pa(η,ψ) ∝ I0〈(a·Êi)2〉 ∝ I0F(η,ψ), where I0 is the intensity of the incident laser beam, angular brackets denote average over all possible orientations of a in the bilayer plane, and F(η,ψ) = (9 − 3cos2η + 6cos2ηcos2ψ)/24.
a lies in the bilayer plane,11 orthogonal to . Excited dye molecules emit fluorescence radiation isotropically. The detected fluorescence intensity ID(x,y = y1) has contributions from all the differently oriented dye molecules within the confocal slice thickness Δz at y = y1. The image is formed by rays entering the objective after taking distinct paths within the sample cell. We therefore need to (i) average over all possible orientations of the dye molecules, and (ii) trace the path of rays entering the objective, for all points (such as P (Fig. 6)) within the confocal slice. The electric field Êi of the incident linearly polarised laser beam makes an angle ψ with the x-axis. The probability of photon absorption (and therefore, emission) by a dye molecule at the point P(r,η,x = 0) is Pa(η,ψ) ∝ I0〈(a·Êi)2〉 ∝ I0F(η,ψ), where I0 is the intensity of the incident laser beam, angular brackets denote average over all possible orientations of a in the bilayer plane, and F(η,ψ) = (9 − 3cos2η + 6cos2ηcos2ψ)/24.
 |
| | Fig. 6 Transverse cross-section of a uniform cylindrical tubule, core and outer radii rc and ro respectively. Δz (shown in grey) is the confocal slice thickness. | |
We trace the rays by taking into account the refractive indices of the coverslip, solvent and the lamellar structure; the contributions from the total internal reflection at the lamella–solvent interfaces, and the numerical aperture of the objective are also included in the calculation. We evaluate Pa(η,ψ) numerically, and have written a computer code for ray-tracing to obtain the model intensity profile IM(x,y;rc,ro,Δz), with inner radius rc, outer radius ro, and Δz as fitting parameters (see the next section). Note that the objective used has a correction collar, the images analysed are obtained at the widest part of the tubule, and the slice thickness Δz is used as a fitting parameter, thus obviating the need for corrections due to coverslip thickness and spherical aberration.
5 Image processing and fitting
We oversample ID(x,y) at an adequately high spatial frequency, and enhance the signal-to-noise ratio (SNR) by processing it through a suitable low-pass filter to obtain the smoothened profile Ism(x,y). In the Fourier domain the width of the low-pass filter is given by mq = (N × pixelwidth)/R, where R is the spatial scale in the image domain over which we want to reduce the noise, and N is the size of the image in pixels. We vary R up to the point spread function-width, and find the corresponding SNR for Ism(x,y). The SNR has a maximum at the “smoothening radius”, ropt. In order to ensure that spatial variations on the scale of interest are not significantly affected, we use a filter with the conservative smoothening radius14rs = ropt/2.
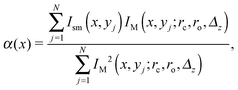
Recall that we analyse confocal images having the widest horizontal cross-section (see Section 2) of the lipid structures. For beads, ID(x,y) shows a noticeable deviation from cylindrical symmetry (Fig. 3c and 4c). We locate the centre of a given cross-section by maximising the intensity cross-correlation function. We model the two halves (divided by the xz-plane) separately to estimate the fitting parameters (rc,ro,Δz), use these as seed values, and fit IM(x,y;rc,ro,Δz) for each half to Ism(x,y) by using an appropriate intensity scaling factor
| |  | (1) |
where
yj denotes the pixel number along the
y-axis.
α(
x) denotes a common intensity scaling factor for the overall model intensity profile of the tubule (or bead). In
eqn (1), a higher value of
α required for the fit of
Ism with
IM reflects a lower number density of the dye molecules present in the tubule, and
vice versa. Previous studies have reported that the dye is homogeneously distributed in the fluid phase of a membrane and does not aggregate at such a low concentration.
11 However, we have found that a slightly lower value of
α is required for the straight part of the tube compared to the bend part of the same tube (
Fig. 3c and 4c), as discussed in the section below.
For a given cross-section at x, the best fits are obtained by minimising the weighted χ2(α,rc,ro,Δz) given by15
| |  | (2) |
where
σj is the standard deviation of the noise associated with the
jth pixel along the
y-axis for a given
x, and
k labels separate concentric tubules in a given cross-section.
6 Structure of tubules and beads
Fig. 3a (water–glycerol 80–20 v/v solvent) shows a tubule with a bead. The part of the tube with uniform cross-section labelled I (referred to as (3-I)) consists of a single tubule (k = 1) (Fig. 3b) and is reasonably symmetric in the two halves. The scaling parameter is α = 0.46. Cross-section labelled II (3-II) corresponds to the widest part of the bead. As can be seen in Fig. 3a, this part has an additional patch; indeed the best fit for (3-II) requires two values of k, i.e., two separate tubules (Fig. 3c). Note that α for (3-II) is 1.3 times that for (3-I). A higher value of α for (3-II) reflects a lower number density of the dye molecules, as compared to that for (3-I). For the bead shown in Fig. 4a (water–glycerol 10–90 v/v solvent), the parameter α is again found to be larger for the bulged part (Fig. 4(b) and (c)), compared to that for the straight part. Fig. 5a (water–glycerol 10–90 v/v solvent) shows a tubule having additional lamellae wrapped outside the main tubule. Analysis of (5-I) shows that it consists of 2 tubules (Fig. 5b). Cross-section (5-II) consists of 3 tubules (Fig. 5c); a solvent gap exists between the main tubule and the outer tubule. Analysis of (5-III) shows that it comprises 4 tubules (Fig. 5d). The α values are similar in all sections analysed. Thus, a higher value of α is found for the bent-part (Fig. 3c and 4c) compared to the straight-part.
7 Phenomenological model for beads
The syringe-coated sample cells are likely to have a non-uniform spreading of lipid compared to the spin-coated samples, which upon drying will contain numerous holes and edges in the lamellar stack. Upon swelling (Fig. 2a and b), it could be that some of the lamellar patches which do not extend over the entire area of the sample form edge dislocation loops. Such a patch, lying on top of the outermost bilayer of a growing tubule is likely to attach itself to the exterior of the tubule (Fig. 5a). A patch below the layers forming the wall of the growing tubule, and located sufficiently close to its root could get entrained into the solvent core because of fluid flow (Fig. 7a). The curvature energy of the entrapped lamellar structure (which could be a vesicle or a scrolled structure) can get reduced if it expands in diameter, in turn pushing the wall of the tubule radially outward and producing a bulge (Fig. 7b). This broad picture is consistent with the observation that beads have additional layers inside the bulged region (Fig. 2c, 3a, and 4a) and bulging is not observed if additional lamella are outside the main tubule (Fig. 5a).
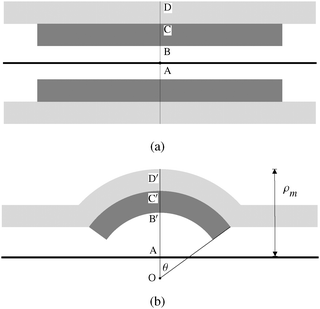 |
| | Fig. 7 (a) Schematics of axial cross-section of a tubule with the dark region representing vesicle or a stitched scroll that fits snugly into the outer tubule. Outer radius AD = roo, intermediate radius AC = rio and core radius AB = rii. Core radius rio of the outer tubule is set equal to the outer radius of the inserted vesicle or scroll. (b) Upper half of the bent tubule (bead). OD′ = Roo, OC′ = Rio and OB′ = Rii denote radii with common centre O. The structure of course still has a cylindrical symmetry about the axis of the tubule, represented by a thick dark line. OA = a is the axial offset, and ρm = AD′. | |
A full calculation of the equilibrium shape of the bead requires minimisation of the total energy, which includes curvature and dilation energies at the neck regions, apart from membrane tension. We do not address this complex problem, but investigate the feasibility of the mechanism outlined above by developing a highly simplified model described below. We model inserted lamellar patch as a cylindrically symmetric structure with fixed lamellar spacing (which could be a scroll with open ends merging into nearby layers, or a closed vesicle). We assume that the layer spacing is fixed at the equilibrium value, as in many other problems involving smectic liquid crystals.16 This dictates that the inner and outer tubules bend with a circular cross-section in the plane containing the tubular axis, about a common centre O, which is shifted away from the tubular axis (Fig. 7b). We ignore the excess energy of the conical edge of the outer tubule (the region near the neck of the bulge) for simplicity. In what follows, we use the conventional cylindrical co-ordinate system (ρ,ϕ,z) with its origin at A, and the z-axis along the tubule axis (Fig. 7), rather than the one used in Fig. 6.
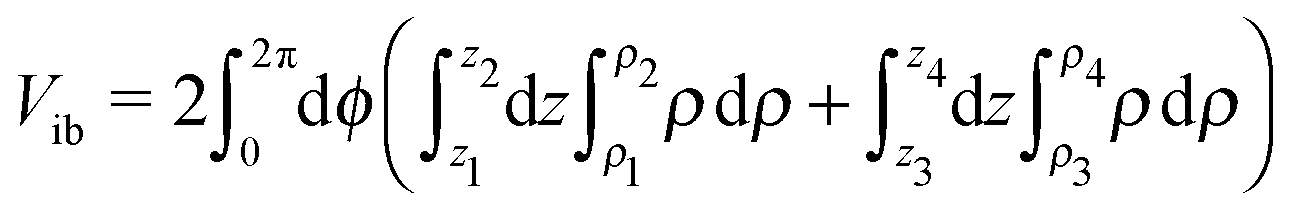
We now calculate the energies of the two configurations of Fig. 7. The total bend angle is 2θ. The volume of the inner cylinder before bending is Vic = π(rio2 −rii2)Li. After bending (Fig. 7b), the volume of the bent inner patch is given by  , where the limits of integration are z1 = 0, z2 = Risinθ, ρ1 = (Ri2 − z2)1/2 − a, ρ2 = (Ro2 − z2)1/2 − a, and z3 = Risinθ, z4 = Rosinθ, ρ3 = zcotθ − a, ρ4 = (Ro2 − z2)1/2 − a. This simplifies to Vib = 2π[(2/3)(Rio3 − Rii3)sinθ − (Riocosθ − rio)(Rio2 − Rii2)θ]. Since (Rio − Rii) = (rio − rii), for any given Rii the angle θ is fixed to ensure that Vib = Vic. As θ is the same for the bent outer tube, the corresponding volume Vob is obtained by replacing Rio and Rii by Roo and Rio, respectively, in the above expression. The equivalent volume before bending is Voc = π(roo2 − roi2)Lo, where Lo is the length needed to ensure Voc = Vob. The bent part of the outer tubule can draw lipid material from the long extended-part of the tubule, and usually Lo > Li. The curvature elastic energy Ec is calculated by integrating the energy density (K1/2)(∇·n)2, (where n is the director) over the relevant volume.16 For the straight configuration
| | | Ec = πK1[Liln(rio/rii) + Loln(roo/rio)]. | (3) |
Since the curvature energy
Eb in the bent configuration does not reduce to a simple expression, we evaluate it numerically. The surface area of the cylinder with total volume (
Voc +
Vic) exposed to the surrounding liquid changes after bending, even though the volume is conserved. The total exposed area of the straight configuration is
| | | Ac = 2π[riiLi + (rio2 − rii2) + rooLo + rio(Lo − Li)]. | (4) |
The corresponding energy is
σAc, and
σ is used for the two ends of the inner cylinder also. After bending, a calculation similar to the one for
Vib (see above) for the exposed area leads to
| | | Ab = 4π[(Rii2 + Roo2)sinθ − aθ(Rii + Roo) + (Rio − Rii)((1/2)(Rii + Rio)cosθ − a)], | (5) |
where
a = OA = (
Riocos
θ −
rio) (
Fig. 7b).
We can now calculate the total energy (Eb + σAb) and compare it with the corresponding value (Ec + σAc) of equivalent volumes of both the inner and outer cylinders. We have used layer spacing d ≃ 6 nm, bending rigidity17K1 ≃ 10 pN, membrane tension18σ ≃ 5 × 10⁻⁷ N m−1 (i.e., the length scale K1/σ ≃ 20 μm). The structure bulges only if the total energy is reduced and the difference ΔE(bead − cylinder) is negative. We vary the initially assumed Rii to find the absolute minimum of energy, corresponding to the equilibrium structure. Illustrative energy curves are shown in Fig. 8 as a function of (Roo − a) (>roo), which is the physically measured maximum radius of the bead. It is clear that in the absence of the inner tubule, the outer tubule remains straight, whereas inclusion of the inner tubule leads to bead formation, mainly to lower the curvature energy. For tubules with two beads, calculations show that the energy is lowered by their merger. Such bead coalescence is actually observed in experiments (Fig. 9), and corroborates the proposed mechanism based upon curvature elasticity. When additional material wraps on the outer surface of an existing tubule (as in Fig. 5), there is obviously no gain in energy by bulging of the tubule, which remains straight.
 |
| | Fig. 8 Change in energy (ΔE/σ)(×10−11 m2) as a function of ρm = (Roo − a) (μm), (a) straight configuration of Fig. 7a. (b) Beaded structure of Fig. 7b. (ΔE/σ) < 0 and is minimum at ρm ≃ 4 μm. roo = 3.15 μm, rio = 2.3 μm, rii = 0.1 μm, Li = 9 μm, κ/σ = 20 μm. Lo = 9 μm for (a). | |
 |
| | Fig. 9 Approach and coalescence of beads, scale bar 20 μm. Until coalescence, the inter-bead separation fits d (μm) = 6.6 − 0.6t (s). | |
8 Conclusions
We have described the formation of complex, nested topologies of a common well-hydrated phospholipid in the Lα phase. Specifically, we find that introduction of water to a dry mass of lipid by capillary action gives rise to an abrupt burst event characterised by rapid appearance of tubules, which trigger the formation of long-lived additional new multilamellar tubules. In these post-burst, long-lived tubules an unusual complex topography appears reproducibly. Specifically, we observe localised bulging of some tubules (bead formation) in which additional lamellar inclusions are found within the tubule interior. We also observe tubules with exterior lamellar attachments. We have used FCPM to analyse the structure of tubules observed. We have suggested a mechanism for addition of lamellar material inside the tubules, and argue that the overall energy can be lowered by bead formation when a sufficiently large lamellar patch gets inserted in the solvent core of the tubular structure. These protrusions, which grow from the lipid–water interface, are remarkable structures, tens of micrometers wide. Because myelins grow as a consequence of kinetics of hydration, it appears reasonable that differences in methods of hydration may also stabilise complex tertiary self-assemblies leading to unusual, nested topologies.
Acknowledgements
TB acknowledges Ph.D. thesis research fellowship from the Raman Research Institute (RRI), Bangalore, India. We acknowledge Prof. A. A. Deshpande (RRI) for his help in image processing. TB acknowledges Prof. John H. Ipsen (SDU, Denmark) and Prof. Atul N. Parikh (UC, Davis) for very helpful discussions and Prof. R. Pratibha (RRI) for gifting mica spacers.
References
- R. Virchow, Virchows Arch., 1854, 6, 562 CrossRef.
- D. Chapman and D. J. Fluck, J. Cell Biol., 1966, 30, 1 CrossRef CAS.
- H. Sandermann, H. Falk and G. Schumacher, Anal. Biochem., 1977, 82, 583–585 CrossRef CAS.
- I. Sakurai, T. Suzuki and S. Sakurai, Biochim. Biophys. Acta, 1989, 985, 101 CrossRef.
- L. N. Zou and S. R. Nagel, Phys. Rev. Lett., 2006, 96, 138301 CrossRef.
- L. N. Zou, Phys. Rev. E: Stat. Phys., Plasmas, Fluids, Relat. Interdiscip. Top., 2009, 79, 061502 CrossRef.
- J. R. Huang, L. N. Zou and T. A. Witten, Eur. Phys. J. E: Soft Matter Biol. Phys., 2005, 18, 279 CrossRef CAS PubMed.
- L. M. G. Vangolde, J. J. Batenburg and B. Robertson, Physiol. Rev., 1988, 68, 374–455 CAS.
- E. Evans, H. Bowman, A. Leung, D. Needham and D. Tirrell, Science, 1996, 273, 933–935 CAS.
- A. Karlsson, R. Karlsson, M. Karlsson, A. S. Cans, A. Stromberg, F. Ryttsen and O. Orwar, Nature, 2001, 409, 150–152 CrossRef CAS PubMed.
- L. A. Bagatolli and E. Gratton, Biophys. J., 2000, 78, 290 CrossRef CAS.
- R. Gomati, M. Gharbia and A. Gharbi, Opt. Commun., 1994, 111, 71 CrossRef CAS.
- L. B. A. Johansson, Biochim. Biophys. Acta, 1993, 1149, 285 CrossRef CAS.
-
T. Bhatia, to be submitted.
-
P. R. Bevington and D. K. Robinson, Data Reduction and Error Analysis for the Physical Sciences, McGraw-Hill, Boston, 2002 Search PubMed.
-
P. G. de Gennes and J. Prost, The Physics of Liquid Crystals, Oxford University Press, Oxford, 1994 Search PubMed.
- J. Pan, S. Trisham-Nagle and J. F. Nagle, Biophys. J., 2008, 94, 117–124 CrossRef CAS PubMed.
- J. R. Henriksen and J. H. Ipsen, Eur. Phys. J. E: Soft Matter Biol. Phys., 2004, 149, 149–167 CrossRef PubMed.
Footnote |
| † Present address: Department of Physics, Chemistry and Pharmacy, University of Southern Denmark (SDU), Odense, Denmark. E-mail: E-mail: bhatia@sdu.dk. |
|
| This journal is © The Royal Society of Chemistry 2015 |
Click here to see how this site uses Cookies. View our privacy policy here. 
 Open Access Article
 This Open Access Article is licensed under a


 , where the limits of integration are z1 = 0, z2 = Ri
