
 Open Access Article
 This Open Access Article is licensed under a
 Creative Commons Attribution 3.0 Unported Licence
Nano-beam X-ray microscopy of dried colloidal films†
Martin A.
Schroer
*ab,
Christian
Gutt‡
a,
Felix
Lehmkühler
ab,
Birgit
Fischer§
a,
Ingo
Steinke
a,
Fabian
Westermeier¶
a,
Michael
Sprung
a and
Gerhard
Grübel
ab
aDeutsches Elektronen-Synchrotron DESY, Notkestr. 85, 22607 Hamburg, Germany. E-mail: martin.schroer@desy.de; Fax: +49-40-8994-2787; Tel: +49-40-8998-2644
bThe Hamburg Centre for Ultrafast Imaging (CUI), Luruper Chausee 149, 22761 Hamburg, Germany
First published on 5th June 2015
Abstract
We report on a nano-beam small angle X-ray scattering study on densely-packed, dried binary films made out of spherical silica particles with radii of 11.2 and 19.3 nm. For these three-dimensional thin films prepared by drop casting, only a finite number of colloidal particles contributes to the scattering signal due to the small beam size of 400 × 400 nm2. By scanning the samples, the structure and composition of the silica particle films are determined spatially resolved revealing spatial heterogeneities in the films. Three different types of domains were identified: regions containing mainly large particles, regions containing mainly small particles, and regions where both particle species are mixed. Using the new angular X-ray cross-correlations analysis (XCCA) approach, spatial maps of the local type and degree of orientational order within the silica particle films are obtained. Whereas the mixed regions have dominant two-fold order, weaker four-fold and marginal six-fold order, regions made out of large particles are characterized by an overall reduced orientational order. Regions of small particles are highly ordered showing actually crystalline order. Distinct differences in the local particle order are observed by analyzing sections through the intensity and XCCA maps. The different degree of order can be understood by the different particle size polydispersities. Moreover, we show that preferential orientations of the particle domains can be studied by cross-correlation analysis yielding information on particle film formation. We find patches of preferential order with an average size of 8–10 μm. Thus, by this combined X-ray cross-correlation microscopy (XCCM) approach the structure and orientational order of films made out of nanometer sized colloids can be determined. This method will allow to reveal the local structure and order of self-assembled structures with different degree of order in general.
Introduction
Crystals and ordered films consisting of colloidal particles can exhibit exciting new properties such as photonic band gaps or negative refraction and can be used as photonic crystals or as templates for the formation of nanostructured materials like catalysts.1–5 In particular, colloidal crystals made out of two types of particles with different sizes are of recent interest,6 as these are known to show a rich phase diagram.7 Different types of structures formed by binary colloidal systems have been reported.8–13 Especially, binary systems serve as model systems for studying the dense packing of matter as they can exhibit a larger space filling than monodisperse systems.12,14,15 Hence, a large effort has been made to fabricate and characterize such systems within the last years.3,5,16,17 A crucial step during structure formation is the drying process, as the resulting crystal structure is largely affected by the conditions under which the drying takes place.17–20 In particular, special attention has been paid recently to the local order within colloidal crystals,21–23 since detailed knowledge of such local order is both mandatory for the fabrication of materials with dedicated functional properties and for the understanding of self-assembly processes.5,24–26Conventional structural studies of thin colloidal films rely on scanning electron microscopy (SEM)6–8,23 and diffraction techniques.27–30 SEM yields real-space images of nanometer-resolution but is limited to surfaces. In contrast, standard scattering techniques probe the bulk of the sample. Here information on the local orientational order is usually lost except when large crystallites are present. Even when using X-ray beams of several ten micrometers in size, one is limited to study highly ordered nanoparticle films.31 In order to overcome these limitations, a technique is needed which allows to study the local orientational order also of the bulk with high spatial resolution without the requirement of long-range ordered samples. With this it will be possible to investigate nanoparticle films exhibiting only local order as well as those showing long-range order.
For this purpose, we use a new method, X-ray cross-correlation microscopy (XCCM), that allows to study spatially resolved the structure and especially the local type and degree of order. By scanning with a nanofocus X-ray beam of 400 × 400 nm2 size in small angle X-ray scattering (SAXS) geometry, we study three-dimensional densely-packed thin colloidal films made out of dried binary mixtures of spherical silica particles prepared by drop-casting. Such binary colloidal films made of small particles produced by drop-casting are expected to be densely-packed3 and serve as model systems for studying the local order. Due to the small focal size, only a limited number of colloidal particles gives rise to the recorded two-dimensional SAXS patterns. In addition, we study the local type and strength of the orientational order. Therefore, the two-dimensional SAXS patterns were additionally analyzed with the recently developed X-ray cross-correlations analysis (XCCA) technique.32 This method allows to determine the orientational order present in materials lacking long-range order.
Using this X-ray microscopy technique spatially resolved maps of the binary silica particle films are obtained. These show a heterogeneous distribution of the particles within the dense films as well of the orientational order between them. By this, the characteristic degree of order for regions containing different particle types are discovered. Moreover, we demonstrate that local domains formed by the silica particles are organized in patches of preferential orientation. With combined nano-beam SAXS and XCCM this structural information is accessible for colloids of only a few nanometers in diameter. Based on this method, the local structure of extended nanoparticle films of different composition and formed under different conditions will be accessible.
Methods
Sample preparation
Two batches of spherical silica particles were synthesized using a modified Stöber method33,34 yielding systems of different average particle size. The number concentration of these was determined thermogravimetrically. Aqueous dispersions of these silica particles with mixing ratio X = NS/(NS + NL) (NS: number of small colloids in dispersion, NL: number of large colloids in dispersion) were prepared by taking the corresponding quantities from stock solutions. A droplet of the mixture was deposited on a silicon nitride (Si3N4) membrane of 1 μm thickness and put in a vacuum oven (temperature ca. 90 °C) for 1 h to remove water. The dried colloidal films consist of several colloidal layers (60–70 layers in average) calculated assuming a homogenous covering of densely packed particles. This assumption is reasonable as by this drop casting method, closely-packed colloidal films are formed.3 These films were used for the experiments.Experimental protocol
Nano-focus SAXS experiments were performed at the coherent nano-focus endstation GINIX (Göttingen Instrument for Nano-Imaging with X-rays)35 located at beamline P10 at PETRA III, DESY, Hamburg.36 The beam size on the samples was 400 × 400 nm2 (v × h, FWHM) at an X-ray energy E = 13.00 keV (wavelength λ = 0.954 Å) using elliptical mirrors in Kirkpatrick–Baez (KB) geometry. The samples were placed in the focus of the KB mirrors. Two tungsten pinholes were positioned in front of the samples to reduce parasitic scattering and thus ensure a well-defined sample illumination. Fig. 1(a) schematically shows the set-up of the experiment. SAXS patterns were recorded by a two-dimensional Pilatus 300 K detector at a sample-to-detector distance of 5.06 m. The samples were scanned vertically and horizontally in 2 μm steps to record scattering patterns from different regions of the dried colloidal films. | ||
| Fig. 1 (a) Schematic set-up of the experiment. (b) Azimuthally averaged and background corrected scattering signal, I(Q), of the two silica particle species. The relevant Q-partitions are chosen such that the scattering signals of the large and the small species at Q1 and Q2 show a maximized difference. | ||
X-ray cross-correlation analysis
In order to investigate the spatially resolved degree of orientational order within the films, angular cross-correlations from the scattering patterns have been analyzed. The general definition of such an angular cross-correlation function of a two-dimensional scattering pattern for fixed Q is32,37 | (1) |
In order to determine these angular contributions directly, the angular Fourier coefficient of l-th order, Ĉl(Q), is considered that is given as
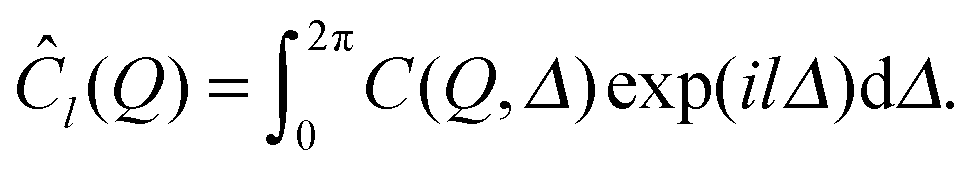 | (2) |
| Ĉl(Q) = |ÎNl(Q)|2. | (3) |
![[Q with combining right harpoon above (vector)]](https://www.rsc.org/images/entities/i_char_0051_20d1.gif) ) = I(−). The phase Ωl(Q) reflects how different patterns are orientated with respect to a reference frame and therefore yields insight into the orientation between particle domains.
) = I(−). The phase Ωl(Q) reflects how different patterns are orientated with respect to a reference frame and therefore yields insight into the orientation between particle domains.
In order to determine |ÎNl(Q)| and Ωl(Q) for the colloidal films spatially resolved, each scattering pattern is normalized by its mean angular intensity I(Q) and from this the angular Fourier transform is computed. Separation of absolute and imaginary part allows to access both quantities of interest.
Results and discussion
Scattering intensity maps
SAXS patterns were recorded of different three-dimensional thin films made from mixtures of two different silica particle species. First, films made solely from single silica particle species were studied. As the beam size on the samples is one order of magnitude larger than the typical particle size, a finite number of 100–200 particles per layer contribute to the scattering signal. Instead of single isotropic structure factor rings broad Bragg reflections are present in the SAXS patterns. These indicate that the particles are arranged in local ordered domains. The azimuthally averaged and background corrected scattering intensity I(Q) measured for these films are depicted in Fig. 1(b). Herein, and Θ denotes the scattering angle. The scattering signals contain contributions from the form factor P(Q), characterizing the particles' size, shape and polydispersity, and from the structure factor S(Q). The later one reflects interparticle correlations and gives rise to a pronounced peak in the scattering intensity.
With the form factor for polydisperse spheres, the average particle radius and size polydispersity were obtained for the large (〈RL〉 = 19.3 nm, ΔRL/〈RL〉 = 13.5%) and the small (〈RS〉 = 11.2 nm, ΔRS/〈RS〉 = 8.9%) species, respectively. As the maxima of the scattering intensity I(Q) of the two dried thin film samples are clearly separated, two representative Q-partitions are used for the further analysis. The centers of these Q-partitions are at Q1 = 0.16 nm−1 and Q2 = 0.31 nm−1 with a partition width ΔQ = 0.01 nm−1.
Dried films made from dispersions of both colloid species with mixing ratio X were studied by scanning nano-beam X-ray scattering. As the particle size ratio of α = 〈RS〉/〈RL〉 = 0.58 resembles that found in natural opals that show a dense packing for X close to 0.66,46,47 we studied dried films with this particle mixing ratio. The average film thickness of the sample estimated from the particle concentration was about 2.5–3.0 μm corresponding to about 60–70 nanoparticle layers. Thus, a total number of about 105 particles gives rise to the scattering signal. The same experiment was performed for different mixing ratios from which a representative example for X = 0.89 is presented in the ESI.† The prepared films were not homogeneous when inspected under an optical microscope but showed edges and cracks common for thin colloidal films of a certain thickness consistent with the calculated film thickness.17,48
Summing up the total scattering intensity of each recorded SAXS pattern for different sample positions allows to obtain a two-dimensional intensity map. This is shown for the dried colloidal film with mixing ratio X = 0.66 in Fig. 2(a). The map reveals that within the drying process, a heterogeneous film was formed as otherwise a more homogeneous scattering intensity distribution would be present. Clearly, the edge of the film as well as a characteristic crack from top-to-bottom can be seen for x = 50 μm. These characteristic features of the film where confirmed by simultaneous optical microscopy of the film, using an on-axis microscope before starting the X-ray scans of the sample.
 | ||
| Fig. 2 (a) Scanning map of the total scattering intensity of a dried colloidal film of mixing ratio X = 0.66 using the total recorded Q-range. (b) and (c) Scanning maps of the integrated intensity in the Q1 and Q2-partitions. Symbols highlight features in these maps. (d) Schematic map of the particle distribution within the film. “large” refers to regions where the large particles are dominant, “small” to regions where the small particles are dominant, and “mixed” to areas where both particle species are present. | ||
The total intensity map reflects the particle film thickness distribution within the sample. Regions with no or only few colloidal particles exhibit a low total scattering intensity. In contrast, strong intensity reflects areas of high particle density like different features of the film such as a flake (black star) and the various regions of intense scattering (black circle, white pentagon), yielding information on the morphology. Such intense total scattering can stem from different local film heights with different distribution of particles within the film. Distinguishing between these different contributions allows to characterize the heterogeneity of the thin colloidal film in more detail. However, information on the particle composition is not obtainable from this total scattering map.
To reveal more about the particle composition, Q-resolved maps are studied. Fig. 2(b) and (c) depict maps based on the scattering intensity within the Q1- and Q2-partition, respectively. As the two maps correspond to the scattering intensity maxima of the different particle species, i.e. Q1 for the large and Q2 for the small colloidal particles, these intensity maps at different Q are sensitive to the respective particle type. Features present in both maps stem from regions occupied by both particles. Characteristics only present in one of the maps can be attributed to the specific particle species. Studying intensity maps Q-resolved yields more insight into the local structure than the conventionally analyzed total intensity map. For instance, the intense region in the upper right part of Fig. 2(b) for Q1 (black pentagon), being absent for Q2 (Fig. 2(c)), can be attributed to layers of the large silica particles, segregated from the mixed phase within the drying process. Similarly, a flake made out of the large species lying within a region of mixed colloids is only present for Q1 (white star). In contrast, a small and intense region (black dot) in the total intensity map is only present for the Q2-partition in Fig. 2(c). This reflects a highly concentrated area of small silica colloids at this part of the sample.
Fig. 2(d) shows a schematic map of the particle distribution within the thin colloidal film summarizing the findings of the composition analysis. Three different types of regions can be identified: large, homogeneous mixed regions where both particle species are present, as well as specific areas containing mainly the large particles (e.g. the flake and top-right region) and the small particles (e.g. the small region close to the film edge). Thus, employing Q-resolved maps, a heterogeneous particle composition within the film can be revealed. Besides this information on the film's morphology and composition, additional information on the orientational order within the film can be obtained using XCCA.
XCCA maps
Based on the angular cross-correlation analysis, spatial maps of the local degree of orientational order were obtained for the dried colloidal film of X = 0.66. A similar analysis was performed at X = 0.89 (see ESI†). Fig. 3 shows the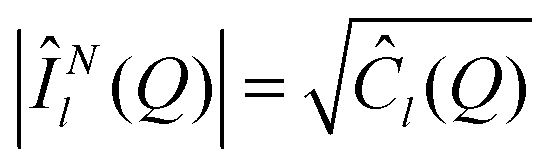 maps for two-fold (l = 2), four-fold (l = 4), and six-fold (l = 6) symmetry for both Q-partitions. Note that the magnitudes are on absolute scale and thus allow a direct comparison of the degree of orientational order between each other. As can be seen from eqn (1) and was shown in calculations,44,45 the isotropic particle form factor does not have any effect on the cross-correlation analysis, and the XCCA result is thus only based on the local interparticle correlations.
 | ||
| Fig. 3 Spatial maps of the degree of orientational order, |ÎNl(Q)|, of the colloidal film with X = 0.66 for l = 2 at (a) Q1 (“large particles”) and (b) Q2 (“small particles”), l = 4 at (c) Q1 and (d) Q2, and l = 6 at (e) Q1 and (f) Q2. Note that the magnitudes are on an absolute scale and can be compared directly. Different scaling thresholds had to be chosen, as the amplitudes of the different Fourier components vary. The two arrows in (b) indicate the direction in which sections were performed along the maps. | ||
In the |ÎNl=2(Q1)| map of the l = 2 Fourier component at Q1 (Fig. 3(a)), large amplitudes are present for scattering patterns from the edges of the nanoparticle film and especially close to the crack within the film. As the Q1-partition of the scattering patterns is close to the central beam, we suspect that streaks resulting from scattering on the film edges fall into this partition giving rise to the pronounced l = 2 contributions. Those near edge features will not be discussed further. The mixed regions of the films all have l = 2 amplitudes of medium intensity.
The other Fourier components studied (l = 4, 6,…) that are extracted at Q1 do not show any significant amplitudes at the edges and thus seem not to be substantially affected by the streaks. For l = 4 (Fig. 3(c)), the |ÎNl=4(Q1)| amplitudes are uniform and comparable to l = 2 within the mixed regions that contain both types of colloidal particles. The areas where solely the large silica particles are present (black pentagon, black star in Fig. 2(b)) have a reduced l = 4 amplitude. The l = 6 map (Fig. 3(e)) shows that six-fold order is weak but homogeneously distributed within the film.
For the Q2-partition (Fig. 3(b)), the |ÎNl=2(Q2)| map shows no edge effects. Strong contributions of l = 2 are present for the mixed particle regions, whereas regions consisting of large silica particles show a reduced two-fold symmetry. The same result is obtained for the corresponding l = 4 and 6 maps which exhibit overall smaller l-amplitudes (Fig. 3(d) and (f)). Notable, for the region of concentrated small particles (black dot in Fig. 2(c)) a high degree of two-, four- and six-fold orientational order is present exceeding that of the other areas of the sample. The same trend is present for higher Fourier components l = 8–12 (data not shown).
Based on XCCA the dried colloidal film can be characterized as follows. For the mixed regions, the l = 2 component is the dominant Fourier component. Here, the l = 4 contribution is weaker and the l = 6 component in the mixed regions is of only marginal amplitude. The region consisting of small particles is very ordered exhibiting high amplitudes of all l-components. This indicates the presence of a small crystalline region made out of the small silica particles. For the regions of large particles, the l = 2 and 4 contributions are smaller than that of the mixed regions indicating reduced orientational order.
Map sections
In order to investigate how the orientational order is distributed within the sample and to highlight the difference between the intensity maps and those obtained via cross-correlation analysis, two specific sections in the maps are analyzed in detail. In Fig. 3(b) these two sections are depicted by arrows. Section “A” is performed horizontally (x-direction) from the left edge of the colloidal film passing the segregated flake of the Q1 map and the intense spot of the Q2 map. Perpendicular to this direction (y-direction) it was averaged over a region of 8 μm width for Q1 and 2 μm width for Q2 to contain fully the flake and the spot, respectively. For section “B” the analysis is performed vertically (y-direction) from the intense region in the upper right part down to the end of the colloidal film. The data are averaged over a region of 10 μm width in x-direction. The l = 2 contribution for the Q1-partition characterizes the scattering from the film edges and is not discussed further.Fig. 4 shows the intensity and degree of orientational order for both sections along the colloidal film for both Q-partitions. The displayed scattering intensities in each of the figures indicates the electron density profile of the sample. For the horizontal section “A”, the sharp increase around x = 10 μm shows the edge of the film (Fig. 4(a) and (b)). For Q1, l = 4 and 6 show a similar steep transition. This shows that there is no disordered transition area close to the edge but the four- and six-fold order are immediately present within the sample. The higher order Fourier components l = 8–12 show a similar behavior and have a similar value as l = 6 and are thus not shown. More centrally on the film, a strong increase of scattering intensity is present at x = 22–60 μm. This stems from scattering from the flake formed by large colloids. In contrast, the l = 4 contribution is reduced within the flake region. For the region of mixed particles (x > 60 μm) the l = 4 amplitude is larger than the one for the flake region. This suggests that the degree of four-fold order within the mixed phase is larger than for the region made of large particles. The |ÎNl=6(Q1)| section has a smaller amplitude and exhibits maxima at the position of the crack as well as at similar positions as |ÎNl=4(Q1)|.
 | ||
| Fig. 4 Sections of both intensity and cross-correlation maps. Horizontal section along “A” (a) for Q1 (“large particles”) and (b) for Q2 (“small particles”). Vertical section along “B” (c) for Q1 and (d) for Q2. Solid lines are guides to the eye indicating the different regions of the sample (regions of large particles, small particles, mixed region). | ||
For section “A” evaluated at Q2 (Fig. 4(b)), the increase of the scattering intensity at the region made out of small colloids (x = 16–24 μm) is accompanied by an increase of all evaluated Fourier components. The l = 2 contribution at this spot is only slightly larger than for the mixed region. For the other components a strong peak is present at this position, with l = 6 being the strongest contribution followed by l = 4.
Analyzing the maps vertically along the “B” direction confirms the previous results for direction “A”. Whereas for the Q1-partition a strong scattering intensity is present for y = 0–40 μm, i.e. in the region of large particles (Fig. 4(c)), the degree of order is small and increases steeply at the transit to the mixed phase. This can been seen as well for the Q2-partition (Fig. 4(d)). Here, the l = 2 contribution is the dominating Fourier component. The section for l = 4 has a smaller amplitude but a similar shape. The l = 6 contribution is nearly constant.
Results of the film structure
The results of the intensity maps, the cross-correlation analysis maps and the corresponding sections show that the type and degree of local orientational order is different for regions of large and small colloids as well as the mixed phases in the densely-packed film. The small area containing purely small silica particles of 〈RS〉 = 11.2 nm exhibits the highest degree of order. Large |ÎNl(Q)| values are present in case of highly ordered particles within domains showing crystalline order.44,45 For such structures, strong amplitudes of the higher harmonics of the characteristic Fourier components are present, such as l = 4, 8, and l = 6, 12 for cubic and hexagonal structures, respectively. Thus, the pronounced |ÎNl(Q)| value for all l-values studied as well as the high scattering intensity of this part of the colloidal film indicate the presence of a small crystalline area made out of this particle species. Due to the low particle size polydispersity of ΔRS/〈RS〉 = 8.9% crystallization is not prevented but the particles can form highly ordered structures.49,50In contrast, the segregated regions of the large silica particles have a significantly reduced orientational order. Here, the absence of crystallinity even at small length scales can most likely be attributed to the high polydispersity (ΔRL/〈RL〉 = 13.5%) which is known to suppress crystallization for hard sphere and charge stabilized systems.49,50
For the regions containing both particle species the degree of order suggests the presence of locally ordered domains. Due to the mixing, structures can be present having different orientational order than the pure phases. Domains with dominant l = 2 order cannot be directly identified. However, for a system with radius ratio α = 0.58 and mixing ratio X = 0.66, a spatial heterogeneous mixture of the so-called AB2 and AB13 (A: large particle, B: small particle) structures seems to be the most probable one.28,47,51,52 The first one consists of a hexagonal closed packing of large spheres A with small B particles filling the holes between it, whereas in the AB13 structure the larger particles form a simple cubic lattice which is filled by 13 small ones (see ESI†). The reduced higher order symmetries can be attributed to both high polydispersity due to the mixing of the two species and imperfect crystallization conditions during the drying process which also led to segregation.42,45
Preferential orientation in the colloidal film
Besides the spatial resolved type and degree of orientational order obtained by X-ray cross-correlation microscopy, a preferential orientation of the domains can be determined in terms of the phase Ωl(Q). Fig. 5(a) shows the geometrical interpretation of Ωl(Q) (for the definition see Methods). It quantifies the angular orientation of the scattering patterns, and thus of the scattering object, with respect to a reference frame. Thus, in terms of four-fold symmetry, Ωl=4(Q) can have values in between 0° and 90°. This is schematically depicted in Fig. 5(b) for three different Ωl=4(Q)-values (Ω = 0°, 30°, 60°). We are focusing here on the most relevant l = 4 contribution exemplary. | ||
| Fig. 5 (a) Geometric interpretation of the phase Ωl(Q) as the preferential orientation of a scattering pattern. (Note: The scattering pattern shown is from a film made out of only one particle species for demonstration.) (b) Schematic representation of different Ω values for four-fold symmetry. Maps of Ωl(Q) for l = 4 at (c) Q1 and (d) Q2. | ||
Fig. 5(c) shows the Ωl=4(Q1)-map for l = 4 and the Q1-partition. The striking feature of it is the preferential orientation that is distributed in Ωl=4(Q1)-patches of similar values within the sample. These Ωl=4(Q1)-patches are especially present for the borders between regions of different particle types, i.e. close to the film edges as well as in the segregation regions the same preferential orientation exists. When looking at more central regions of the sample there is a continuous change from Ωl=4(Q1) perpendicular to the borders. The same result is present for the Ωl=4(Q2)-map for l = 4 at the Q2-partition (Fig. 5(d)).
Studying the Ωl=4(Q2)-map at the region of concentrated small particles one finds that the preferential orientation is different from that of the patches at the film edges. Whereas edge regions exhibit Ωl=4(Q2) = 70° ± 5°, the area of small silica particles has Ωl=4(Q2) = 55° ± 5°. This indicates that the region consisting of small particles is not orientated in the same way but is located within the mixed region independent of its orientation.
From these maps the average size of the patches can be extracted directly studying sections of these. We find a patch size of 8–10 μm for an angular increment on 10°. This indicates that the preferential orientation persists over a large domain distance.
The patch-like preferential orientation of the colloids within the film is similar to the drying front of colloidal dispersions.17 Within the drying process the colloidal particles get more ordered on these fronts. This leads to the formation of ordered arrays on the film edge as was shown for particles ranging from about 0.2–2 μm.18,22 Our results indicate that this is true for small nanoparticles in the mixed phases as well, that were dried such that close-packed films formed.
Summary and conclusions
The combination of Q-resolved scanning X-ray nano-beam scattering microscopy and X-ray cross-correlation analysis allows to study details of the structure from densely-packed films made out of two different nanometer sized silica particles spatially resolved. Films of a few micrometer thickness containing 60–70 nanoparticle layers were prepared by drying mixed colloidal suspensions of particles with radii of 11.2 and 19.3 nm, respectively. Using an X-ray beam of 400 × 400 nm2 size, only a finite number of particles gives rise to the scattering signal.Total scattering intensity maps are obtained which reflect the spatial heterogeneities in the silica particle films. Regions of different particle species can be identified when studying these maps Q-resolved. By this, three different types of regions could be identified: mixed regions containing both silica particle species, regions containing dominantly large particles and regions containing dominantly small particles. The local type and degree of orientational order within these regions can be determined by XCCM. Regions of mixed particles are characterized by dominant l = 2, weaker l = 4 and marginal l = 6 Fourier components. Areas of large particles have an, in comparison to the mixed phase, weaker l = 2 and 4 order. Regions of small particles exhibit a high degree of orientational order as these form crystalline structures within the drying process. A reason for the different degree of order can be the different polydispersity of the particles that either, in the case of the small species, allow or, for the large species, suppress crystallization. Such results on the spatial distribution of the orientational order cannot be achieved by conventional analyzing schemes. In addition, the phase Ωl(Q) extracted from the cross-correlation analysis was introduced. In terms of Ωl(Q) the preferential orientation of the domains of colloids within the film can be described. Here, patch-like preferential orientation was found of patch size of 8–10 μm that resemble the drying front of silica particle suspensions.
The scattering intensity as well as the average film thickness and the presence of cracks within the film reveal a densely-packaged film with bulk-like properties whose structure can be well studied by the present approach but hardly by SEM methods. The combined approach of nano-beam scanning SAXS and XCCM allowed to gain information on the local structure within an extended dried film of mixed colloids of 10–20 nm size. Similar results as for the mixing ratio of X = 0.66 were obtained for other compositions (X = 0.89 is shown in the ESI†). In the presented study we could show that structural characteristics well known for larger particles of some micrometers to hundred nanometers also hold for dense films of smaller silica particle species of a few nanometers that on a first glance might seem less ordered due to the sample preparation.3
Future nano-beam X-ray studies might profit from employing a similar X-ray cross-correlation approach. For instance, studying nanoparticle films formed under several different drying conditions with this method will allow to track which type of local degree of order is established within these films. Since information on both the size of the illuminating X-ray focus, i.e. on the nanometer scale, as well as on the size of the scanned film region (several micrometers) is accessible, an extended picture of the local structure of self-assembled films beyond the surface can be accessed. In situ studies should allow the investigation of the drying process of nanometer sized colloids in great detail and thus shed light into different self-assembly processes. This type of study is impossible with standard SEM which requires vacuum conditions and thus does not allow to study liquid samples. Moreover, using XCCM more about crystallization and vitrification of colloidal particles could be learned. For these phenomena, knowledge about the presence and spatial differences of orientational order will help to get a deeper insight in these important but yet not fully understood processes. As was shown here, XCCM will be perfectly suited for this purpose. Finally, one can imagine to study even the local order within molecular systems and with very small beams performing XCCM in wide angle geometry.
Acknowledgements
The authors thank S. Kalbfleisch and M. Osterhoff for help with the nano-focus setup. This work has been supported by the excellence cluster “The Hamburg Centre for Ultrafast Imaging – Structure, Dynamics, and Control of Matter at the Atomic Scale” of the DFG. IS acknowledges financial support by the Deutsche Forschungsgemeinschaft within the framework of the graduate school 1355 “Physics with new advanced coherent radiation sources”. Parts of this research were carried out at beamline P10 at the light source PETRA III at DESY, a member of the Helmholtz Association (HGF).References
- A. Blanco, E. Chomski, S. Grabtchak, M. Ibisate, S. John, S. W. Leonard, C. Lopez, F. Meseguer, H. Miguez, J. P. Mondia, G. A. Ozin, O. Toader and H. M. van Driel, Nature, 2000, 405, 437 CrossRef CAS PubMed.
- O. Velev and E. Kaler, Adv. Mater., 2000, 12, 531 CrossRef CAS.
- D. V. Talapin, J.-S. Lee, M. V. Kovalenko and E. V. Shevchenko, Chem. Rev., 2010, 110, 389 CrossRef CAS PubMed.
- S.-H. Kim, S. Y. Lee, S.-M. Yang and G.-R. Yi, NPG Asia Mater., 2011, 3, 25 CrossRef CAS PubMed.
- O. Kruglova, P.-J. Demeyer, K. Zhong, Y. Zhou and K. Clays, Soft Matter, 2013, 9, 9072 RSC.
- K. Velikov, C. Christova, R. Dullens and A. van Blaaderen, Science, 2002, 296, 106 CrossRef CAS PubMed.
- M. Kim, S. Im and O. Park, Adv. Mater., 2005, 17, 2501 CrossRef CAS PubMed.
- D. V. Talapin, E. V. Shevchenko, M. I. Bodnarchuk, X. Ye, J. Chen and C. B. Murray, Nature, 2009, 461, 964 CrossRef CAS PubMed.
- M. P. Boneschanscher, W. H. Evers, W. Qi, J. D. Meeldijk, M. Dijkstra and D. Vanmaekelbergh, Nano Lett., 2013, 13, 1312 CrossRef CAS PubMed.
- M. I. Bodnarchuk, R. Erni, F. Krumeich and M. V. Kovalenko, Nano Lett., 2013, 13, 1699 CAS.
- L. Filion and M. Dijkstra, Phys. Rev. E: Stat., Nonlinear, Soft Matter Phys., 2009, 79, 046714 CrossRef CAS.
- T. S. Hudson, J. Phys. Chem. C, 2010, 114, 14013 CAS.
- A. B. Hopkins, Y. Jiao, F. H. Stillinger and S. Torquato, Phys. Rev. Lett., 2011, 107, 125501 CrossRef.
- P. I. O'Toole and T. S. Hudson, J. Phys. Chem. C, 2011, 115, 19037 Search PubMed.
- T. S. Hudson and P. Harrowell, J. Phys.: Condens. Matter, 2011, 23, 19 CrossRef PubMed.
- N. Dziomkina and G. Vancso, Soft Matter, 2005, 1, 265 RSC.
- A. F. Routh, Rep. Prog. Phys., 2013, 76, 046603 CrossRef PubMed.
- C. Zhou, J. Han and R. Guo, J. Colloid Interface Sci., 2013, 397, 80 CrossRef CAS PubMed.
- D. T. W. Toolan, S. Fujii, S. J. Ebbens, Y. Nakamura and J. R. Howse, Soft Matter, 2014, 10, 8804 CAS.
- F. Boulogne, F. Giorgiutti-Dauphine and L. Pauchard, Soft Matter, 2015, 11, 102 RSC.
- S. Neser, C. Bechinger, P. Leiderer and T. Palberg, Phys. Rev. Lett., 1997, 79, 2348 CrossRef CAS.
- A. G. Marin, H. Gelderblom, D. Lohse and J. H. Snoeijer, Phys. Rev. Lett., 2011, 107, 085502 CrossRef.
- S. Pichler, M. I. Bodnarchuk, M. V. Kovalenko, M. Yarema, G. Springholz, D. V. Talapin and W. Heiss, ACS Nano, 2011, 5, 1703 CrossRef CAS PubMed.
- G. M. Whitesides, J. P. Mathias and C. T. Seto, Science, 1991, 254, 1312 CAS.
- D. Dabbs and I. Aksay, Annu. Rev. Phys. Chem., 2000, 51, 601 CrossRef CAS PubMed.
- S. Glotzer, M. Solomon and N. Kotov, AlChE J., 2004, 50, 2978 CrossRef CAS PubMed.
- A. Petukhov, D. Aarts, I. Dolbnya, E. de Hoog, K. Kassapidou, G. Vroege, W. Bras and H. Lekkerkerker, Phys. Rev. Lett., 2002, 88, 208301 CrossRef CAS.
- A. B. Schofield, P. N. Pusey and P. Radcliffe, Phys. Rev. E: Stat., Nonlinear, Soft Matter Phys., 2005, 72, 031407 CrossRef CAS.
- S. Kim, K. Hyun, Y. S. Kim, B. Struth, C. Clasen and K. H. Ahn, Langmuir, 2013, 29, 10059 CrossRef CAS PubMed.
- Y. Yu, A. Jain, A. Guillaussier, V. Reddy Voggu, T. M. Truskett, D.-M. Smilgies and B. A. Korgel, Faraday Discuss., 2015, 1, 10.1039/C5FD00006H.
- B. T. Diroll, V. V. T. Doan-Nguyen, M. Cargnello, E. A. Gaulding, C. R. Kagan and C. B. Murray, ACS Nano, 2014, 8, 12843 CrossRef CAS PubMed.
- P. Wochner, C. Gutt, T. Autenrieth, T. Demmer, V. Bugaev, A. D. Ortiz, A. Duri, F. Zontone, G. Grübel and H. Dosch, Proc. Natl. Acad. Sci. U. S. A., 2009, 106, 11511 CrossRef CAS PubMed.
- W. Stöber, A. Fink and E. Bohn, J. Colloid Interface Sci., 1968, 26, 62 CrossRef.
- B. Fischer, T. Autenrieth and J. Wagner, Langmuir, 2010, 26, 6201 CrossRef CAS PubMed.
- S. Kalbfleisch, H. Neubauer, S. P. Krüger, M. Bartels, M. Osterhoff, D. D. Mai, K. Giewekemeyer, B. Hartmann, M. Sprung and T. Salditt, AIP Conf. Proc., 2011, 1365, 96 Search PubMed.
- A. V. Zozulya, S. Bondarenko, A. Schavkan, F. Westermeier, G. Grübel and M. Sprung, Opt. Express, 2012, 20, 18967 CrossRef CAS PubMed.
- M. Altarelli, R. P. Kurta and I. A. Vartanyants, Phys. Rev. B: Condens. Matter Mater. Phys., 2010, 82, 10 CrossRef.
- P. Wochner, M. Castro-Colin, S. N. Bogle and V. N. Bugaev, Int. J. Mater. Res., 2011, 102, 874 CrossRef CAS.
- R. P. Kurta, M. Altarelli, E. Weckert and I. A. Vartanyants, Phys. Rev. B: Condens. Matter Mater. Phys., 2012, 85, 18 CrossRef.
- R. P. Kurta, M. Altarelli and I. A. Vartanyants, Adv. Condens. Matter Phys., 2013, 1, 959835 Search PubMed.
- A. C. Y. Liu, M. J. Neish, G. Stokol, G. A. Buckley, L. A. Smillie, M. D. de Jonge, R. T. Ott, M. J. Kramer and L. Bourgeois, Phys. Rev. Lett., 2013, 110, 20 Search PubMed.
- R. P. Kurta, B. I. Ostrovskii, A. Singer, O. Y. Gorobtsov, A. Shabalin, D. Dzhigaev, O. M. Yefanov, A. V. Zozulya, M. Sprung and I. A. Vartanyants, Phys. Rev. E: Stat., Nonlinear, Soft Matter Phys., 2013, 88, 044501 CrossRef CAS.
- C. Gutt, L. Grodd, E. Mikayelyan, U. Pietsch, J. Kline and S. Grigorian, J. Phys. Chem. Lett., 2014, 5, 2335 CrossRef CAS.
- F. Lehmkühler, G. Grübel and C. Gutt, J. Appl. Crystallogr., 2014, 47, 1315 CrossRef.
- M. A. Schroer, C. Gutt and G. Grübel, Phys. Rev. E: Stat., Nonlinear, Soft Matter Phys., 2014, 90, 012309 CrossRef CAS.
- J. V. Sanders, Philos. Mag. A, 1980, 42, 705 CrossRef CAS PubMed.
- M. J. Murray and J. V. Sanders, Philos. Mag. A, 1980, 42, 721 CrossRef CAS PubMed.
- K. B. Singh and M. S. Tirumkudulu, Phys. Rev. Lett., 2007, 98, 218302 CrossRef.
- E. Zaccarelli, C. Valeriani, E. Sanz, W. C. K. Poon, M. E. Cates and P. N. Pusey, Phys. Rev. Lett., 2009, 103, 135704 CrossRef CAS.
- M. N. van der Linden, A. van Blaaderen and M. Dijkstra, J. Chem. Phys., 2013, 138, 114903 CrossRef PubMed.
- P. Bartlett, R. H. Ottewill and P. N. Pusey, Phys. Rev. Lett., 1992, 68, 3801 CrossRef CAS.
- M. D. Eldridge, P. A. Madden, P. N. Pusey and P. Bartlett, Mol. Phys., 1995, 84, 395 CrossRef CAS PubMed.
Footnotes |
| † Electronic supplementary information (ESI) available: Additional definition of XCCA; information on the superlattice structures; XCCM results of a binary colloidal film with mixing ratio X = 0.89. See DOI: 10.1039/c5sm00609k |
| ‡ Present address: Department of Physics, University of Siegen, Walter-Flex-Str. 3, 57072 Siegen, Germany. |
| § Present address: Institute for Physical Chemistry, University of Hamburg, Grindelallee 117, 20146 Hamburg, Germany. |
| ¶ Present address: Max-Planck-Institut für Struktur und Dynamik der Materie, Centre for Free-Electron Laser Science (CFEL), Luruper Chausee 149, 22761 Hamburg, Germany. |
| This journal is © The Royal Society of Chemistry 2015 |