 Open Access Article
Creative Commons Attribution 3.0 Unported Licence
Cholesterol expels ibuprofen from the hydrophobic membrane core and stabilizes lamellar phases in lipid membranes containing ibuprofen
Richard J.
Alsop
,
Clare L.
Armstrong
,
Amna
Maqbool
,
Laura
Toppozini
,
Hannah
Dies
and
Maikel C.
Rheinstädter
*
Department of Physics and Astronomy, McMaster University, ABB-241, 1280 Main Street West, Hamilton, Ontario L8S 4M1, Canada. E-mail: rheinstadter@mcmaster.ca; Fax: +1-(905)-546-1252; Tel: +1-(905)-525-9140-23134
First published on 20th April 2015
Abstract
There is increasing evidence that common drugs, such as aspirin and ibuprofen, interact with lipid membranes. Ibuprofen is one of the most common over the counter drugs in the world, and is used for relief of pain and fever. It interacts with the cyclooxygenase pathway leading to inhibition of prostaglandin synthesis. From X-ray diffraction of highly oriented model membranes containing between 0 and 20 mol% ibuprofen, 20 mol% cholesterol, and dimyristoylphosphatidylcholine (DMPC), we present evidence for a non-specific interaction between ibuprofen and cholesterol in lipid bilayers. At a low ibuprofen concentrations of 2 mol%, three different populations of ibuprofen molecules were found: two in the lipid head group region and one in the hydrophobic membrane core. At higher ibuprofen concentrations of 10 and 20 mol%, the lamellar bilayer structure is disrupted and a lamellar to cubic phase transition was observed. In the presence of 20 mol% cholesterol, ibuprofen (at 5 mol%) was found to be expelled from the membrane core and reside solely in the head group region of the bilayers. 20 mol% cholesterol was found to stabilize lamellar membrane structure and the formation of a cubic phase at 10 and 20 mol% ibuprofen was suppressed. The results demonstrate that ibuprofen interacts with lipid membranes and that the interaction is strongly dependent on the presence of cholesterol.
1 Introduction
In addition to specific interactions with biochemical targets, many drugs and pharmaceuticals are known to interact with lipid membranes through non-specific molecular interactions.1,2 For example, physical interactions with lipid membranes can cause changes to the membrane's fluidity, thickness, or area per lipid.3,4 As many biological processes, such as cell signalling and adhesion, are mediated by the membrane and membrane bound proteins, changes to membrane processes induced by drugs can lead to significant changes in their biological function.5–9When assessing the impact of a foreign molecule (such as a drug) on membrane properties, the partitioning of the drug within the membrane is often crucial. As an example, the common analgesic aspirin has been shown to interact with the head group region of the lipid membrane leading to an increase in lipid fluidity.10,11 Aspirin was eventually found to counteract cholesterol's condensing effect and to redissolve cholesterol plaques in lipid bilayers at high cholesterol concentrations,12,13 and also to inhibit formation of cholesterol rafts at physiological concentrations of cholesterol.14 In contrast, the co-surfactant hexanol partitions into the tail group region leading to profound changes in the membrane structure as it induces a lamellar to hexagonal phase transition.15 In particular, small molecules can change partitioning of peptides in membranes. Melatonin was shown to reduce the population of the membrane-embedded state of amyloid-β25–35, a peptide involved in plaque formation in Alzheimer's disease.16
Ibuprofen is a non-steroidal anti-inflammatory drug (NSAID) who's primary effect is related to the inhibition prostaglandin synthesis, leading to anti-inflammatory and pain killing properties.17,18 Ibuprofen is a non-selective inhibitor of the cyclooxygenase enzyme. However, there is evidence for an interaction of ibuprofen with lipid membranes. Several studies have reported that ibuprofen leads to an increase in area per lipid19 and membrane defects,20 as well as a decreased membrane bending modulus, κ.21
Here, we determine the location of ibuprofen in saturated lipid bilayers at a concentration of 2 mol% and report experimental evidence for an indirect, non-specific interaction between ibuprofen and cholesterol in membranes containing 5 mol% ibuprofen and 20 mol% cholesterol. Through X-ray diffraction in multi-lamellar, oriented membranes, we locate the ibuprofen molecule in the head group region and the hydrophobic core of the bilayers and observe that the presence of cholesterol expels ibuprofen from the membrane core. Cholesterol was also found to stabilize lamellar membrane structure, as the formation of an inverse cubic phase at high concentrations of 10 and 20 mol% ibuprofen was suppressed when 20 mol% cholesterol was present.
2 Results
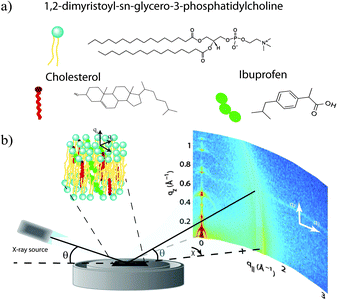
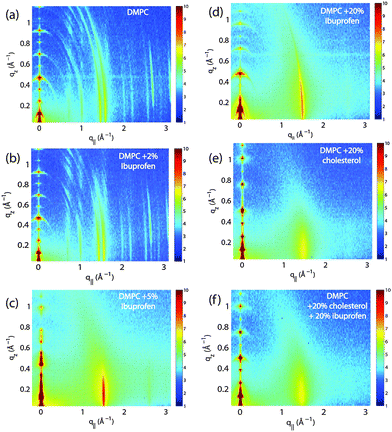
Highly oriented, multi-lamellar membrane stacks were prepared on silicon wafers and the molecular structure was studied using high resolution X-ray diffraction imaging, as depicted in Fig. 1. By using oriented membranes, the in-plane (q||) and out-of-plane (qz) structure was determined separately, but simultaneously. All membranes were incubated at 30 °C in 100% humidity for 24 h before the measurements and scanned at a temperature of T = 28 °C and 50% relative humidity (RH). Similar to protein crystallography, this dehydrated state suppresses thermal fluctuations, increases the number of higher order Bragg peaks and thereby enhances structural features, allowing for a high spatial resolution.22Fig. 2 shows 2-dimensional reciprocal space maps for a subset of samples in this study. Measurements are taken for −0.3 Å−1 < q|| < 3 Å −1 and 0 Å−1 < qz < 1.1 Å−1. Pure DMPC membranes are shown in Fig. 2(a). Some qualitative conclusions can be drawn from the scattering patterns. The observed scattering shows a number of well defined intensities along both, the out-of-plane (qz) and in-plane (q||) axis, indicative of lamellar bilayers with strong in-plane ordering.
The arrangement of the different molecular components in the plane of the membranes can be determined from the in-plane scattering along q||. As suggested by Katsaras and Raghunathan,23,24 different molecular components, such as lipid tails, lipid head groups and also ibuprofen and cholesterol molecules, can form molecular sub-lattices in the plane of the membrane leading to non-overlapping sets of Bragg peaks.
The 100% DMPC sample in Fig. 2(a) shows a number of well developed in-plane Bragg peaks. The diffracted intensity has a distinct rod-like shape, typical for a 2-dimensional system. The out-of-plane scattering along qz shows pronounced and equally spaced Bragg intensities due to the multi lamellar structure of the membranes.
As detailed for instance in Barrett et al.,10 the in-plane Bragg peaks can be assigned to two different molecular lattices, the lipid head groups and the lipid tails: an orthorhombic head group lattice (planar space group p2) with lattice parameters a = 8.773 Å and b = 9.311 Å (γ = 90°) and a commensurate monoclinic lattice of the lipid tails with parameters aT = 4.966 Å, bT = 8.247 Å and γS = 94.18°. The orthorhombic unit cell of the head group lattice contains two lipid molecules and has an area of AH = aHbH = 81.69 Å2. The area per lipid can also be determined from the unit cell of the tails, which contains one lipid molecule, to AT = aTbTsinγT = 40.84 Å2. This area can be compared to results published by Tristram-Nagle, Liu, Legleiter and Nagle,25 who provided a reference for the structure of gel phase DMPC membranes. The authors find an area per lipid of ∼47 Å2 in fully hydrated bilayers at T = 10 °C. The membranes in our study were measured at T = 28 °C, however, de-hydrated to 50% RH to enhance structural features leading to a more closely packed gel structure.
The sample with 2 mol% ibuprofen in Fig. 2(b) shows a qualitatively similar pattern indicating that small amounts of ibuprofen do not lead to a significant change in membrane structure or topology. However, membranes prepared with 5 mol% and 20 mol% ibuprofen in Fig. 2(c) and (d) show a single in plane feature at q|| = 1.5 Å−1. This peak is indicative of hexagonal packing of disordered lipid tails.26 Additional reflections are observed along qz, indicative of a change in membrane topology from the lamellar phase. Samples prepared with 20 mol% cholesterol also show disordered in-plane profiles (Fig. 2(e) and (f)), however, a lamellar qz pattern.
2.1 Electronic properties of ibuprofen
Ibuprofen is an overall hydrophobic drug consisting of a large, hydrophobic body comprised of an aromatic ring and a carbon tail, and a small, hydrophilic head, where the oxygen groups are located. Ibuprofen was found to have low partitioning into water and to locate in the lipid phase,27 preferentially in the interfacial region of the bilayer.28As electromagnetic waves, X-rays mainly interact with the electronic structure of molecules. Electron distributions describing the ibuprofen molecule were calculated using the solved crystal structure of ibuprofen.29 The corresponding structure file is deposited in the Crystallography Open Database with reference number 2006278. To take into account thermal motion of atoms and electrons, the position of each atom was modeled by a Gaussian distribution with a width (FWHM) of 1 Å (or, in the case of samples with cholesterol, 2 Å) and the corresponding electron distributions were then projected onto the z-axis. The molecule can be rotated to have any orientation with respect to the z-axis.
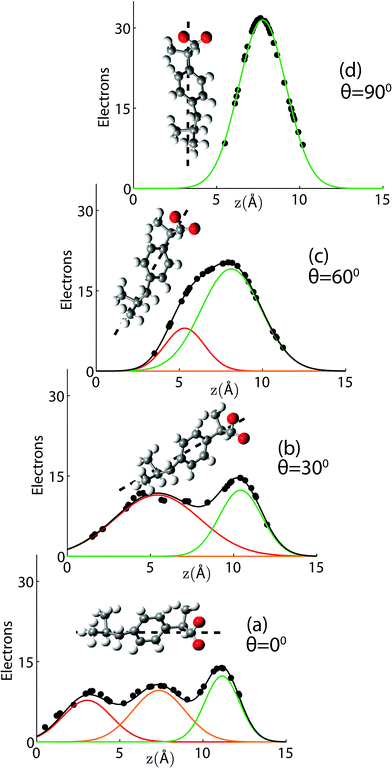
When the long axis of the molecule is not tilted with respect to the z-axis, three Gaussian distributions well describe the averaged profile, as shown in Fig. 3(a). The first peak is assigned to the tail region of the ibuprofen, the second to the ring structure, and the third peak to the oxygenated head region. When the ibuprofen molecule is tilted between 30° and 60° two Gaussians are required, as depicted in Fig. 3(b) and (c). When the molecule is tilted 90°, only a single Gaussian is needed to describe the distribution, as shown in Fig. 3(d).
The Gaussian distributions used to describe the ibuprofen profiles were then shifted and scaled to fit observed changes in membrane electron density with the inclusion of ibuprofen. The orientation and position of all membrane-embedded states can be determined in this fashion with high accuracy. This technique was used previously by Dies et al., who used the atomic structures of amyloid-β peptides and melatonin to determine the location of peptides and enzyme in lipid membranes of different membrane compositions.16,30
2.2 The interaction of ibuprofen with DMPC membranes
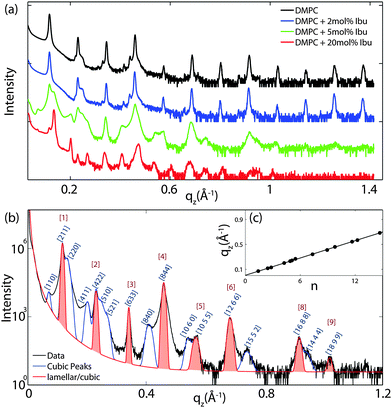
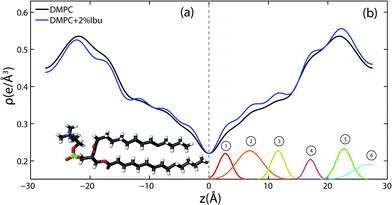
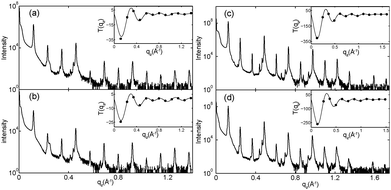
For further quantitative analysis, the 2-dimensional data in Fig. 2 were cut along the qz direction. Out-of-plane diffraction for DMPC membranes prepared with ibuprofen concentrations from 0 mol% to 20 mol% is presented in Fig. 4(a). Up to twelve evenly spaced diffraction peaks were observed for pure DMPC bilayers, indicative of a well ordered lamellar structure. The measured lamellar spacing, dz, for the pure DMPC was determined to be 55.1 Å, in agreement with previous reports.10,25 A similar pattern is observed for DMPC + 2 mol% ibuprofen, which indicates that small amounts of ibuprofen do not change the structure of the bilayers significantly or alter the topology of the membranes. Additional peaks are observed at higher ibuprofen concentrations of 5 mol% and 20 mol% in Fig. 4(a). The structural changes associated with these reflections will be discussed below.The location of the ibuprofen molecules in the saturated lipid bilayers can be determined by comparing the results for pure DMPC and DMPC + 2 mol% ibuprofen. Electron density profiles of the membranes, ρ(z), were assembled by Fourier synthesis of the observed lamellar Bragg peaks, as detailed in the Materials and methods section (Section 4). Bilayer profiles for samples with 0 mol% and 2 mol% ibuprofen are plotted in Fig. 5. The profile for a pure DMPC membrane corresponds to a lipid bilayer in the gel state with both chains in an all-trans configuration, as reported previously.25 The electron rich phosphorous group in the head region can be identified by the absolute maximum in the electron density profile at z ∼ 22 Å. ρz monotonically decreases to the bilayer centre at z = 0, where CH3 groups reside in the centre with an electron density of ρz = 0.22 e− Å−3.
The electron density profiles for both samples are shown in Fig. 5(a) on an absolute scale for ρ(z). There is a general decrease in electron density with the addition of electron-poor ibuprofen and the removal of electron-richer DMPC molecules. The ibuprofen-containing profile was scaled to compensate this overall loss of electron density and to to more clearly determine the profile changes induced by the drug, as shown in Fig. 5(b). The electron density profile for 98% DMPC + 2 mol% ibuprofen was scaled such that it modelled a pure DMPC (100% DMPC + 2 mol% ibuprofen). The difference curve between the scaled profile with ibuprofen and the unscaled DMPC profile shows an increase in electron density due to ibuprofen in both the head group and tail regions, which is well modelled by 6 Gaussian distributions, marked by ① to ⑥. Regions of the bilayer profile without ibuprofen molecules coincide with the pure DMPC bilayer in part (a).
The electronic distribution of an ibuprofen molecule can be fit to the difference curve to determine the position and orientation ibuprofen molecules. Three embedded states were observed. Three of the observed Gaussian distributions at z = 3 Å, 7 Å, and 11.5 Å were assigned to a single ibuprofen molecule residing in the hydrophobic membrane core, oriented parallel with the bilayer z-axis, with a tilt angle of 0° ± 5°. In addition to changes in the tail regions, two additional increases in electron density were observed in the head group region. A single peak is found at z = 17 Å, best described by a bound ibuprofen molecule, rotated by 90° ± 11° with respect to the z-axis, at the interface of the head group and tail group regions. Two peaks at z = 23 Å and z = 27 Å are best described by a molecule which is distributed between the two bilayers and aligned with the z-axis (tilt of 0° ± 5°). The peak at z = 23 Å is described by the electron distribution of both the hydroxyl group and the terminal methyl groups of an ibuprofen molecule, suggesting both portions of the molecule are observed embedded in the head groups (of opposite bilayers). The peak at z = 27 Å suggests the ring-group of ibuprofen observed between bilayers. A cartoon depicting the three membrane bound states for ibuprofen is shown in Fig. 9(a). By integrating the area under the peaks in the difference electron density curve, the relative occupation of each bound state can be determined. A relative occupation of 56% is observed for the upright state in the tails, 8% for the rotated state at the head–tail interface, and 36% for the state in the head groups.
Fig. 4(b) shows the out-of-plane diffraction pattern obtained from a membrane prepared with 5 mol% ibuprofen in a pure DMPC membrane. All observed peaks are fit with Gaussian peak profiles. The observed peaks cannot be indexed by a pure lamellar phase, however, may be indexed to a Im3m cubic structure with lattice parameter a = 134 Å. The corresponding cubic phase Miller indices are given on the figure; however, select peaks are indexed by a lamellar phase with bilayer spacing of dz = 55.1 Å. These peaks are indicated by red Gaussian profiles in Fig. 4(b). Peaks solely indexed by the cubic phase are described by blue profiles. Note that the spacing of the [211] plane of cubic phases is often observed to be epitaxially related to the bilayer spacing of the lamellar phase. The position, d-spacing, and Miller indices for all peaks extracted from Fig. 4(b) are listed in Table 1.
| q z -Position (Å−1) | d-Spacing (Å) | Miller index |
|---|---|---|
| 0.077 | 88.3 | [110] |
| 0.117 | 53.7 | [211] |
| 0.131 | 48.1 | [220] |
| 0.201 | 31.2 | [411] |
| 0.231 | 27.2 | [422] |
| 0.242 | 25.9 | [015] |
| 0.268 | 23.4 | [521] |
| 0.342 | 18.4 | [633] |
| 0.410 | 15.3 | [840] |
| 0.460 | 13.7 | [844] |
| 0.543 | 11.6 | [10 6 0] |
| 0.568 | 11.1 | [10 5 5] |
| 0.684 | 9.18 | [12 6 6] |
| 0.741 | 8.48 | [2 5 15] |
| 0.918 | 6.84 | [16 8 8] |
| 0.940 | 6.68 | [4 14 14] |
| 1.021 | 6.15 | [18 9 9] |
To determine the relation between cubic and lamellar phase and the orientation of both phases, 2-dimensional X-ray maps of the region of interest were obtained for membranes with 0 mol%, 10 mol%, and 20 mol% ibuprofen, and are displayed in Fig. 6. The plots show the region 0 < qz < 0.21 Å−1 and 0 < q|| < 0.21 Å−1 in more detail, as compared to the overview plots in Fig. 2. The pure DMPC bilayers in Fig. 6(a) show the lamellar [100]L Bragg peak and two diffuse contributions: the lamellar diffuse scattering occurring in horizontal sheets is the result of bilayer undulation dynamics. Bilayers, which are not perfectly oriented parallel to the silicon substrate lead to a faint powder ring, labeled as “defect scattering”. The number of these defect bilayers is typically very small as evidenced by the logarithmic intensity plot.
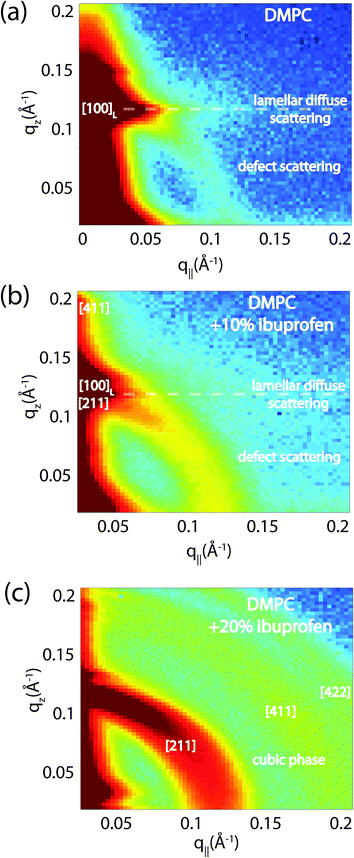 | ||
| Fig. 6 High resolution reciprocal space maps show the increase in powder scattering with increased ibuprofen. Bilayers were prepared with concentrations of: (a) 0 mol%; (b) 10 mol% and (c) 20 mol% ibuprofen. Only a lamellar peak is observed for pure DMPC. The observed diffuse scattering was attributed to lamellar diffuse scattering due to fluctuations and defect scattering as the result of a small fraction of bilayers not perfectly aligned on the substrate.31 For a membrane with 10 mol% ibuprofen, the defect scattering significantly increased indicative of a large fraction of “misaligned” bilayers. A cubic pattern is observed at 20 mol% ibuprofen. Intensities are shown on a logarithmic scale. | ||
In addition to the cubic peaks observed in the out-of-plane curves in Fig. 4, there is a drastic increase in the intensity of defect scattering with increasing ibuprofen content (DMPC + 10 mol% ibuprofen is shown in Fig. 6(b)), indicating an increase of membranes, which have a random orientation with respect to the perpendicular z-axis. While cubic peaks were observed in the specular out-of-plane scans, no diffuse cubic signals are visible in the 2-dimensional data at this ibuprofen concentration, most likely because the volume fraction of the cubic phase is still small. The pattern at 10 mol% ibuprofen is indicative of a coexistence of lamellar and cubic phases.
A distinct cubic peak pattern is observed at 20 mol% ibuprofen in Fig. 6(c). The positions of the broad powder-rings agree with cubic peaks observed in reflectivity measurements: the [211], [411], and [422] peaks are observed corresponding to a cubic phase (see Fig. 4(b)). The faint [110] and [220] peaks observed in out-of-plane curves could not be resolved from the more diffuse in-plane scattering.
2.3 The interaction of ibuprofen with membranes containing cholesterol
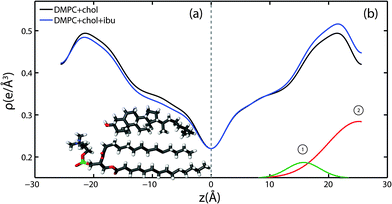
Because ibuprofen molecules were found to partition in pure lipid bilayers, DMPC membranes with cholesterol concentrations of 20 mol% and between 0 mol% to 20 mol% ibuprofen were prepared to study a potential interaction between cholesterol and ibuprofen. Out-of-plane diffraction scans for DMPC + 20 mol% cholesterol, DMPC + 20 mol% cholesterol + 5 mol% ibuprofen and DMPC + 20 mol% cholesterol + 20 mol% ibuprofen are plotted in Fig. 7. The diffraction patterns could all be indexed by lamellar phases. Electron density profiles for 0 mol% and 5 mol% ibuprofen were used to determine the position of the ibuprofen molecule in cholesterol-containing DMPC membranes and are shown in Fig. 8(a). The curve containing ibuprofen in Fig. 8(b) was scaled to represent a DMPC + 20 mol% cholesterol bilayer with 5 mol% ibuprofen embedded, as in Section 2.2. The difference between this scaled curve and the curve without ibuprofen was used to locate ibuprofen in membranes with cholesterol. Note that for membranes with cholesterol, when modelling the electronic distribution of ibuprofen for fitting to the difference curve, each atom is modelled by a Gaussian distribution with a width of 2 Å, as opposed to 1 Å for membranes without cholesterol. The need for increased Gaussian blurring is most likely a consequence of increased molecular disorder with the addition of cholesterol to gel phase membranes.13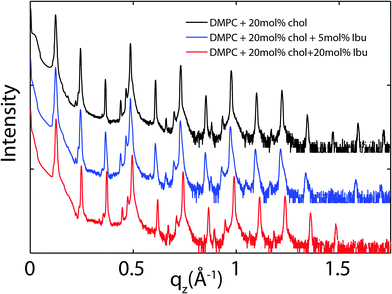 | ||
| Fig. 7 Out-of-plane diffraction for bilayers prepared with 20 mol% cholesterol and ibuprofen concentrations of: (a) 0 mol%, (b) 5 mol%, (c) 20 mol%. | ||
Two Gaussian distributions, centred at z = 15 Å and at 26 Å, were found to well describe the difference in electron density and were modelled as membrane embedded states for ibuprofen. The location of these states is in excellent agreement with the head group states observed in bilayers without ibuprofen in Section 2.2. The peak at z = 15 Å is best described by an ibuprofen molecule tilted by 90° ± 1° relative to the bilayer normal, as depicted in the electron distribution calculations in Fig. 3(b). The peak at z = 26 Å describes an ibuprofen molecule oriented parallel with the z-axis, and embedded between bilayers (tilt of 0° ± 1°), similar to the bilayer spanning state observed in membranes without cholesterol. Note that the two membrane electron density profiles in Fig. 8(b) coincide in the tail group region, suggesting that ibuprofen does not occupy this region in the presence of cholesterol. By comparing the integrated intensity of the corresponding Gaussian peaks, the relative occupations of the states at z = 15 Å and z = 26 Å are 14% and 86%, respectively.
3 Discussion and conclusions
Structural parameters, such as the lamellar spacing, dz, the cubic spacing and the area per lipid, AL, were determined for all samples and are listed in Table 2. Ibuprofen was found to not change dz and AL in gel DMPC bilayers for the concentrations used and within the resolution of this experiment. Addition of 20 mol% cholesterol led to an increase in lipid area and a decrease of lamellar spacing, as reported previously for gel phase bilayers.13 The presence of 20 mol% cholesterol was found to suppress the formation of a cubic phases when up to 20 mol% ibuprofen was incorporated as well.| DMPC (mol%) | Ibuprofen (mol%) | Cholesterol (mol%) | d z (Å) | Cubic spacing (Å) | A L (Å2) |
|---|---|---|---|---|---|
| 1 | 0 | 0 | 55.1 | 40.84 | |
| 2 | 2 | 0 | 55.1 | 40.84 | |
| 3 | 5 | 0 | 55.3 | 135.7 | 40.5 |
| 4 | 10 | 0 | 56 | 137 | 40.5 |
| 5 | 20 | 0 | — | 135.7 | 40.5 |
| 6 | 0 | 20 | 51.3 | 42.5 | |
| 7 | 5 | 20 | 51.7 | 42.5 | |
| 8 | 20 | 20 | 50.9 | 42.5 |
3.1 Partitioning of ibuprofen in saturated lipid membranes with and without cholesterol
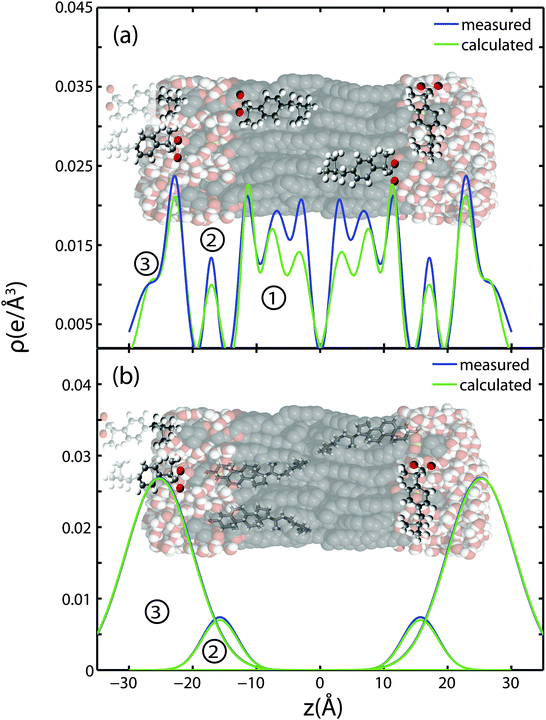
The partitioning of ibuprofen in gel phase DMPC membranes was determined using a combination of X-ray diffraction and electronic structure calculations using crystallographic ibuprofen data. The result is summarized in Fig. 9. While the peak amplitudes in the calculated profiles in part (a) appear to be systematically slightly smaller than the measured differences, peak positions and peak widths show an excellent agreement. Based on the electronic properties in Section 2.1, the orientation of the ibuprofen molecules can be determined: while 3 peaks in the electron density difference indicate a parallel orientation, a single peak is consistent with a perpendicular, 90° orientation.Three different membrane bound populations were observed when 2 mol% ibuprofen were added to the DMPC bilayers, as sketched in Fig. 9(a): ① a state in the hydrophobic membrane core, where the ibuprofen molecules align parallel to the lipid acyl chains; 56% of ibuprofen molecules were found in this state; ② 8% of ibuprofen molecules were observed at the interface between head groups-tail groups, and ③ 36% of ibuprofen molecules were found attached to the membrane head group region, situated between the lipid head groups of two bilayers. At ibuprofen concentrations greater than 5 mol% (10 and 20 mol%), disruption of the lamellar membrane phase and the formation of a cubic lyotropic phase was observed.
Based on a fit of the molecular electronic distribution of the ibuprofen molecule to the experimental data, as depicted in Fig. 3, the ibuprofen molecules in the hydrophobic membrane core align parallel to the lipid tails, with their hydrophilic head groups located in the head group region of the bilayers (population ①). The 180° position, where the oxygen groups would locate in the bilayer centre, was found to be less favourable with a χ2 value of 6.33 × 10⁴, as compared to χ2 = 4.28 × 10⁴ for the 0° case. The locations of the ibuprofen molecules are consistent with previous studies, where ibuprofen was reported to associate with PC lipids.3,27 Based on electrostatic considerations, the hydrophilic head of the ibuprofen is likely to locate in the head group region of the bilayers.19,28 Population ③ corresponds to a state, where the ibuprofen molecule appears to be partially embedded in the head groups of two lipid bilayers, with the hydroxyl group in one bilayer and the terminal methyl groups in another. This membrane-spanning state of ibuprofen is likely a consequence of the stacked bilayers used for the diffraction experiments.
Only two populations of ibuprofen molecules were observed in the presence of cholesterol, as depicted in Fig. 9(b). 14% of the ibuprofen molecules were found to occupy a state at the head group-tail group interface (population ②), while 86% of the molecules were found in the space between two bilayers, attached to the head group region (population ③). While the two states are in agreement with states ② and ③ observed with no cholesterol, no membrane embedded ibuprofen state was observed in the cholesterol-containing lipid bilayers. The presence of cholesterol in the membrane seems to suppress partitioning of ibuprofen into the tail region. As ibuprofen and cholesterol molecules compete for the same space, cholesterol seems to have a higher affinity for the lipid acyl chains.
X-ray diffraction has been used previously to determine the position of a similar NSAID, aspirin, in DMPC membranes with and without cholesterol.10,12 Aspirin was found to reside exclusively in the lipid head group region. However, there is a large hydrophobic component to the ibuprofen molecule, which would increase its affinity for the hydrophobic membrane core. Previous simulations of membrane systems incorporating ibuprofen locate the molecule in the tail group regions.21,32 In addition, Langmuir isotherm experiments have also suggested that ibuprofen may partition into the head group regions of lipid monolayers.33
Our results agree qualitatively with other reports. Simulations by Khajeh et al. report that the relative position of ibuprofen shifts towards the head groups in DMPC membranes containing 25 mol% cholesterol.32 Additional studies have suggested that drug–membrane interactions are significantly influenced by the presence of cholesterol.34,35 Our experiments present experimental evidence that cholesterol influences the position of ibuprofen in the membrane and, as will be described below, also suppresses the cubic phase induced by ibuprofen.
3.2 The suppression of cubic phases by cholesterol
Inverse (type II) phases, such as inverse cubic or inverse-hexagonal phases, are frequently observed in amphiphile–water systems, including systems with lipids, surfactants, and block co-polymers.36–38 A lamellar to cubic phase transition may be induced in membranes by temperature or pressure jumps in systems containing lipids with negative curvature.39,40 Alternatively, inverse phases can be induced by the addition of a largely hydrophobic co-surfactant.15,41,42 The fingerprint of a lamellar to cubic phase transition is the appearance of Bragg peaks in diffraction experiments, which require 3-fold symmetry to properly index.43Oriented membranes with ibuprofen concentrations less than 5 mol% formed lamellar phases, while samples with concentrations greater than 5 mol% could not be indexed by a single 1-dimensional lamellar phase and required a 3-dimensional cubic phase to index all peaks. The observed Bragg peaks for all samples in the cubic phase are consistent with either Im3m or Pn3m space groups, which are frequently observed in membrane systems.36,43,44 The [111] peak, which we did not observe, is systematically absent for Im3m but not Pn3m, suggesting Im3m is the best candidate. Another frequently observed cubic phase, with space group Ia3d, did not describe the peaks as the [110] reflection (absent for Ia3d) was observed.44,45
In membranes prepared on a solid substrate, where the lamellar phase is oriented, Bragg scattering from the membrane stack is observed solely along the out-of-plane axis, qz. However, the formation of 3-dimensional cubic phases leads to the appearance of off-specular scattering. Typically, cubic phases form as grains with random orientation, resulting in powder scattering, although oriented cubic phases have been prepared.46 Two-dimensional measurements of reciprocal space were collected to observe off-specular scattering in the presence of ibuprofen and are depicted in Fig. 6. The maps highlight the monotonic increase in powder scattering with increasing ibuprofen concentration. This suggests that increasing ibuprofen leads to cubic phases with grains at random orientation.
While specular peaks can unambiguously be indexed by cubic phases for ibuprofen concentrations greater than 5 mol%, we note that a subset of those peaks may be indexed by a lamellar phase with bilayer spacing in close agreement with samples displaying a pure lamellar phase. The [211] plane of cubic phases is often observed to be epitaxially related to a bilayer spacing in systems with a lamellar to cubic transition.39,44,47Fig. 4(b) demonstrates how the observed peaks are indexed by either a cubic phase, or a cubic phase and a lamellar phase. The experiments, therefore, do not rule out the possibility of a lamellar phase coexisting with the cubic phase. From the 2-dimensional diffraction data in Fig. 6 it seems that the formation of cubic phases is accompanied by the a distortion of the lipid bilayers phase and the occurrence of bilayers not parallel to the z-axis.
There is evidence that the impact of certain drugs on the lipid membrane is dependent on membrane composition. For example, negatively charged lipids have been shown to accelerate the binding of the antimicrobial peptide Lacticin Q.48 In addition, the anti-cancer drug Taxol has a different impact on saturated model membranes and unsaturated membranes.49 In a recent paper by Khajeh et al., molecular dynamics (MD) simulations were performed on membranes with cholesterol and ibuprofen32 to report that the permeation of ibuprofen across the membrane is decreased by an increased stiffness of the membrane caused by cholesterol.
An increase in chain rigidity and decrease in permeability with the inclusion of cholesterol could explain the reduced penetration depth of Ibuprofen into the membrane.32,50 In addition, a change in the position of ibuprofen could explain why cholesterol suppresses cubic phase formation. Cholesterol itself has not been shown to suppress cubic phases in membranes with inherently negative curvature.51 However, by causing ibuprofen to partition in the head groups as opposed to the tail groups, cholesterol may prevent the negative curvature or decrease in bending modulus induced by ibuprofen. Our results demonstrate how a membrane constituent, such as cholesterol, can influence the membrane impact of a drug, such as ibuprofen, by changing the partitioning of the drug. Cholesterol can, therefore, act as a protective agent, by inhibiting cubic phases even when ibuprofen is present in high concentration.
4 Materials and methods
4.1 Preparation of the multi-lamellar membranes
Highly oriented, multi-lamellar membranes were prepared on polished 2 × 2 cm2 silicon wafers. The wafers were first pre-treated by sonication in dichloromethane (DCM) at 310 K for 25 minutes to remove all organic contamination and create a hydrophobic substrate. After removal from the DCM post-sonication, each wafer was thoroughly rinsed three times by alternating with ∼50 mL of ultra pure water and methanol.1,2-Dimysteroyl-sn-glycero-3-phosphocholine (DMPC) and cholesterol were obtained from Avanti Polar Lipids and individually dissolved in 1![[thin space (1/6-em)]](https://www.rsc.org/images/entities/char_2009.gif) :
:![[thin space (1/6-em)]](https://www.rsc.org/images/entities/char_2009.gif) 1 mixtures of chloroform and tri-fluoro-ethanol (TFE). Ibuprofen (Sigma-Aldrich) was also dissolved in a mixture of 1
1 mixtures of chloroform and tri-fluoro-ethanol (TFE). Ibuprofen (Sigma-Aldrich) was also dissolved in a mixture of 1![[thin space (1/6-em)]](https://www.rsc.org/images/entities/char_2009.gif) :
:![[thin space (1/6-em)]](https://www.rsc.org/images/entities/char_2009.gif) 1 chloroform and TFE. The DMPC, cholesterol and ibuprofen solutions were then mixed in the appropriate ratios to achieve the desired membrane compositions for the experiment. All samples prepared for this study are listed in Table 2. Molecular representations of the components are depicted in Fig. 1(a).
1 chloroform and TFE. The DMPC, cholesterol and ibuprofen solutions were then mixed in the appropriate ratios to achieve the desired membrane compositions for the experiment. All samples prepared for this study are listed in Table 2. Molecular representations of the components are depicted in Fig. 1(a).
A tilting incubator was heated to 313 K and the lipid solutions placed inside to equilibrate. 200 μL of lipid solution was deposited on each wafer and the solvent was then allowed to slowly evaporate for ∼10 minutes while being gently rocked, such that the lipid solution spread evenly on the wafers. After drying, the samples were placed in vacuum at 313 K for 12 hours to remove all traces of solvent. Samples were then placed in a sealed container containing an open vial of pure water and allowed to equilibrate to 293 K. The temperature was then slowly increased to 303 K over a period of 24 hours. This procedure results in highly oriented, multi-lamellar membrane stacks an a uniform coverage of the silicon substrates. About 3000 highly oriented stacked membranes with a total thickness of ∼10 µm are produced using this protocol. The high sample quality and high degree of order is a prerequisite to determine in-plane and out-of-plane structure of the membranes separately, but simultaneously.
4.2 X-Ray scattering experiment
Out-of-plane and in-plane X-ray scattering data was obtained using the Biological Large Angle Diffraction Experiment (BLADE) in the Laboratory for Membrane and Protein Dynamics at McMaster University. BLADE uses a 9 kW (45 kV, 200 mA) CuK-α Rigaku Smartlab rotating anode at a wavelength of 1.5418 Å. Both source and detector are mounted on moveable arms such that the membranes stay horizontal during measurements. Focussing, multi layer optics provide a high intensity parallel beam with monochromatic X-ray intensities up to 1010 counts per (s mm2). This beam geometry provides optimal illumination of the membrane samples to maximize the scattered signal. By using highly-oriented stacks, the in-plane (q||) and out-of-plane (qz) structure of the membranes could be determined independently. A sketch of the scattering geometry is depicted in Fig. 1(b). Full 2-dimensional reciprocal space maps are shown in Fig. 2.The X-ray scattering experiments determine three pieces of information relevant to molecular structure of the membranes. Firstly, out-of-plane diffraction scans allow for the identification of the phase of the membranes (lamellar or cubic) and also permit the reconstruction of electron density profiles (for lamellar samples). Electron density profiles were used to determine the position of the molecular constituents. Secondly, in-plane scattering measurements at high q|| allow for the organization of the lipid molecules in the plane of the membrane to be determined. The area per lipid may be determined from the in-plane structure, as detailed in Barrett et al.10 Thirdly, scans performed at low q|| and low qz can be used to measure the degree of orientation within the samples.
The 2-dimensional X-ray data in Fig. 2 show well-defined peaks along the q||-axis, which allow the determination of the lateral membrane structure. Several correlation peaks were observed in the in-plane data for ibuprofen concentrations of less than 2 mol%, and were well fit by Lorentzian peak profiles. The intensity has a distinct rod-like shape, typical for a 2-dimensional system. Membranes containing more than 2 mol% ibuprofen showed one broad Lorentzian peak, centered at ∼1.5 Å−1 due to the organization of the lipid tails in the hydrophobic membrane core. The area per lipid molecule can be determined from the in-plane diffraction data, when assuming that the lipid tails form a densely packed structure with hexagonal symmetry (planar group p6), as reported from, e.g., neutron diffraction.26 In the absence of fluctuations (in gel state lipid bilayers), the area per lipid molecule can be determined from the position of the in-plane Bragg peak at qT to  .10,13,52 The distance between two acyl tails is determined to be
  , with the area per lipid simplified to
  , as listed in Table 2. The area per lipid for the pure DMPC and DMPC + 2 mol% ibuprofen samples, which show a highly organized lateral membrane structure with additional in-plane Bragg peaks in Fig. 2, were determined from the lattice parameters of the corresponding orthogonal tail lattice.
Structural parameters measured using the diffraction measurements, such as dz spacing and AL, for all samples are provided in Table 2.
4.3 Out-of-plane structure and electron densities
The out-of-plane structure of the membranes was determined using out-of-plane X-ray diffraction. The membrane electron density, ρ(z), is approximated by a 1-dimensional Fourier analysis: | (1) |
 | (2) |
The calculated electron densities, ρ(z), which are initially on an arbitrary scale, were then transformed to an absolute scale. The curves were vertically shifted to fulfil the condition ρ(0) = 0.22 e−/Å−3 (the electron density of a CH3 group) in the centre of a bilayer. The curves were then scaled until the total number of electrons  across a membrane leaflet agrees with the total number of electrons expected based on the sample composition, with the addition of 7 hydration water molecules, in agreement with.16,53
The dz-spacing between two neighbouring membranes in the stack was determined from the distance between the Bragg reflections (dz = 2π/Δqz) along the out-of-plane axis, qz. Up to a peak order of 12 was observed from DMPC membranes, and up to 14 for DMPC membranes with cholesterol. Note that not all diffraction orders are necessarily observed for the different samples as the scattering intensity depends on the form factor of the bilayers.
Acknowledgements
This research was funded by the Natural Sciences and Engineering Research Council (NSERC) of Canada, the National Research Council (NRC), the Canada Foundation for Innovation (CFI), and the Ontario Ministry of Economic Development and Innovation. R.J.A. is the recipient of an Ontario Graduate Scholarship, L.T. is the recipient of a Canada Graduate Scholarship, M.C.R. is the recipient of an Early Researcher Award from the Province of Ontario.References
- C. Pereira-Leite, C. Nunes and S. Reis, Interaction of nonsteroidal anti-inflammatory drugs with membranes: In vitro assessment and relevance for their biological actions, Prog. Lipid Res., 2013, 52, 571–584 CrossRef CAS PubMed.
- J. Seydel and M. Wiese, Drug-Membrane Interactions, Wiley-VCH, Germany, 2002 Search PubMed.
- L. M. Lichtenberger, Y. Zhou, V. Jayaraman, J. R. Doyen and R. G. O'Neil, et al., Insight into nsaid-induced membrane alterations, pathogenesis and therapeutics: characterization of interaction of nsaids with phosphatidylcholine, BBA-MOL CELL BIOL L, 2012, 1821, 994–1002 CAS.
- D. Goldstein, The effects of drugs on membrane fluidity, Annu. Rev. Pharmacol. Toxicol, 1984, 24, 43–64 CrossRef CAS PubMed.
- J. N. G. Frydman, A. S. Fonseca, V. C. Rocha, M. O. Benarroz and G. S. Rocha, et al., Acetylsalicylic acid and morphology of red blood cells, Braz. Arch. Biol. Technol., 2010, 53, 575–582 CrossRef CAS PubMed.
- Y. Zhou, K. J. Cho, S. J. Plowman and J. F. Hancock, Nonsteroidal anti-inflammatory drugs alter the spatiotemporal organization of ras proteins on the plasma membrane, J. Biol. Chem., 2012, 287, 16586–16595 CrossRef CAS PubMed.
- Y. Zhou, S. J. Plowman, L. M. Lichtenberger and J. F. Hancock, The anti-inflammatory drug indomethacin alters nanoclustering in synthetic and cell plasma membranes, J. Biol. Chem., 2010, 285, 35188–35195 CrossRef CAS PubMed.
- M. C. Rheinstädter, K. Schmalzl, K. Wood and D. Strauch, Protein-protein interaction in purple membrane, Phys. Rev. Lett., 2009, 103, 128104 CrossRef.
- C. L. Armstrong, E. Sandqvist and M. C. Rheinstädter, Protein-protein interactions in membranes, Protein Pept. Lett., 2011, 18, 344–353 CrossRef CAS.
- M. Barrett, S. Zheng, G. Roshankar, R. Alsop and R. Belanger, et al., Interaction of aspirin (acetylsalicylic acid) with lipid membranes, PLoS One, 2012, 7, e34357 CAS.
- M. Suwalsky, J. Belmar, F. Villena, M. J. Gallardo and M. Jemiola-Rzeminska, et al., Acetylsalicylic acid (aspirin) and salicylic acid interaction with the human erythrocyte membrane bilayer induce in vitro changes in the morphology of erythrocytes, Arch. Biochem. Biophys., 2013, 539, 9–19 CrossRef CAS PubMed.
- R. J. Alsop, M. A. Barrett, S. Zheng, H. Dies and M. C. Rheinstädter, Acetylsalicylic acid (asa) increases the solubility of cholesterol when incorporated in lipid membranes, Soft Matter, 2014, 10, 4275–4286 RSC.
- M. Barrett, S. Zheng, L. Toppozini, R. Alsop and H. Dies, et al., Solubility of cholesterol in lipid membranes and the formation of immiscible cholesterol plaques at high cholesterol concentrations, Soft Matter, 2013, 9, 9342–9351 RSC.
- R. J. Alsop, L. Toppozini, D. Marquardt, N. Kučerka, T. A. Harroun and M. C. Rheinstädter, Aspirin inhibits formation of cholesterol rafts in fluid lipid membranes, Biochim. Biophys. Acta, Biomembr., 2015, 1848, 805–812 CrossRef CAS PubMed.
- I. Koltover, T. Salditt, J. O. Rädler and C. R. Safinya, An inverted hexagonal phase of cationic liposome-dna complexes related to dna release and delivery, Science, 1998, 281, 78–81 CrossRef CAS.
- H. Dies, L. Toppozini and M. C. Rheinstädter, The interaction between amyloid-β peptides and anionic lipid membranes containing cholesterol and melatonin, PLoS One, 2014, 9, e99124 Search PubMed.
- N. M. Davies, Clinical pharmacokinetics of ibuprofen, Clin. Pharmacokinet., 1998, 34, 101–154 CrossRef CAS PubMed.
- L. H. Rome and W. Lands, Structural requirements for time-dependent inhibition of prostaglandin biosynthesis by anti-inflammatory drugs, Proc. Natl. Acad. Sci. U. S. A., 1975, 72, 4863–4865 CrossRef CAS.
- M. B. Boggara and R. Krishnamoorti, Small-angle neutron scattering studies of phospholipid- nsaid adducts, Langmuir, 2009, 26, 5734–5745 CrossRef PubMed.
- L. Du, X. Liu, W. Huang and E. Wang, A study on the interaction between ibuprofen and bilayer lipid membrane, Electrochim. Acta, 2006, 51, 5754–5760 CrossRef CAS PubMed.
- M. B. Boggara, A. Faraone and R. Krishnamoorti, Effect of ph and ibuprofen on the phospholipid bilayer bending modulus, J. Phys. Chem. B, 2010, 114, 8061–8066 CrossRef CAS PubMed.
- K. Hristova and S. H. White, Determination of the hydrocarbon core structure of fluid dioleoylphosphocholine (dopc) bilayers by x-ray diffraction using specific bromination of the double-bonds, Effect of hydration, Biophysical Journal, 1998, 74, 2419–2433 CAS.
- J. Katsaras, V. A. Raghunathan, E. J. Dufourc and J. Dufourcq, Evidence for a two-dimensional molecular lattice in subgel phase dppc bilayers, Biochemistry (Moscow), 1995, 34, 4684–4688 CrossRef CAS.
- V. A. Raghunathan and J. Katsaras, Structure of the lc′ phase in a hydrated lipid multilamellar system, Phys. Rev. Lett., 1995, 74, 4456–4459 CrossRef CAS.
- S. Tristram-Nagle, Y. Liu, J. Legleiter and J. F. Nagle, Structure of gel phase dmpc determined by x-ray diffraction, Biophys. J., 2002, 83, 3324–3335 CrossRef CAS.
- C. L. Armstrong, D. Marquardt, H. Dies, N. Kučerka, Z. Yamani, T. A. Harroun, J. Katsaras, A.-C. Shi and M. C. Rheinstädter, et al., The observation of highly ordered domains in membranes with cholesterol, PLoS One, 2013, 8, e66162 CAS.
- F. Barbato, M. I. La Rotonda and F. Quaglia, Interactions of nonsteroidal antiinflammatory drugs with phospholipids: comparison between octanol/buffer partition coefficients and chromatographic indexes on immobilized artificial membranes, J. Pharm. Sci., 1997, 86, 225–229 CrossRef CAS PubMed.
- H. C. Gaede and K. Gawrisch, Lateral diffusion rates of lipid, water, and a hydrophobic drug in a multilamellar liposome, Biophys. J., 2003, 85, 1734–1740 CrossRef CAS.
- N. Shankland, C. Wilson, A. Florence and P. Cox, Refinement of ibuprofen at 100k by single-crystal pulsed neutron diffraction, Acta Crystallogr., Sect. C: Cryst. Struct. Commun., 1997, 53, 951–954 Search PubMed.
- H. Dies, B. Cheung, J. Tang and M. C. Rheinstädter, The organization of melatonin in lipid membranes, Biochim. Biophys. Acta, Biomembr., 2015, 1848, 1032–1040 CrossRef CAS PubMed.
- C. L. Armstrong, W. Häußler, T. Seydel, J. Katsaras and M. C. Rheinstädter, Nanosecond lipid dynamics in membranes containing cholesterol, Soft Matter, 2014, 10, 2600–2611 RSC.
- A. Khajeh and H. Modarress, The influence of cholesterol on interactions and dynamics of ibuprofen in a lipid bilayer, Biochim. Biophy. Acta, Biomembr., 2014, 1838, 2431–2438 CrossRef CAS PubMed.
- V. P. Geraldo, F. J. Pavinatto, T. M. Nobre, L. Caseli and O. N. Oliveira, Langmuir films containing ibuprofen and phospholipids, Chem. Phys. Lett., 2013, 559, 99–106 CrossRef CAS PubMed.
- W. Kopeć, J. Telenius and H. Khandelia, Molecular dynamics simulations of the interactions of medicinal plant extracts and drugs with lipid bilayer membranes, FEBS J., 2013, 280, 2785–2805 CrossRef PubMed.
- A. H. Hansen, K. T. Sørensen, R. Mathieu, A. Serer, L. Duelund, H. Khandelia, P. L. Hansen and A. C. Simonsen, et al., Propofol modulates the lipid phase transition and localizes near the headgroup of membranes, Chem. Phys. Lipids, 2013, 175, 84–91 CrossRef PubMed.
- G. Lindblom and L. Rilfors, Cubic phases and isotropic structures formed by membrane lipids–possible biological relevance, Biochim. Biophys. Acta, Biomembr., 1989, 988, 221–256 CrossRef CAS.
- G. Shearman, A. Tyler, N. Brooks, R. Templer, O. Ces, R. Law and J. Seddon, Ordered micellar and inverse micellar lyotropic phases, Liq. Cryst., 2010, 37, 679–694 CrossRef CAS PubMed.
- M. Morris, Directed self-assembly of block copolymers for nanocircuitry fabrication, Microelectron. Eng., 2015, 132, 207–217 CrossRef CAS PubMed.
- A. M. Squires, R. Templer, J. Seddon, J. Woenckhaus, R. Winter, S. Finet and N. Theyencheri, et al., Kinetics and mechanism of the lamellar to gyroid inverse bicontinuous cubic phase transition, Langmuir, 2002, 18, 7384–7392 CrossRef CAS.
- C. E. Conn, O. Ces, X. Mulet, S. Finet, R. Winter, J. M. Seddon and R. H. Templer, et al., Dynamics of structural transformations between lamellar and inverse bicontinuous cubic lyotropic phases, Phys. Rev. Lett., 2006, 96, 108102 CrossRef.
- G. Montalvo, R. Pons, G. Zhang, M. Dáz and M. Valiente, Structure and phase equilibria of the soybean lecithin/peg 40 monostearate/water system, Langmuir, 2013, 29, 14369–14379 CrossRef CAS PubMed.
- R. J. Gillams, T. Nylander, T. S. Plivelic, M. K. Dymond and G. S. Attard, Formation of inverse topology lyotropic phases in dioleoylphosphatidylcholine/oleic acid and dioleoylphosphatidylethanolamine/oleic acid binary mixtures, Langmuir, 2014, 30, 3337–3344 CrossRef CAS PubMed.
- N. W. Schmidt and G. C. Wong, Antimicrobial peptides and induced membrane curvature: Geometry, coordination chemistry, and molecular engineering, Curr. Opin. Solid State Mater. Sci., 2013, 17, 151–163 CrossRef CAS PubMed.
- C. V. Kulkarni, Nanostructural studies on monoelaidin–water systems at low temperatures, Langmuir, 2011, 27, 11790–11800 CrossRef CAS PubMed.
- Y. Rançon and J. Charvolin, Epitaxial relationships during phase transformations in a lyotropic liquid crystal, J. Phys. Chem., 1988, 92, 2646–2651 CrossRef.
- A. M. Squires, J. E. Hallett, C. M. Beddoes, T. S. Plivelic and A. M. Seddon, Preparation of films of a highly aligned lipid cubic phase, Langmuir, 2013, 29, 1726–1731 CrossRef CAS PubMed.
- B. Angelov, A. Angelova, U. Vainio, V. M. Garamus, S. Lesieur, R. Willumeit and P. Couvreur, et al., Long-living intermediates during a lamellar to a diamond-cubic lipid phase transition: a small-angle x-ray scattering investigation, Langmuir, 2009, 25, 3734–3742 CrossRef CAS PubMed.
- F. Yoneyama, K. Shioya, T. Zendo, J. Nakayama and K. Sonomoto, Effect of a negatively charged lipid on membrane-lacticin q interaction and resulting pore formation, Biosci., Biotechnol., Biochem., 2010, 74, 218–221 CrossRef CAS PubMed.
- C. Bernsdorff, R. Reszka and R. Winter, Interaction of the anticancer agent taxol™ (paclitaxel) with phospholipid bilayers, J. Biomed. Mater. Res., 1999, 46, 141–149 CrossRef CAS.
- K. E. Bloch, Sterol, structure and membrane function, Crit. Rev. Biochem. Mol. Biol., 1983, 14, 47–92 CrossRef CAS.
- B. G. Tenchov, R. C. MacDonald and D. P. Siegel, Cubic phases in phosphatidylcholine-cholesterol mixtures: cholesterol as membrane “fusogen”, Biophys. J., 2006, 91, 2508–2516 CrossRef CAS PubMed.
- T. T. Mills, G. E. S. Toombes, S. Tristram-Nagle, D.-M. Smilgies, G. W. Feigenson and J. F. Nagle, et al., Order parameters and areas in fluid-phase oriented lipid membranes using wide angle X-ray scattering, Biophys. J., 2008, 95, 669–681 CrossRef CAS PubMed.
- E. Nováková, K. Giewekemeyer and T. Salditt, Structure of two-component lipid membranes on solid support: An x-ray reflectivity study, Phys. Rev. E, 2006, 74, 051911 CrossRef.
| This journal is © The Royal Society of Chemistry 2015 |

