DOI:
10.1039/C5SM00566C
(Paper)
Soft Matter, 2015,
11, 5294-5300
Humic acid adsorption onto cationic cellulose nanofibers for bioinspired removal of copper(II) and a positively charged dye†
Received
9th March 2015
, Accepted 1st June 2015
First published on 1st June 2015
Abstract
Waste pulp residues are herein exploited for the synthesis of a sorbent for humic acid (HA), which is a major water pollutant. Cellulose pulp was etherified with a quaternary ammonium salt in water thereby introducing positive charges onto the surface of the pulp fibers, and subsequently mechanically disintegrated into high surface area cellulose nanofibers (CNF). CNF with three different charge contents were produced and their adsorption capacity towards HA was investigated with UV-spectrophotometry, quartz crystal microbalance with dissipation, and ζ-potential measurements. Substantial coverage of the CNF surface with HA in a wide pH range led to a reversal of the positive ζ-potentials of CNF suspensions. The HA adsorption capacity and the kinetics of HA uptake were found to be promoted by both acidic pH conditions and the surface charge content of CNF. It is suggested that HA adsorption onto CNF depends on electrostatic interactions between the two components, as well as on the conformation of HA. At pH ∼ 6, up to 310 mg g−1 of HA were adsorbed by the functionalized CNF, a substantially higher capacity than that of previously reported HA sorbents in the literature. It is further shown that CNF–HA complexes could be freeze-dried into “soil-mimicking” porous foams having good capacity to capture Cu(II) ions and positive dyes from contaminated water. Thus, the most abundant natural polymer, i.e., cellulose could effectively bind the most abundant natural organic matter for environmental remediation purpose.
Introduction
Humic substances (HS) are major components of the natural organic matter (NOM) and some of the most abundant materials on earth. They form during the decomposition of plant and animal biomass in natural systems. HS are mainly composed of humic acid (HA), fulvic acid and humin, and are largely present in soil, water and geological organic deposits.1–5 The presence of HA in natural waters causes undesirable color and taste, and may also cause various environmental and health problems. Indeed, HA in natural waters serves as food for bacterial growth in water distribution systems, and may also, when it is not immobilized, bind heavy metals, biocides, and viruses to yield high concentrations of these substances and enhance their transport in water. Moreover, during water treatment operations, HA reacts with disinfectants (e.g., chlorine) to form carcinogenic organic compounds.6–8 It is therefore essential to decrease the concentration of HA in drinking and other process waters.
Adsorption of HA by different particles including nanozero valent iron,9 nanosized inorganic oxides,10–12 graphene oxide,13 clay minerals,14 chitosan beads,15 polyacrylonitrile fibers,16 as well as its interaction with various model surfaces17 has been widely investigated. Especially, the use of natural and widely abundant resources for HA adsorption is attractive since it reduces the environmental impact of this operation. In this regard, cellulose seems to be a suitable substrate. Cellulose is a natural and environmentally benign biopolymer widely available in the biomass. It presents chemical functionalization versatility due to numerous hydroxyl groups on its backbone,18 and can be mechanically disintegrated from the biomass into high surface area and interconnected cellulose nanofibers (CNF).19–26 In this context, the use of CNF as biobased and renewable sorbent for the removal of HA seems to represent a viable alternative to already existing fossil-fuel based or inorganic materials.
Nevertheless, cellulose nanofibers display negative charges on their surface and cannot be directly used as sorbent for the removal of HA. A suitable functionalization of CNF with positively charged entities is necessary in order to bind negatively charged HA at a convenient pH. The functionalization of CNF with epoxypropyl trimethyl ammonium chloride (EPTMAC) gives rise to cellulose nanofibers decorated with quaternary ammoniums groups on their surface and seems therefore to represent a promising route for the subsequent adsorption of HA. The main advantage of this functionalization pathway stems from the presence of positive charges on CNF in a wide pH range where quaternary ammonium entities are stable via ionic interactions.27 Moreover, this functionalization route has other advantages as it is carried out in water under mild conditions and offers the economical possibility for in situ synthesis of the EPTMAC reagent in the reaction media in presence of cellulose, as reported elsewhere.27–30 EPTMAC modified cellulose nanocrystals28 and CNF27,29 have been reported and the effective adsorption of anionic dyes onto CNF was demonstrated.29
In the present work, cationic CNF with different contents of quaternary ammonium functions have been prepared via EPTMAC modification of waste pulp residues followed by mechanical disintegration. The effects of cationic charge content and pH onto the adsorption of HA by the functionalized nanofibers have been investigated via UV-spectrophotometry. The surface charges of the CNF and CNF–HA complexes have been analyzed in a wide pH range by ζ-potential measurements. Quartz crystal microbalance with dissipation has been used to assess the in situ adsorption process of HA onto CNF in the hydrated state with a particular attention to the kinetics of HA adsorption onto CNF. It is consequently shown that freeze-dried CNF–HA complexes could function as adsorbents for the bioinspired removal of copper(II) ions and positive dyes from contaminated water akin to the adsorption of contaminants onto humic acid immobilized into minerals in the soil.31,32 The substantial adsorption of HA onto the cationic CNF, combined with the heavy metal ions and dyes removal capability of CNF–HA complexes makes CNF a versatile substrate for water purification.
Experimental
Pulp residue, a waste product from pulp and paper industry also called “fiber sludge”,33 with a cellulose and hemicellulose content of 95% and 4.75%, respectively, was kindly provided by Processum AB, Sweden. 2,3-epoxypropyl trimethyl ammonium chloride (EPTMAC), Aldrich humic acid and CuSO4 (99% purity) were purchased from Sigma Aldrich. Crystal violet (Buchs AG, Switzerland) and methylene blue hydrate (>97%; Fluka) were used as positively charged dyes.
Cationic CNF preparation
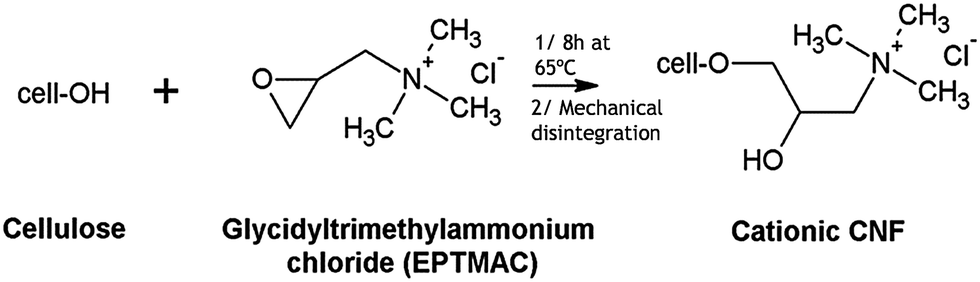
Cationic CNF was prepared according to a previously reported method (Scheme 1).29 Mechanically beaten pulp residue was mixed overnight with an aqueous solution of sodium hydroxide (NaOH) to obtain a suspension with final concentrations of 5 wt% and 2.5 wt% for NaOH and the pulp, respectively. EPTMAC was added to the suspension and the reaction was carried out at 65 °C for 8 hours under stirring. Three quantities of EPTMAC have been envisaged corresponding to molar ratios between hydroxyl groups of cellulose and ammonium functions of 1![[thin space (1/6-em)]](https://www.rsc.org/images/entities/char_2009.gif) :1, 1:3 and 1:10. The reaction mixture was then neutralized with hydrochloric acid, filtered and washed thoroughly with deionized water. This chemically treated pulp was dispersed in water at a concentration of ca. 0.3 wt%, mixed for 10 min in an ultra-turrax (IKA T25), and disintegrated inside a microfluidizer system (M-110EH, Microfluidics Ind., Newton, MA) at a chamber pressure of up to 1200 bars. Cationic cellulose nanofibers obtained are denoted CNF-N, with N ranging from 1 to 3 and referring to the increase in the positive charges content. Non-modified nanofibers disintegrated from the pulp residue are taken as reference and are denoted CNF-0.
:1, 1:3 and 1:10. The reaction mixture was then neutralized with hydrochloric acid, filtered and washed thoroughly with deionized water. This chemically treated pulp was dispersed in water at a concentration of ca. 0.3 wt%, mixed for 10 min in an ultra-turrax (IKA T25), and disintegrated inside a microfluidizer system (M-110EH, Microfluidics Ind., Newton, MA) at a chamber pressure of up to 1200 bars. Cationic cellulose nanofibers obtained are denoted CNF-N, with N ranging from 1 to 3 and referring to the increase in the positive charges content. Non-modified nanofibers disintegrated from the pulp residue are taken as reference and are denoted CNF-0.
 |
| | Scheme 1 The reaction between hydroxyl groups of cellulose and EPTMAC and subsequent mechanical disintegration lead to cationic CNF. | |
Morphological, physical and chemical characterizations
SEM micrographs of cationic CNF were obtained by placing the suspension at 0.1 wt% on a specimen holder, coating it with a 7.5 nm platinum layer (BAL-TEC MED 020 Modular High Vacuum Coating Systems, BAL-TEC AG, Liechtenstein) in Ar as a carrier gas at 0.05 mbar before observing it using a FEI Nova NanoSEM 230 instrument (FEI, Hillsboro, Oregon, USA). SEM micrograph of the CNF–HA foam was taken on a cross-section of the foam. Specific surface area of CNF was determined according to the Brunauer–Emmett–Teller (BET) method by nitrogen physisorption on a surface area and pore size analyzer (Coulter SA3100) by subjecting the CNF suspension beforehand to supercritical drying as reported elsewhere.23 Infrared spectra were recorded using a FTS 6.000 spectrometer (Portmann Instruments AG, Biel-Benken, Switzerland). All spectra were recorded between 4000 and 600 cm−1 with a resolution of 4 cm−1 and 32 scans. The number of trimethylammonium chloride groups on the CNF was estimated by conductometric titration of chloride ions assuming the presence of one chloride counter ion per trimethylammonium group.28ζ-potential measurements were performed on solutions at ∼0.1 wt% using a Zetasizer NanoZS instrument (Malvern, UK).
Preparation of humic acid and its adsorption onto CNF
HA was dissolved in water at a concentration of 1 g L−1, then filtered through a 0.65 μm membrane (DVPP, millipore) to remove undissolved particles. The concentration of the HA was determined by dry content measurement of the filtered solution and confirmed by weighing the HA retentate on top of the membrane and subtracting it to the initial amount of HA used. Thereafter, 1 mL of the CNF suspension at a concentration of 0.2–0.4 wt% was added to different amounts of HA solution in an Eppendorf tube and the volume was completed to 45 mL and shaken for 2 days at 150 min−1 (IKA HS 260). The mixtures had a pH of 6 ± 0.2. Experiments at pH ∼ 4 or pH ∼ 11 were performed by adding to the CNF–HA mixtures 100 μL of 0.1 M HCl or 1 mL of 0.1 M NaOH, respectively, followed by shaking for two days. The mixtures were subsequently centrifuged at 4500g for 20 min, thus bringing the CNF with adsorbed HA to the bottom of the tube. Any remaining CNF in the supernatant was filtered over a 0.65 μm membrane. Free HA concentrations were measured with a UV-vis spectrophotometer (Spectronic Camspec Ltd., UK) at 254 nm by constructing beforehand calibration curves at different pH values as the UV-vis absorbance of HA is slightly pH-dependent.
QCM-D
QCM-D experiments were conducted on a Q-sense E4 instrument at a constant volumetric flow rate of 50 μL min−1 using a peristaltic pump. Adsorption experiment consisted of five consecutive steps: (i) equilibration of the mounted sensors to pH-buffered solutions to obtain stable baseline readings; (ii) introduction and continuous delivery of CNF solutions (100 μg mL−1) over the sensors; (iii) rinsing with buffer solution; (iv) introduction and continuous delivery of HA solutions (30 μg mL−1); (v) rinsing with buffer solution. All steps were conducted at the same pH and ionic strength.
Freeze dried CNF–HA foam and its removal of Cu(II) and crystal violet dye
150 mg (dry content) of CNF-1 was mixed with HA solution (75 mg dry content) and the total volume was 250 mL. The pH of the mixture was ∼6 and the mixing was performed for 2 days. Thereafter, the HA adsorbed CNF were washed with deionized water followed by centrifugation at 4500g for 20 min, removal of the supernatant, freezing of the CNF–HA suspension in liquid nitrogen, and freeze-drying it under vacuum at ambient temperature with a Lyovac freeze-dryer (SRK system technik GMBH) yielding porous CNF–HA foam. The density of the CNF–HA foam was determined by weight and volume measurement of the foam, and its porosity was calculated by taking 1.5 and 1.66 g cm−3 as density for CNF and humic acid, respectively.20,34
To evaluate the removal capacity of the CNF–HA foam for the dyes, 20 mg of the foam was placed in an Eppendorf tube onto which 45 mL of crystal violet at a concentration of 11.1 mg L−1 was added. The tube was shaken at 150 min−1 and aliquots of the dye solution were taken at different time intervals. Their concentration was measured by UV-spectrophotometry at 590 nm wavelength by constructing calibration curves of the dye. Copper(II) uptake by the CNF–HA foam was conducted similarly by taking 50 mg of the foam, placing it in an Eppendorf tube onto which 15 mL of CuSO4 solution at 330 mg L1 was added. After shaking, concentration of Cu(II) in several aliquots was measured by UV-spectrophotometry at 606 nm wavelength by complexing the copper solution with ammonia beforehand.35,36
Results and discussion
CNF with three different positive charge contents – i.e. three molar quantities of quaternary ammonium groups – have been prepared and are denoted CNF-N where N increases with the charge content. SEM micrographs of the reference non-modified and cationic CNF in Fig. 1 show typical high aspect-ratio nanofibers forming a network structure. The BET specific surface area of CNF, as determined by N2 gas adsorption, was ∼200 m2 g−1 thus reflecting the small diameter of the nanofibers (Table 1).
 |
| | Fig. 1 SEM micrographs of non-modified CNF (CNF-0) and cationic CNF. Scale bar is 4 μm. | |
Table 1 Ammonium group content, BET specific surface area and ζ-potential of different CNF
| |
CNF-0 |
CNF-1 |
CNF-2 |
CNF-3 |
| Ammonium groups (mmol g−1) |
0 |
0.34 |
0.54 |
1.2 |
| BET surface area (m2 g−1) |
229 |
196 |
179 |
189 |
|
ζ-potential (mV) at pH 7 and 0 mM NaCl ionic strength |
−26.4 |
34.7 |
31.5 |
40.0 |
The success of the cationization reaction has been investigated by FTIR spectroscopy where a new peak/shoulder at 1480 cm−1 has been detected in the modified nanofibers and attributed to the methyl groups of the EPTMAC (ESI,† Fig. S1).29 Quantification of the ammonium groups on the nanofibers was performed by conductometric titration (ESI,† Fig. S2) and a maximum of 1.2 mmol ammonium groups per gram of CNF was reached (Table 1). Further information on the surface charge state of the CNF was obtained by ζ-potential measurements at various pH's (Fig. 2). CNF-1 was selected as cationic cellulose nanofibers for this study having the least ammonium group content. The original non-modified CNF suspension (CNF-0) displayed negative ζ-potential and pH-dependent potential values, since the fibers possessed some carboxyl groups originating mainly from the residual hemicelluloses in the pulp with a small amount attributable to cellulose oxidation during the pulping process.27ζ-potential of cationic CNF suspension (CNF-1) was positive and independent to pH variation, as expected, due to the presence of quaternary ammonium groups. ζ-potential of other cationic CNF suspensions (CNF-2 and CNF-3) at neutral pH was also positive (see Table 1). Adsorption of HA onto CNF-1 not only neutralized the positive charges but also reversed the surface charges of the CNF-1 so that CNF-1–HA complexes have a negative ζ-potential with the isoelectric point (zero ζ-potential) at low pH (pH ∼ 3). In summary, the twofold reversal of ζ-potential from negative values for CNF-0 to positive values for cationic CNF-1 and then again to negative values for CNF-1–HA complex confirms the success of the cationization reaction as well as the adsorption of HA at the surface of CNF-1.
 |
| | Fig. 2
ζ-potential as a function of pH for non-modified CNF (CNF-0), cationic CNF-1 and CNF-1–HA complex. These measures are performed at an ionic strength of 0.1 mM NaCl. | |
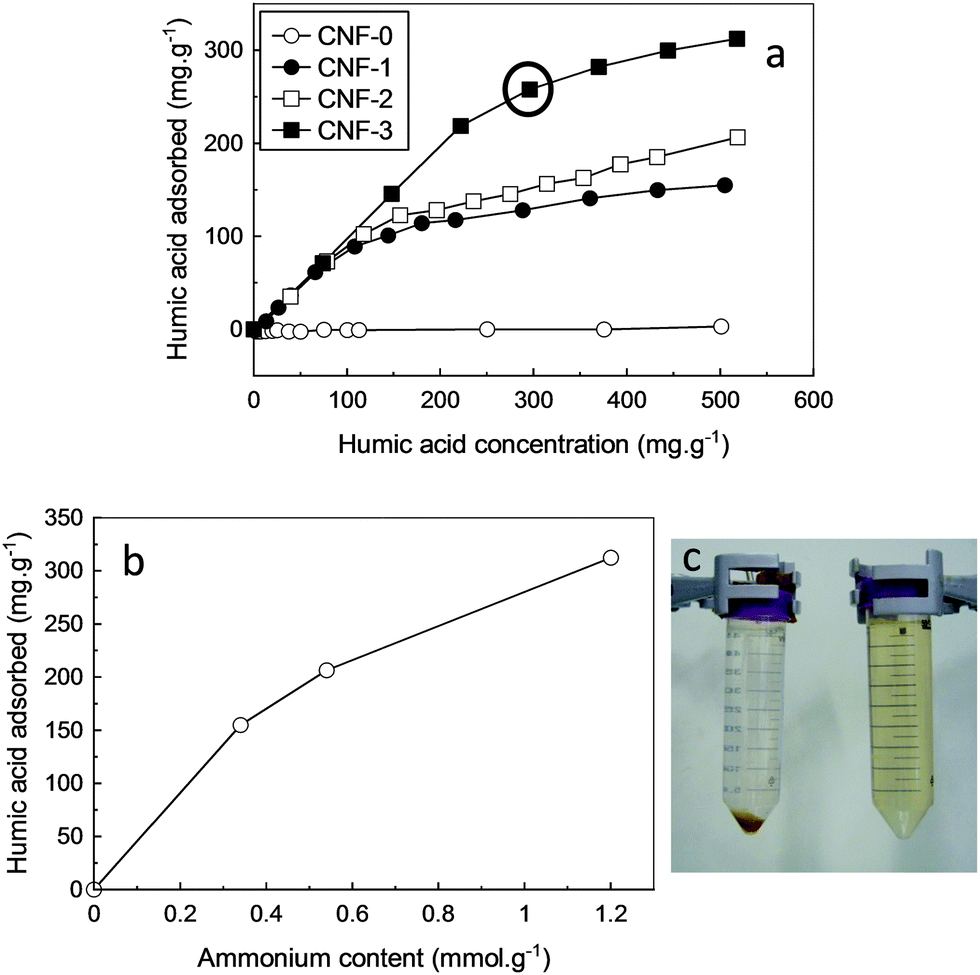
Adsorption isotherms of HA onto the modified CNF's at pH ∼ 6 are shown in Fig. 3a. At low concentrations of HA, the curve is linear and a major part of HA is adsorbed onto the CNF. Upon increasing HA concentration, the adsorption of HA tends to plateau. The adsorption process seems to be better fitted by the Langmuir than Freundlich isotherm, suggesting a monolayer adsorption process at this pH (ESI,† Fig. S3). The relationship between the charge content of CNF and the HA uptake for a concentration of HA of 500 mg g−1 is shown in Fig. 3b. Higher charge content on the surface of CNF led to higher adsorption of HA, as expected from the electrostatic interactions of the two components. HA adsorption by CNF-3 can be visually observed in Fig. 3c where the tube in left corresponds to the experimental conditions encircled in Fig. 3a. The HA solution with HA concentration of 13 mg L−1 displayed a brown color, while this color vanished in presence of quaternary ammonium modified CNF-3 at 45 mg L−1 due to substantial adsorption of HA by the nanofibers whose color becomes dark brown (see sediment at the bottom of the left tube). In the experimental conditions envisaged in this study, the maximum adsorption capacity of HA onto CNF-3 was 310 mg g−1, which is substantially higher than the capacity reported for other sorbents cited in the literature, i.e., nanoscale zerovalent iron (∼80 mg g−1),9 chitosan beads (∼150 mg g−1),15 ZnO nanoparticles (∼100 mg g−1),10 goethite and gibbsite (∼100 and 70 mg g−1, respectively).37 It should be noted however that the use of different HA types in the cited studies may results in different adsorption capacities than Aldrich HA used in the present study. The high adsorption capacity of HA reported in our work is attributed to the high specific surface area of CNF and their high cationic charge content which favor HA adsorption.
 |
| | Fig. 3 (a) Adsorption isotherms of HA onto different CNF. mg g−1 means milligram of HA adsorbed per gram of CNF. (b) Relationship between the ammonium groups content on the CNF surface and HA adsorption at HA concentration of ∼500 mg g−1. (c) Photograph showing in right a brown solution of HA at 13 mg L−1, and in left the adsorption of HA by CNF-3 (sediment) and clarity of the supernatant solution. | |
pH effects onto HA adsorption
The effects of pH onto the HA adsorption by CNF is an important parameter to investigate since it is varying between different water purification processes. Moreover, it could give an indication on the nature of the interaction between CNF and HA components. Fig. 4a shows the uptake of HA at 3 different pH values (ca. 4, 6 and 11) onto CNF-1, where a gradual increase of HA adsorbed is observed with a progressive decrease of the pH. The same trend was also observed for CNF-2 and CNF-3 where HA adsorption decreases at higher pH's. At low pH, HA is expected to display an aggregated conformation in the suspension due to its relatively low charged character and the formation of hydrogen bonds between the macromolecules,38 consequently, leading to an increase in HA thickness and therefore mass of HA adsorbed onto the CNF. Upon increasing the pH, an increase of ionization of the acid groups occurs and the charge density on the HA macromolecule rises. The HA gradually adopts a “linear” or “extended” conformation so that the thickness of the adsorbed HA layer on CNF is progressively thinner as compared with the adsorption at lower pHs, leading to a lower adsorbed mass. A scheme representing the adsorption process of HA is given in ESI,† Fig. S4. Maximum HA adsorption values have also been reported at lower pHs for other sorbents such as nanosized inorganic oxides10 and nanoscale zerovalent iron.9
 |
| | Fig. 4 Adsorption isotherms of HA onto CNF-1 at different pHs. | |
Kinetics of HA adsorption in the wet state via QCM-D
The interaction between CNF and HA in the wet state has been studied in situ by QCM-D using negatively charged silica sensors onto which we first attached cationic CNF and second HA. The frequency shift graphs due to the adsorption of CNF and HA onto the sensor are presented in ESI,† Fig. S5. The frequency shift after CNF adsorption onto the silica sensor which correlates with the wet CNF mass attached to the silica sensor was dependent on the pH and increased with the pH (ESI,† Fig. S6), which may be due to higher negative surface charges of the silica sensor at higher pH values. In the subsequent graphs in Fig. 5, we represent the normalized frequency shift due to HA adsorption to the final frequency value due to CNF adsorption onto the silica, and this is proportional to the hydrated mass of adsorbed humic acid normalized to the final hydrated mass of CNF adsorbed on the silica sensor. From the graph in Fig. 5, the kinetics of humic acid adsorption is taken as the slope of the initial part of the graph. At a pH of 6.2 (Fig. 5a), the rate of HA adsorption increased with the positive surface charge content of the nanofibers, as expected. The initial rate of HA uptake at pH 6.2 is only 3.6 × 10⁻³ min−1 for CNF-1 vs. 29 × 10−3 min−1 for CNF-2 and 49 × 10−3 min−1 for CNF-3. Furthermore, the equilibrium of HA uptake is reached earlier for CNF-3 as compared to CNF-2 and CNF-1. In Fig. 5b, a much faster uptake of HA is achieved at acidic pH. For CNF-3, the initial rate of HA uptake is 184 × 10−3 min−1 at pH 4.5 vs. 49 × 10−3 min−1 at pH 6.2 and 35 × 10−3 min−1 at pH 10. At pH 4.5, the equilibrium of HA uptake onto CNF-3 is achieved after ca. 2 minutes, while it took ca. 30 minutes at pH 6.2 and more than 120 minutes at pH 10 to reach equilibrium. These results suggest that the capacity and the kinetics of HA adsorption are proportional to each other. Higher humic acid uptake due to higher charge content or lower pH is accompanied by a faster kinetics of HA adsorption.
 |
| | Fig. 5 (a) Evolution of the normalized frequency shift due to HA adsorption at pH 6.2 for different cationic CNF. (b) Evolution of the normalized frequency shift due to HA adsorption onto CNF-3 at different pHs. The frequency shift is normalized with respect to the final frequency shift due to CNF adsorption. | |
HA functionalized CNF foam as dye and copper(II) adsorbents
In natural waters, pollutants such as heavy metal ions, biocides, nanoparticles and dyes have a strong affinity to humic acid, and this contributes to water contamination when the humic acid is not immobilized onto minerals. Accordingly in the last part of this work, we exploit the strong affinity between the quaternary ammonium functionalized CNF and HA for the preparation of porous solid foams intended for the capture of contaminants, thus mimicking the soil function where HA immobilized onto minerals is retaining contaminants. A water suspension containing CNF-1 and HA was first prepared, and subsequently freeze dried affording a highly porous foam which displayed a density of 25 kg m−3 and a porosity of 98% (see photograph of the foam in the upper left part in Fig. 6a). SEM micrograph of the foam in Fig. 6b reveals the porous nature of the foam with pore sizes of few several tens of microns, as reported elsewhere for freeze-dried foams from aqueous CNF suspensions.20,25 High porosity and large pore sizes are important for the diffusion of contaminants within the foam and their subsequent adsorption onto HA. The biobased foam was subsequently used for the removal of positively charged species in solution, such as the crystal violet (CV) and methylene blue dyes (structure of the dyes is given in ESI,† Fig. S7) as well as copper(II) metal ions. The results for the removal of CV by the foam are displayed in Fig. 6b. The initial concentration of CV in solution was 2.6 ppm and decreased with time due to its uptake by CNF–HA. After contact of the foam with the CV solution, the concentration of the CV was reduced by 55% and the intensity of the dye color gradually changed from dark to light violet upon contact time (see pictures of the solutions at different time intervals in the bottom of Fig. 6b). Similarly, methylene blue dye could be removed by the CNF–HA foam as seen by the discoloration of the solution in ESI,† Fig. S7. Finally, the ability of the CNF–HA foam to remove heavy metal ions in contaminated water was successfully investigated, as exemplified by the removal of Cu(II) ions in solution. The Cu(II) concentration decreased by 30% after a prolongated contact with the foam. The CNF–HA foam thus acts as artificial soil with removal capability for contaminants. Further studies are needed to investigate the stability of the HA adsorbed onto CNF and its leaching in various environments and shall be conducted in future work.
 |
| | Fig. 6 (a) SEM micrograph showing the porous CNF-1–HA foam. Upper left is a photograph of the foam. (b) Crystal violet (CV) concentration vs. time of contact with CNF-1–HA foam. Photograph in the bottom of the graph shows the lightning of the dye solution at different time intervals. (c) Copper(II) concentration vs. time of contact with CNF-1–HA foam. | |
Conclusion
The etherification of wood pulp fibers with EPTMAC followed by mechanical disintegration led to high surface area, ammonium-functionalized cellulose nanofibers (CNF) decorated with cationic charges at their surface. The ammonium group contents onto CNF was adjusted by modifying the EPTMAC concentration in the starting pulp suspension. Due to their positively charged character, the cationic CNF displayed a good ability to adsorb humic acid, a natural organic matter, via electrostatic interactions. The HA adsorption capacity gradually increased with the ammonium content of the nanofibers. Maximum HA adsorption of 310 mg per gram of CNF was achieved for the highest modification rate envisaged in this study (i.e., 1.2 mmol g−1), which stands amongst the highest capacities reported in the literature. This remarkable result is attributed to both the high specific surface area of the nanofibers and to their high positive charge content after cationization. The adsorption process was shown to be pH dependent. A higher adsorption capacity was observed at low pH values, which was attributed to the coiled conformation of HA in this pH range allowing a thicker HA layer to be adsorbed onto CNF. Monitoring the adsorption process of HA onto CNF via QCM-D revealed that the kinetics of HA adsorption onto CNF in the wet state was faster at low pH and for higher ammonium content on CNF, thus indicating a good correlation between the capacity and the kinetics of HA adsorption onto CNF. Finally, it is shown that the CNF with adsorbed HA can be used for the preparation of porous foams via freeze drying. These foams have a good affinity to pollutants such as positive dyes or copper ions. In summary, this study shows the effective combination of two of the most abundant natural materials, namely cellulose and HA and their subsequent exploitation as bioinspired material for the removal of contaminants from water.
Acknowledgements
Esther Strub from EMPA is thanked for assistance in SEM characterization. Michael Sander, Antonius Armanious and Michael Zumstein from the University of Zürich are thanked for their assistance in QCM-D measurements and for fruitful discussions. Dr Jiang Wei from Alfa Laval and Dr Mohamed Eita from KAUST University are thanked for their advices. This work was supported by the European project NanoSelect, FP7 Collaborative project, grant agreement no. 280519.
Notes and references
- M. W. I. Schmidt, M. S. Torn, S. Abiven, T. Dittmar, G. Guggenberger, I. A. Janssens, M. Kleber, I. Kogel-Knabner, J. Lehmann, D. A. C. Manning, P. Nannipieri, D. P. Rasse, S. Weiner and S. E. Trumbore, Nature, 2011, 478, 49–56 CrossRef CAS PubMed.
-
F. J. Stevenson, Humus chemistry, Wiley, 1994 Search PubMed.
- M. Kleber and M. G. Johnson, Adv. Agron., 2010, 106, 77–142 CAS.
- R. Sutton and G. Sposito, Environ. Sci. Technol., 2005, 39, 9009–9015 CrossRef CAS.
- B. P. Kelleher and A. J. Simpson, Environ. Sci. Technol., 2006, 40, 4605–4611 CrossRef CAS.
- H. B. Bradl, J. Colloid Interface Sci., 2004, 277, 1–18 CrossRef CAS PubMed.
- S. K. Hong and M. Elimelech, J. Membr. Sci., 1997, 132, 159–181 CrossRef CAS.
- C. T. Chiou, R. L. Malcolm, T. I. Brinton and D. E. Kile, Environ. Sci. Technol., 1986, 20, 502–508 CrossRef CAS PubMed.
- A. B. M. Giasuddin, S. R. Kanel and H. Choi, Environ. Sci. Technol., 2007, 41, 2022–2027 CrossRef CAS.
- K. Yang, D. Lin and B. Xing, Langmuir, 2009, 25, 3571–3576 CrossRef CAS PubMed.
- M. Eita, Soft Matter, 2011, 7, 7424–7430 RSC.
- M. Eita, Soft Matter, 2011, 7, 709–715 RSC.
- I. Chowdhury, M. C. Duch, N. D. Mansukhani, M. C. Hersam and D. Bouchard, Environ. Sci. Technol., 2014, 48, 9382–9390 CrossRef CAS PubMed.
- K. J. Wang and B. S. Xing, J. Environ. Qual., 2005, 34, 342–349 CrossRef CAS.
- M. Y. Chang and R. S. Juang, J. Colloid Interface Sci., 2004, 278, 18–25 CrossRef CAS PubMed.
- S. B. Deng and R. B. Bai, J. Colloid Interface Sci., 2004, 280, 36–43 CrossRef CAS PubMed.
- A. Armanious, M. Aeppli and M. Sander, Environ. Sci. Technol., 2014, 48, 9420–9429 CrossRef CAS PubMed.
- Y. Habibi, Chem. Soc. Rev., 2014, 43, 1519–1542 RSC.
-
H. Sehaqui, Royal Institute of Technology, 2011 Search PubMed.
- H. Sehaqui, M. Salajkova, Q. Zhou and L. A. Berglund, Soft Matter, 2010, 6, 1824–1832 RSC.
- H. Sehaqui, A. D. Liu, Q. Zhou and L. A. Berglund, Biomacromolecules, 2010, 11, 2195–2198 CrossRef CAS PubMed.
- H. Sehaqui, Q. Zhou and L. A. Berglund, Compos. Sci. Technol., 2011, 71, 1593–1599 CrossRef CAS PubMed.
- H. Sehaqui, Q. Zhou, O. Ikkala and L. A. Berglund, Biomacromolecules, 2011, 12, 3638–3644 CrossRef CAS PubMed.
- T. Saito, T. Uematsu, S. Kimura, T. Enomae and A. Isogai, Soft Matter, 2011, 7, 8804–8809 RSC.
- M. Paakko, J. Vapaavuori, R. Silvennoinen, H. Kosonen, M. Ankerfors, T. Lindstrom, L. A. Berglund and O. Ikkala, Soft Matter, 2008, 4, 2492–2499 RSC.
- M. Henriksson, L. A. Berglund, P. Isaksson, T. Lindstrom and T. Nishino, Biomacromolecules, 2008, 9, 1579–1585 CrossRef CAS PubMed.
- A. Olszewska, P. Eronen, L. S. Johansson, J. M. Malho, M. Ankerfors, T. Lindstrom, J. Ruokolainen, J. Laine and M. Osterberg, Cellulose, 2011, 18, 1213–1226 CrossRef CAS.
- M. Hasani, E. D. Cranston, G. Westman and D. G. Gray, Soft Matter, 2008, 4, 2238–2244 RSC.
- A. Pei, N. Butchosa, L. A. Berglund and Q. Zhou, Soft Matter, 2013, 9, 2047–2055 RSC.
- A. Gangneux, D. Wattiez and E. Marechal, Eur. Polym. J., 1976, 12, 535–541 CrossRef CAS.
- K. Kalbitz, D. Schwesig, J. Rethemeyer and E. Matzner, Soil Biol. Biochem., 2005, 37, 1319–1331 CrossRef CAS PubMed.
- M. Kawahigashi, K. Kaiser, A. Rodionov and G. Guggenberger, Glob. Chang. Biol., 2006, 12, 1868–1877 CrossRef PubMed.
- M. Jonoobi, A. P. Mathew and K. Oksman, Ind. Crops Prod., 2012, 40 Search PubMed.
- M. F. Benedetti, W. H. vanRiemsdik and L. K. Koopal, Environ. Sci. Technol., 1996, 30, 1805–1813 CrossRef CAS.
- H. Sehaqui, U. de Larraya, P. Liu, N. Pfenninger, A. Mathew, T. Zimmermann and P. Tingaut, Cellulose, 2014, 21, 2831–2844 CrossRef CAS PubMed.
-
N. Silava, Scribd, 2010 Search PubMed.
- R. L. Parfitt, A. R. Fraser and V. C. Farmer, J. Soil Sci., 1977, 28, 289–296 CrossRef CAS PubMed.
- L. F. Zara, A. H. Rosa, I. A. S. Toscano and J. C. Rocha, J. Braz. Chem. Soc., 2006, 17, 1014–1019 CrossRef CAS PubMed.
Footnote |
| † Electronic supplementary information (ESI) available: FTIR spectra, titration curves, adsorption modelling, QCM-D graphs, methylene blue uptake. See DOI: 10.1039/c5sm00566c |
|
| This journal is © The Royal Society of Chemistry 2015 |
Click here to see how this site uses Cookies. View our privacy policy here. 
 Open Access Article
 This Open Access Article is licensed under a Creative Commons Attribution-Non Commercial 3.0 Unported Licence