
 Open Access Article
 This Open Access Article is licensed under a
 Creative Commons Attribution 3.0 Unported Licence
Electrostatic swelling of bicontinuous cubic lipid phases†
Arwen I. I.
Tyler‡
,
Hanna M. G.
Barriga‡
,
Edward S.
Parsons
,
Nicola L. C.
McCarthy
,
Oscar
Ces
,
Robert V.
Law
,
John M.
Seddon
* and
Nicholas J.
Brooks
*
Department of Chemistry, Imperial College London, South Kensington Campus, London SW7 2AZ, UK. E-mail: nicholas.brooks@imperial.ac.uk; j.seddon@imperial.ac.uk
First published on 10th March 2015
Abstract
Lipid bicontinuous cubic phases have attracted enormous interest as bio-compatible scaffolds for use in a wide range of applications including membrane protein crystallisation, drug delivery and biosensing. One of the major bottlenecks that has hindered exploitation of these structures is an inability to create targeted highly swollen bicontinuous cubic structures with large and tunable pore sizes. In contrast, cubic structures found in vivo have periodicities approaching the micron scale. We have been able to engineer and control highly swollen bicontinuous cubic phases of spacegroup Im3m containing only lipids by (a) increasing the bilayer stiffness by adding cholesterol and (b) inducing electrostatic repulsion across the water channels by addition of anionic lipids to monoolein. By controlling the composition of the ternary mixtures we have been able to achieve lattice parameters up to 470 Å, which is 5 times that observed in pure monoolein and nearly twice the size of any lipidic cubic phase reported previously. These lattice parameters significantly exceed the predicted maximum swelling for bicontinuous cubic lipid structures, which suggest that thermal fluctuations should destroy such phases for lattice parameters larger than 300 Å.
Introduction
Lipids exhibit rich polymorphism in water and adopt phases that may possess one- (lamellar sheets, L), two- (hexagonally arranged cylinders, H) or three-dimensional periodicity (cubic phases, Q). One of the most structurally exotic categories of phases adopted by lipids are the inverse bicontinuous cubic phases. The most common inverse bicontinuous cubic phases are based on the “diamond” (QDII), the “primitive” (QPII) and the “gyroid” (QGII) minimal surfaces and have crystallographic groups Pn3m, Im3m and Ia3d respectively (Fig. 1). They are formed by draping a continuous bilayer on such minimal surfaces, resulting in two interwoven yet unconnected, water networks.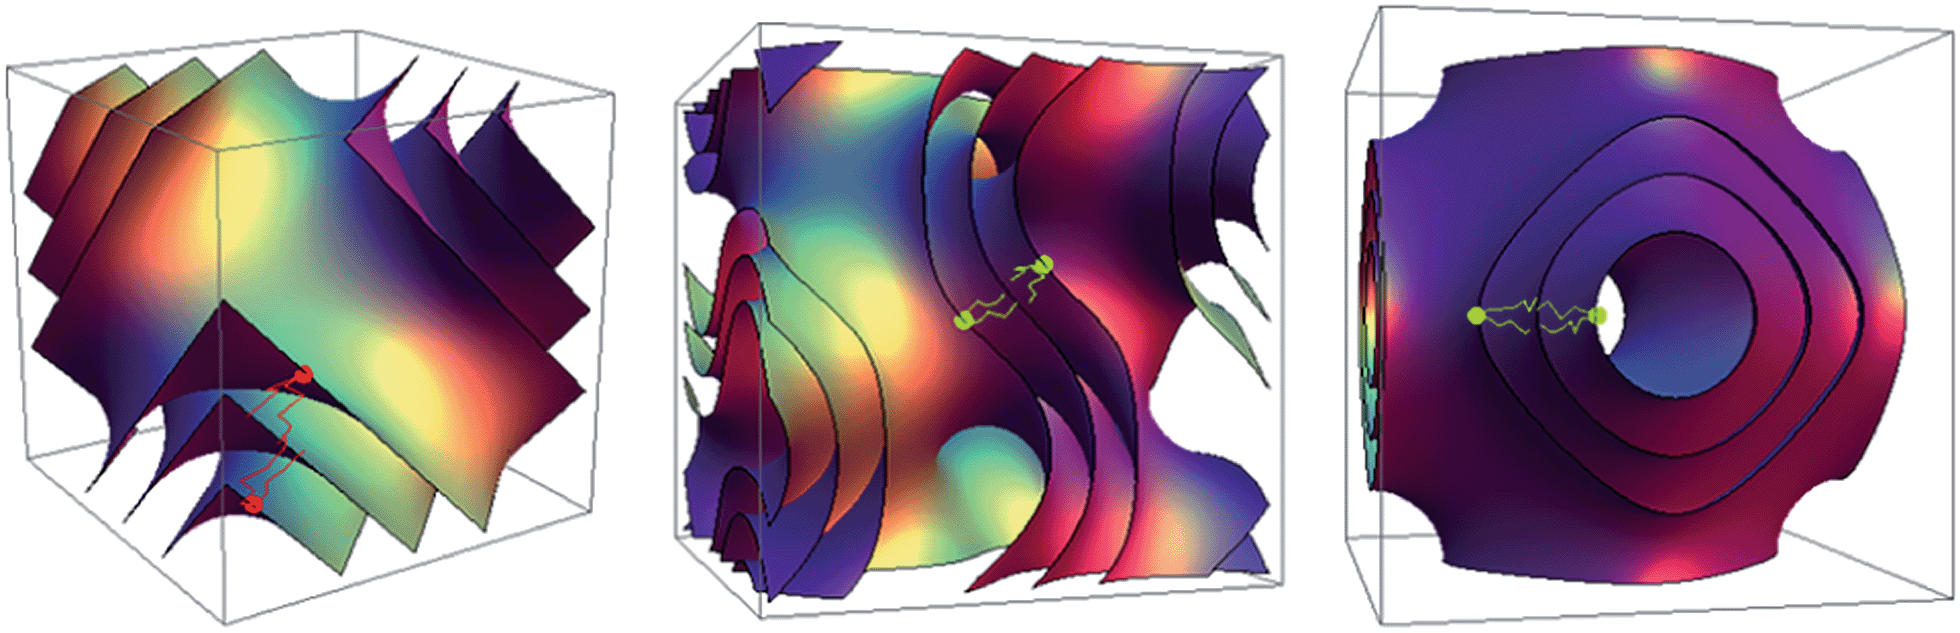 | ||
| Fig. 1 The minimal surfaces that the three lipid inverse bicontinuous cubic phases are based on. From left to right: diamond (Pn3m), gyroid (Ia3d) and primitive (Im3m). | ||
A plethora of lipid systems are known to form bicontinuous cubic phases in vitro however cubic membranes have also been observed in vivo and consequently their resemblance in properties has attracted a lot of interest.1
Highly curved membranes exist in organelles such as the Golgi network and mitochondria2 and cubic membranes have been observed in a number of cell types (ref. 1 and references therein). Non-lamellar phases are of considerable biological relevance as their formation is essential for a large number of important biological processes to occur such as exocytosis, endocytosis, viral fusion, cell division and protein function, to name but a few.1,3 Cubic phases have been observed as an intermediate during fat digestion,4 in lipid extracts from A. Laidlawii and E. coli,5,6 and micron sized cubic phases have been observed in the inner mitochondrial membranes of starved amoeba7 as well as the organized smooth endoplasmic reticulum.1 The colour of certain butterflies is due to photonic crystals within the wing cells that have been generated by templating of chitin gyroid cubic networks within the endoplasmic reticulum.8
Bicontinuous cubic phases have attracted a great deal of biotechnical interest due to their very high surface area, highly interconnected and accessible pore network and soft self-assembled structure that can undergo structural rearrangement. Due to the amphiphilic nature of the lipids that make up bicontinuous cubic phases, hydrophilic, hydrophobic and amphiphilic bioactive species can all be encapsulated in them9–11 and as a result they have been used as matrices for templating,12 biosensing13 and for membrane protein crystallization.14,15
One of the major bottlenecks hindering further exploitation of these structures is the inability to create highly swollen bicontinuous cubic structures with large and tuneable pore sizes.16 Monoacylglycerides, and particularly monoolein (MO), are some of the most common lipids used to generate cubic structures as they form at least 2 out of the 3 bicontinuous cubic phases depending on the water content and temperature.17,18 These structures typically have aqueous channel diameters around 40 Å, which prevents integration of cargo larger than this. This is a significant problem in many applications such as crystallization of membrane proteins with large extramembrane domains,19,20 encapsulation of many enzymes and selective separation of large molecules. In order to exploit these structures to their full potential it is vital to be able to engineer highly swollen cubic phases with length scales approaching those in vivo; cubic structures found in nature can be over 100 times larger than current in vitro, pure lipid structures. Considerable efforts have been made towards swelling bicontinuous cubic phases. Examples include the addition of hydration modulating agents such as octyl glucoside,21 sucrose stearate,22,23 neutral lipids24 and cholesterol (CHOL)24 as well as charged lipids,11,24–27 charged lipid-like peptides28 and nucleic acids.11 Despite this, it has not previously been possible to produce an equilibrium single-phase lipid bicontinuous cubic structure with a lattice parameter exceeding 270 Å.25
Until recently, swollen lipidic bicontinuous cubic phases with lattice parameters of 300 to 400 Å have only ever been observed as transient structures or in coexistence with other phases.29,30 We have recently formed examples of highly swollen bicontinuous cubic phases at equilibrium in hydrated lipid mixtures incorporating charged phospholipids and cholesterol.31 We have now been able to both control the structural properties of these systems by changing their lipid composition and explore the physicochemical properties and interactions that underpin this unprecedented structural swelling.
Depending on the membrane rigidity, bilayer thickness and temperature, calculations have suggested that thermal fluctuations will destroy cubic phases with lattice parameters larger than approximately 250–300 Å.32 More recent work suggests that larger cubic structures may be stable in neutral lipid systems in excess water, however these are yet to be found experimentally.33 It should be noted that the very large cubic phases found in nature are thought to be stabilized by protein scaffolds1,2 and while bicontinuous cubic phases with lattice parameters on the order of 500 Å have been observed using block copolymers,34 these are not biomimetic and hence less relevant for biological applications.
Repulsive electrostatic interactions are known to swell lamellar phases, with extent of this effect being dependent on the Debye length of the solvent and the bilayer charge density35 however much less is known about swelling of 3-D bicontinuous cubic phases. It is known that the stability of the inverse bicontinuous cubic phases is governed by the thickness, curvature and rigidity of the membrane and in principle, inverse bicontinuous phases with sufficiently stiff, yet fluid bilayers should be able to swell indefinitely in water without incurring a large chain packing cost. Thermal fluctuations tend to destroy translational ordering in bicontinuous cubic phases with large lattice parameters,32 but incorporation of cholesterol (CHOL) will tend to stiffen the fluid membrane and so reduce this effect. In addition, incorporation of small amounts of charged phospholipids will both reduce thermal fluctuations and swell the structure due to long-range electrostatic repulsions.
In this work, we have been able to engineer inverse bicontinuous cubic phases with lattice parameters of almost 500 Å in monoolein based systems by incorporating both CHOL and charged phospholipid (either dioleoylphosphatidylglycerol (DOPG) or dioleoylphosphatidylserine (DOPS)).
In addition to stiffening and swelling the membrane, CHOL, DOPG and DOPS are likely to be highly important in future application of highly swollen bicontinuous cubic phases. While MO is the archetypal bicontinuous cubic phase forming lipid, it is not common in bio-membranes and it has been found previously that doping with other lipid components is necessary for successful in-meso protein crystallization and enzyme incorporation;24 for example, doping MO with CHOL was crucial in obtaining structure-grade crystals of several G protein coupled receptors (GPCRs) (ref. 15 and references therein). The plasma membrane consists of approximately 50% CHOL36 and many proteins are thought to require CHOL for stability, function and recruitment.37,38 Moreover, many enzymes require phosphatidylserine or phosphatidylglycerol for activation.39
By engineering and controlling highly swollen bicontinuous cubic phases we hope to pave the way for these structures to be used for containment and crystallization of large membrane proteins as well as more far reaching applications such as bio-containment and delivery, and tuneable photonic devices.
Results and discussion
Effect of cholesterol on the phase behavior of monoolein
The phase behaviour of MO has been extensively studied previously;17,18 when hydrated with more than 35 wt% water, it forms a Pn3m cubic phase between approximately 20 and 80 °C. Above this temperature it transforms to an inverse hexagonal (HII) phase. CHOL in excess water is known to exist as crystals of cholesterol monohydrate up to 86 °C which then transform to the anhydrous form above this temperature.40There has also been work on the effect of CHOL on the phase behaviour of MO24 in the context of developing protein crystallization matrices; however this has been limited to experiments at 4 and 20 °C. At 20 °C and 60 wt% water, MO![[thin space (1/6-em)]](https://www.rsc.org/images/entities/char_2009.gif) :CHOL mixtures have been seen to adopt a Pn3m phase at CHOL concentrations up to 23 mol% of the total lipid component, between 23 and 28 mol% CHOL, an Im3m phase coexists with the Pn3m phase and above 28 mol% CHOL an Im3m phase coexists with excess CHOL crystals.24 Additionally, the hydrogen bonding interactions between MO and CHOL have been examined recently41 and it has been shown that the self-diffusion coefficient of MO in a cubic phase is reduced upon addition of CHOL.42
:CHOL mixtures have been seen to adopt a Pn3m phase at CHOL concentrations up to 23 mol% of the total lipid component, between 23 and 28 mol% CHOL, an Im3m phase coexists with the Pn3m phase and above 28 mol% CHOL an Im3m phase coexists with excess CHOL crystals.24 Additionally, the hydrogen bonding interactions between MO and CHOL have been examined recently41 and it has been shown that the self-diffusion coefficient of MO in a cubic phase is reduced upon addition of CHOL.42
While these results give a great deal of useful information on the interactions of MO and CHOL, elucidating the structural behaviour of these systems over a wider range of conditions (particularly at higher temperatures) is essential both for exploring their structural landscape and developing their use in bio-technical applications.
Fig. 2 shows the variation in the structure and lattice parameter of MO with increasing amounts of CHOL at 70 wt% water and 35 °C. At 35 °C and below 15 mol% CHOL, the MO:CHOL mixture adopts a Pn3m phase, at 15 mol% CHOL and above, the Pn3m phase coexists with an Im3m phase (no excess CHOL crystals were observed up to 25 mol%). The lattice parameter of the Pn3m phase increases from 96.7 Å in pure MO to a value of 133.2 Å at 25 mol% CHOL and the lattice parameter of the Im3m phase also increases with increasing CHOL concentration from 152.0 Å at 15 mol% (where it is first observed) to 171.1 Å at 25 mol% CHOL.
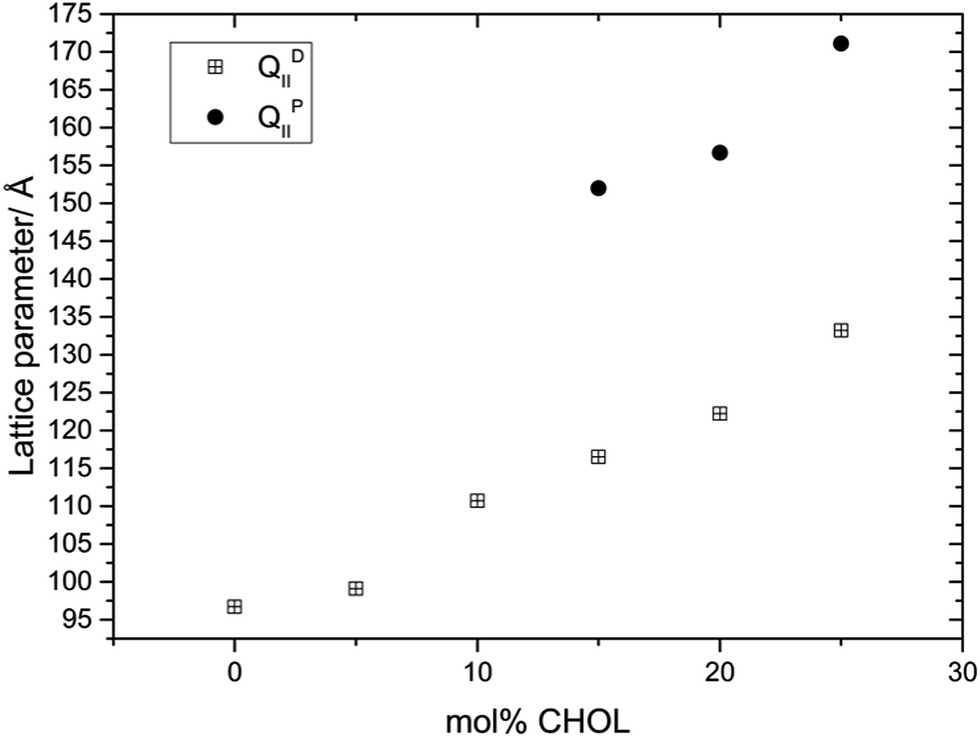 | ||
| Fig. 2 Phase behavior and effect on the lattice parameter of incorporating CHOL into MO. | ||
It has been shown that in MO:CHOL mixtures hydrated with 40 wt% water, the hydroxyl group of CHOL preferentially forms hydrogen bonds with the carbonyl group of MO's glycerol headgroup instead of bulk water (as it does when mixed with phospholipids).41 This is likely to cause the bulky sterol backbone to interact strongly with the lipid hydrocarbon chains, inhibiting trans–gauche isomerization along a large proportion of the chain and so reducing the lateral pressure in the hydrophobic region of the bilayer. This will cause a reduction in the magnitude of the spontaneous monolayer curvature, promoting larger lattice parameters. In addition, CHOL will force MO's glycerol headgroups apart, reducing hydrogen bonding interactions between adjacent MO molecules which may result in increased hydration of the MO headgroups which would again give rise to swelling of the structure.
This can be summarized by eqn (1) and (2) below which relate the surface-average Gaussian curvature, 〈K〉, to the structural parameters of the lipids.22,43
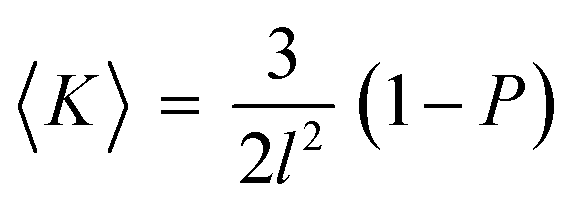 | (1) |
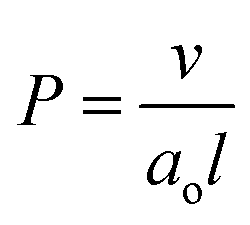 | (2) |
The Infinite Periodic Minimal Surfaces (IPMS) that the bicontinuous cubic phases are based on are characterized by a zero mean curvature (H) over the surface but a varying Gaussian curvature (K) which ranges from zero at flat points and becomes more negative moving towards the saddle points. Hence, increasing the interfacial area per molecule at the polar–non-polar interface by the addition of CHOL decreases the packing parameter and increases 〈K〉 (i.e. makes it less negative). Consequently this decreases the spontaneous inverse curvature (towards water). This will tend to drive a transition from the Pn3m phase observed in pure MO to the Im3m phase which has larger radii of curvature when modelled as a constant mean curvature surface (see ESI† for further information).43 In addition, it is known that increasing headgroup hydration drives the transition from the Ia3d to Pn3m and then Im3m phases due to changes in the Gaussian curvature.44 Consequently, the increased MO headgroup hydration caused by CHOL interactions described above rationalizes the phase sequence observed by increasing the amount of CHOL in the structure.
It has been shown45 that by using the volume fraction of lipid, φL, and the lattice parameter, a, one can calculate the lipid length, l (eqn (3)):
 | (3) |
Using calculations by Anderson et al.,46 Briggs et al.18 have derived equations to relate the water channel radius, rw, to the lattice parameter, a. It should be noted however that these are only estimates as they assume that the centre of the water channel runs parallel to the minimal surface. The estimated rw equations for the Pn3m and Im3m phases are given below:
| rPn3mw = 0.391a − l | (4) |
| rIm3mw = 0.305a − l | (5) |
The monolayer thickness of MO in the Pn3m phase in excess water has been calculated to be between 17 and 19 Å at 25 °C.47 Using a value of 18 Å, we have estimated the water channel diameters of the phases adopted in the MO:CHOL system (Table 1), as was done previously for a MO:sucrose stearate mixture.22 As with the lattice parameter, the water channel diameter increases upon CHOL addition and at 25 mol% CHOL is almost double that of pure MO.
:CHOL mixtures
| mol% CHOL | a D/Å | a P/Å | φ D % | φ P % | D wD/Å | D wP/Å |
|---|---|---|---|---|---|---|
| 0 | 96.7 | 35 | 39.6 | |||
| 5 | 99.1 | 36 | 41.5 | |||
| 10 | 110.7 | 43 | 50.6 | |||
| 15 | 116.5 | 152 | 44 | 48 | 55.1 | 56.7 |
| 20 | 122.2 | 156.7 | 46 | 49 | 59.6 | 59.6 |
| 25 | 133.2 | 171.1 | 50 | 53 | 68.2 | 68.4 |
The amount of water incorporated into the bicontinuous cubic structure can be calculated from the experimentally determined lattice parameters (see ESI† for further details). These are listed in Table 1 and comparing these values to the amount of water added during sample preparation (70 wt%) indicates all the MO:CHOL sample coexist with excess water and that their structural parameters are not limited by the available solvent.
It should be noted that the molecular parameters required for these calculations are not known for MO:CHOL mixtures, so we have used those for pure MO.
Effect of DOPS and DOPG incorporation on the phase behaviour of monoolein
Although electrostatic and fluctuation interactions are known to swell lamellar phases, swelling of 3-D bicontinuous cubic phases is much less well understood. It is known that the fundamental properties of a bilayer can change upon addition of charged lipids48 and that lamellar phases incorporating charged lipids can swell indefinitely (although most systems reach an excess water point where the lattice parameter no longer increases and the mesophase coexists with bulk water).A small number of previous studies have investigated the phase behaviour of MO when doped with a charged lipid, and with their swelling behaviour has been attributed to electrostatic interactions;24–27 however these investigations have been limited to temperatures below 20 °C. The largest lattice parameter previously recorded is 268 Å with approximately 2.5 mol% distearoylphosphatidylglycerol (DSPG) in MO at 70 wt% PIPES buffer.25
Fig. 3 and 4 show the phase behaviour and lattice parameter dependence of MO with 70 wt% water at 35 and 45 °C, with increasing amount of DOPS or DOPG added to the system. Up until 5 mol% charged lipid, both systems show very similar phase behaviour, adopting an Im3m phase which progressively swells with increasing concentrations of charged lipid. At 5 mol% DOPS and DOPG, the systems reach a maximum lattice parameter of around 300 Å and 350 Å respectively. At 10 mol% charged lipid however the DOPG system collapses to a lamellar phase whilst the DOPS system swells further to reach a lattice parameter of 365 Å at 35 °C and 399 Å at 45 °C.
 | ||
| Fig. 3 Phase behavior and effect on the lattice parameter of incorporating DOPS into MO. | ||
 | ||
| Fig. 4 Phase behavior and effect on the lattice parameter of incorporating DOPG into MO. | ||
In both systems, addition of just 1 mol% charged lipid changes the bicontinuous cubic phase from Pn3m (as seen for pure MO) to Im3m, which swells upon further addition of charged lipid. This phase transition is in agreement with previous work on doping monoacylglycerides with increasing amount of lipids, sterols or hydration enhancing agents.22,24–27 Increasing the concentration of charged lipid in the cubic structure will cause an increase in the surface charge density and so enhance the electrostatic repulsion between charged lipid headgroups. In addition, incorporating DOPS into the membrane may cause an increase in steric repulsion in the headgroup region due to its relatively large phosphatidylserine headgroup.
Both of these effects will cause the effective headgroup area to increase, resulting in a decrease in the magnitude of the monolayer spontaneous inverse curvature (H0) and hence a larger lattice parameter. Using eqn (1), it can be seen that increasing the headgroup area will decrease the packing parameter and decrease the magnitude of the Gaussian curvature 〈K〉 (i.e. becomes less negative), hence stabilizing the Im3m phase.43,44
The difference in phase behaviour between samples containing 10 mol% DOPS (bicontinuous cubic Im3m phase) and DOPG (fluid lamellar phase) may be explained by considering the headgroup ordering of the charged lipids and their propensity to form hydrogen bonding interactions. NMR studies have shown that the molecular order, from 2H NMR, in the headgroup region is significantly higher for DOPS than DOPG, which in turn dictates their propensity to form non-lamellar phases.48 As the DOPG headgroup is more disordered than DOPS it is likely to occupy a larger volume (with its hydration shell) resulting in a drive towards flatter structures. In addition, it is known that phosphatidylserine lipids can form hydrogen bonded networks49,50 resulting in a reduced effective headgroup size which drives increased inverse curvature (see ESI† for further discussion of charged lipid spontaneous curvature).
Interestingly, dioleoylphosphatidic acid (DOPA) shows even greater headgroup ordering than DOPS but cannot form hydrogen bonded networks. Preliminary experiments incorporating 10 mol% DOPA into MO show formation of an Im3m phase with a lattice parameter of 416 Å at 45 °C which is larger than the equivalent DOPS structure. It appears that when doping MO with 10 mol% charged lipid, DOPS forms the most curved structure (Im3m, a = 399 Å) followed by DOPA (Im3m, a = 416 Å) and the DOPG system forms a flat bilayer structure.
It should be noted that while the samples prepared here were hydrated with pure water, for some applications the use of buffers and salts are essential. In pure water, the only ions in solution are the charged lipid counterions (Na+) and so the electrostatic interactions between the charged lipids are maximised, however, increasing the ionic concentration of the aqueous solution by addition of salts or buffers will result in increased charge screening and a reduction in electrostatic interactions between the lipid bilayers. An increase in ionic concentration has been shown to cause a reduction in the lattice parameter observed in MO membranes with charged species incorporated.26,27,51 In addition, it has been previously shown (and was observed here) that increasing the concentration of charged lipids in MO can causes a transition from a cubic to lamellar phase,24,27,52 however addition of buffers and salts causes a significant increase in the charged lipid concentration at which this transition occurs, due to a reduction in the inter-bilayer electrostatic interactions. For example, mixtures of MO with DOPG transform to a lamellar phase at 25% DOPG in 10 mM PIPES buffer and at 30% DOPG when in 10 mM PIPES and 1 M NaCl,53 however, in our pure water systems, 10% DOPG is sufficient to cause this transition to occur.
The effects of salt and buffer discussed above are likely to have a significant contribution from the effect of charge screening on the monolayer spontaneous curvature; it has been reported previously that in MO:DOPG and MO:DOPA mixtures,27,53 increasing electrostatic repulsion between the charged headgroups increase the effective lipid headgroup area resulting in a decrease of the magnitude of H0 (see also additional discussion in the ESI†). At low charged lipid concentration, this causes a reduction in the negative interfacial curvature of the cubic phase leading to an increase in the lattice parameter and above a critical charged lipid concentration will cause a transition to a lamellar phase. Increasing the ionic concentration will cause increased screening of the intra-monolayer electrostatic interaction leading to a reduction in cubic lattice parameters and an increase in the critical charged lipid concentration required to cause a phase transition to the lamellar phase.
Calculating the water volume fraction of these structures as described previously suggests that the maximum lattice parameter possible with 70 wt% water is 283 Å, which suggests that samples containing more than 2% charged lipid are not in excess water. This is not entirely consistent with the experimental data which show significant further swelling upon addition of charged lipid, however we have only used known parameters for MO for these calculations and it is very likely that volume and area parameters will change on incorporation of different lipids into MO and the model is known to become less accurate at water concentrations above 38 wt%.44
There is little temperature variation at low concentrations of charged lipid however at higher percentages the systems appear to swell with temperature, which is the opposite behaviour compared to pure MO. An increase in temperature will induce an increase in the chain splay (and hence an increase in H0) resulting in a decrease in the lattice parameter of a mesophase. The opposite trend seen here suggests that electrostatic interactions are dominating the behaviour of the system. Studies have shown that DOPS membranes become thinner with an increase in temperature.54 Increased kinetic energy of the counterions as temperature is increased results in them dissociating and hence the screening length and the electrostatic repulsions in the headgroup also increase.55 Electrostatic repulsions cause the headgroup area to increase, which in turn reduces H0, leading to an increase in the lattice parameter. The calculated water channel diameters of the Im3m phase in the systems studied are presented in Fig. S1 (ESI†). For the most swollen phase, the diameter of the water channels is calculated to be approximately 218 Å, which is almost three times larger than any swollen lipidic cubic phase recorded to date.
Ternary mixtures of monoolein, cholesterol and charged lipid
By doping MO with a small amount of charged lipid we can swell its cubic structure to 4 times larger than seen in pure MO via electrostatic repulsion across the water channels. Although thermal fluctuations will tend to destroy translational ordering for large lattice parameters, binary mixtures of MO with charged lipid somewhat resist this, due to long range electrostatic repulsions. To test whether thermal fluctuations are limiting the size of our cubic phases we added CHOL to the binary MO:charged lipid mixtures in order to stiffen the membrane whilst still keeping it fluid. By doing so we have managed to swell the cubic phase up to a maximum of approximately 470 Å (around 70 Å higher than the largest observed structure in corresponding binary mixtures containing DOPG or DOPS). A typical diffraction pattern of the Im3m phase obtained is shown in Fig. 5. Although by addition of cholesterol we have managed to reduce thermal fluctuations in the bilayer and further swell the structure, the rapid reduction in intensity of higher order diffraction peaks indicates that these fluctuations must still be significant.56
 | ||
| Fig. 5 Main figure: integrated synchrotron small angle X-ray diffraction pattern from the Im3m phase of hydrated MO:CHOL:DOPG 80:15:5 mixture at 35 °C and indexing of the Bragg peaks. Inset: corresponding 2D diffraction pattern. Note that the scattering vector S = 1/d. | ||
Fig. 6 shows the effect of increasing CHOL in ternary mixtures of MO while keeping the mol% of charged lipid constant at 5 mol%. At 35 °C the DOPS mixture adopts an Im3m phase with a lattice parameter of 299 Å at 0 mol% CHOL and swells to a maximum of 455 Å at 30 mol% CHOL. At 45 °C, the Im3m phase swells from 285 Å at 0 mol% CHOL to 467 Å at 30 mol% CHOL. At 30 mol% the Im3m phase is always in coexistence with CHOL monohydrate crystals (d = 34 Å) and at 45 °C it is also in coexistence with an HII phase. At 35 °C the DOPG mixture adopts an Im3m phase which swells from 361 Å at 0 mol% CHOL to a maximum of 415 Å at 15 mol% CHOL. At 45 °C, the Im3m phase swells from 364 Å at 0 mol% CHOL to 423 Å at 30 mol% CHOL. At 30 mol% the Im3m phase coexists with an HII phase and excess CHOL crystals at both temperatures.
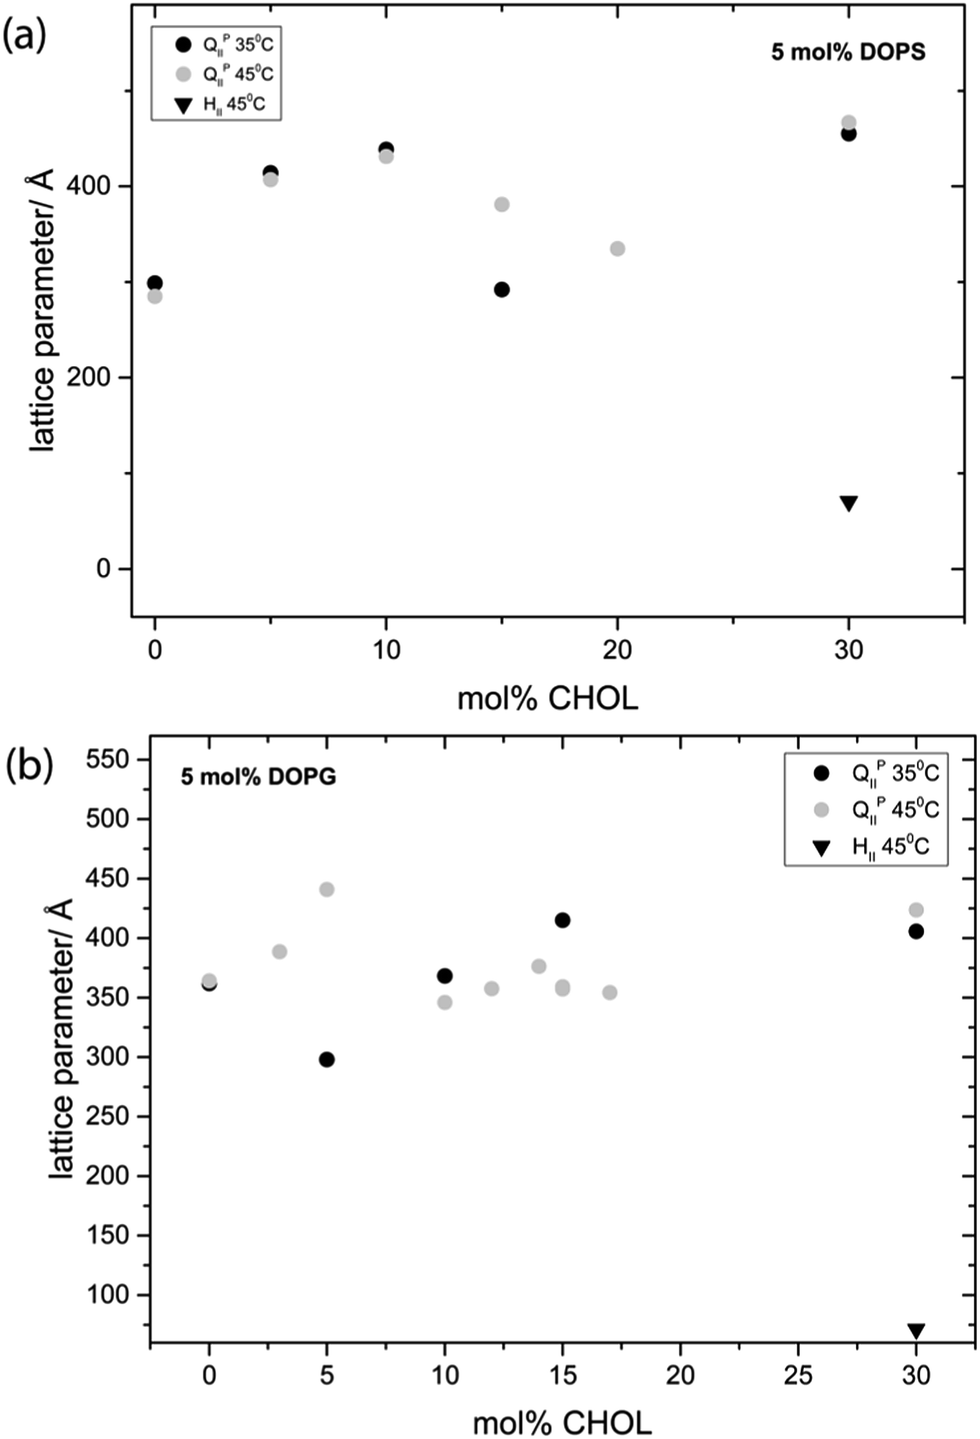 | ||
| Fig. 6 Phase behavior and effect on the lattice parameter of incorporating CHOL into (a) MO:DOPS mixtures and (b) MO:DOPG mixtures, keeping the charged lipid concentration fixed at 5 mol% in all samples. | ||
It should be noted that mixtures with 15 and 20 mol% CHOL for 5 mol% DOPS and 10–20 mol% CHOL for 5 mol% DOPG are often seen to coexist with an HII phase, leading to a smaller lattice parameter as the phases compete for water. MO in excess water is known to hydrolyse (producing glycerol and oleic acid) resulting in the formation of an HII phase.57 As the HII phase is not always seen in mixtures with 10–20 mol% CHOL, its formation in these samples may be due to small amounts of MO hydrolysis. In contrast, the HII phases observed in the corresponding 30 mol% CHOL samples are always seen, these mixtures shows consistent phase behaviour which is reversible when varying temperature and so we believe this is a true equilibrium structure. Interestingly, mixtures of MO with 5% R-(+)-limonene in excess water are also known to adopt an HII phase.58
Mixtures of MO with the concentration of DOPS fixed at 10 mol% and varying amounts of CHOL have a relatively constant lattice parameter upon CHOL addition until the system transforms to a lamellar phase at 30 mol% CHOL (Fig. 7). All ternary mixtures containing 10 mol% DOPG adopt a lamellar phase with lattice parameters in the region of 150 Å (see Fig. S2, ESI†). This behaviour is different to that seen with increasing CHOL at 5 mol% DOPS. We believe that at 10 mol% DOPS, the cubic phase swelling effect is dominated by the large electrostatic interactions, meaning that the membrane stiffening induced by CHOL incorporation has relatively little effect on the lattice parameter.
 | ||
| Fig. 7 Phase behavior and effect on the lattice parameter of incorporating CHOL into MO:DOPS mixtures keeping the concentration of DOPS fixed at 10 mol%. | ||
It should be noted that several of the ternary compositions were measured during independent synchrotron experiments and lattice parameters for these agree to within better than 30 Å. This variation is likely to be due to small differences in sample preparation. We believe the small fluctuations for 5 mol% DOPG and between 10 and 20 mol% CHOL at 45 °C are within this experimental variation.
As an example, the calculated water channel diameters of the Im3m phase for mixtures of MO with 5% DOPS and varying CHOL concentration are presented in Fig. S3 (ESI†). For the most swollen phase, the diameter of the water channels is calculated to be around 249 Å, which is the largest we have managed to achieve in any of the mixtures.
To the best of our knowledge, the lattice parameters and water channel diameters achieved here are the largest ever obtained for a bicontinuous cubic phase formed from a pure lipid mixture at equilibrium. The anionic lipids act synergistically with CHOL when doped into MO to swell the cubic phase significantly beyond structures obtained in binary mixtures of MO with either additional component.
Experimental
Detailed procedures can be found in the ESI.†Appropriate amounts of dry lipids were co-dissolved in chloroform. They were initially dried under a nitrogen stream then under vacuum for at least 24 h. The samples were then hydrated with 70 wt% HPLC grade water, subjected to a minimum of 20 freeze–thaw cycles (between −210 and 40 °C) and at least 5 pressure cycles (1 to 2000 bar) homogenize the mixtures.
X-ray experiments were carried out on beamline ID02 at the European Synchrotron Radiation Facility (ESRF) and beamline I22 at Diamond Light Source (DLS) using X-ray wavelengths of 0.73 Å (ESRF) or 0.69 Å (DLS) and at camera lengths of 1.2 m, 3.0 m, 4.0 m and 4.5 m.
Conclusions
We have been able to generate and control swollen, protein free, bicontinuous cubic phases of spacegroup Im3m by (a) increasing the bilayer stiffness whilst still keeping it fluid by adding CHOL and (b) inducing electrostatic repulsion across the water channels by addition of anionic lipids to MO. By controlling the composition of the ternary mixtures we can tune the pore sizes of the structure and have managed to achieve lattice parameters of up to 470 Å which is over 5 times larger than the cubic phase of MO in excess water. We hope these results will pave the way to developing engineering rules for the formation of bicontinuous cubic phases with lattice parameters significantly higher than those currently available. In addition, we have recently been able to dynamically tune the size of these structures using temperature and pressure changes.31 These highly swollen, tuneable cubic phases are likely to open up a wide range of bio-technical applications including formation of tuneable photonic crystals, high surface area catalysts, large molecule capture devices and scaffolds for in-cubo crystallization of large membrane proteins.Acknowledgements
We thank ESRF and Diamond Light Source for the award of synchrotron beamtime and Dr Michael Sztucki (ESRF) and Dr Andy Smith (DLS) for their support and assistance. This work was supported by EPSRC Programme Grant EP/J017566/1, EPSRC Platform Grant EP/G00465X/1, by EPSRC Centre for Doctoral Training Studentships from the Institute of Chemical Biology EP/F500076/1 awarded to ESP and NLCM, and an EPSRC Doctoral Prize Fellowship awarded to AIIT.Notes and references
- Z. A. Almsherqi, S. D. Kohlwein and Y. Deng, J. Cell Biol., 2006, 173, 839–844 CrossRef CAS PubMed
.
- G. K. Voeltz and W. A. Prinz, Nat. Rev. Mol. Cell Biol., 2007, 8, 258–264 CrossRef CAS PubMed
- G. Basanez, F. M. Goni and A. Alonso, Biochemistry, 1998, 37, 3901–3908 CrossRef CAS PubMed
- J. S. Patton and M. C. Carey, Science, 1979, 204, 145–148 CAS
- E. Staudegger, E. J. Prenner, M. Kriechbaum, G. Degovics, R. N. A. H. Lewis, R. N. McElhaney and K. Lohner, Biochim. Biophys. Acta, Biomembr., 2000, 1468, 213–230 CrossRef CAS
- A. S. Andersson, L. Rilfors, G. Oradd and G. Lindblom, Biophys. J., 1998, 75, 2877–2887 CrossRef CAS
- Y. R. Deng, M. Marko, K. F. Buttle, A. Leith, M. Mieczkowski and C. A. Mannella, J. Struct. Biol., 1999, 127, 231–239 CrossRef CAS PubMed
- G. E. Schroder-Turk, S. Wickham, H. Averdunk, F. Brink, J. D. F. Gerald, L. Poladian, M. C. J. Large and S. T. Hyde, J. Struct. Biol., 2011, 174, 290–295 CrossRef CAS PubMed
- F. Caboi, T. Nylander, V. Razumas, Z. Talaikyte, M. Monduzzi and K. Larsson, Langmuir, 1997, 13, 5476–5483 CrossRef CAS
- I. Amar-Yuli, D. Libster, A. Aserin and N. Garti, Curr. Opin. Colloid Interface Sci., 2009, 14, 21–32 CrossRef CAS PubMed
- C. Leal, N. F. Bouxsein, K. K. Ewert and C. R. Safinya, J. Am. Chem. Soc., 2010, 132, 16841–16847 CrossRef CAS PubMed
- Y. Doi, A. Takai, Y. Sakamoto, O. Terasaki, Y. Yamauchi and K. Kuroda, Chem. Commun., 2010, 46, 6365–6367 RSC
- A. Angelova, M. Ollivon, A. Campitelli and C. Bourgaux, Langmuir, 2003, 19, 6928–6935 CrossRef CAS
- M. Caffrey and V. Cherezov, Nat. Protoc., 2009, 4, 706–731 CrossRef CAS PubMed
- M. Caffrey, Biochem. Soc. Trans., 2011, 39, 725–732 CAS
- R. F. Service, Science, 2014, 343, 1094–1097 CrossRef PubMed
- C. V. Kulkarni, T. Y. Tang, A. M. Seddon, J. M. Seddon, O. Ces and R. H. Templer, Soft Matter, 2010, 6, 3191–3194 RSC
- J. Briggs, H. Chung and M. Caffrey, J. Phys. II, 1996, 6, 723–751 CrossRef CAS
- A. Zabara and R. Mezzenga, Soft Matter, 2013, 9, 1010–1014 RSC
- A. Zabara and R. Mezzenga, Soft Matter, 2012, 8, 6535–6541 RSC
- B. Angelov, A. Angelova, M. Ollivon, C. Bourgaux and A. Campitelli, J. Am. Chem. Soc., 2003, 125, 7188–7189 CrossRef CAS PubMed
- R. Negrini and R. Mezzenga, Langmuir, 2012, 28, 16455–16462 CrossRef CAS PubMed
- W. Sun, J. J. Vallooran, A. Zabara and R. Mezzenga, Nanoscale, 2014, 6, 6853–6859 RSC
- V. Cherezov, J. Clogston, Y. Misquitta, W. Abdel-Gawad and M. Caffrey, Biophys. J., 2002, 83, 3393–3407 CrossRef CAS
- J. Engblom, Y. Miezis, T. Nylander, V. Razumas and K. Larsson, Prog. Colloid Polym. Sci., 2001, 116, 9–15 Search PubMed
- U. Aota-Nakano, S. J. Li and M. Yamazaki, Biochim. Biophys. Acta, Biomembr., 1999, 1461, 96–102 CrossRef
- S. J. Li, Y. Yamashita and M. Yamazaki, Biophys. J., 2001, 81, 983–993 CrossRef CAS
- A. Yaghmur, P. Laggner, S. G. Zhang and M. Rappolt, PLoS One, 2007, 2, e479 Search PubMed
- D. P. Siegel and B. G. Tenchov, Biophys. J., 2008, 94, 3987–3995 CrossRef CAS PubMed
- C. E. Conn, O. Ces, X. Mulet, S. Finet, R. Winter, J. M. Seddon and R. H. Templer, Phys. Rev. Lett., 2006, 96, 108102 CrossRef
- H. M. G. Barriga, A. I. I. Tyler, N. L. C. McCarthy, E. S. Parsons, O. Ces, R. V. Law, J. M. Seddon and N. J. Brooks, Soft Matter, 2015, 11, 600–607 RSC
- R. Bruinsma, J. Phys. II, 1992, 2, 425–451 CrossRef CAS
- G. C. Shearman, O. Ces and R. H. Templer, Soft Matter, 2010, 6, 256–262 RSC
- Y. La, C. Park, T. J. Shin, S. H. Joo, S. Kang and K. T. Kim, Nat. Chem., 2014, 6, 534–541 CrossRef CAS PubMed
- M. Dubois, T. Zemb, L. Belloni, A. Delville, P. Levitz and R. Setton, J. Chem. Phys., 1992, 96, 2278–2286 CrossRef CAS PubMed
- G. van Meer, D. R. Voelker and G. W. Feigenson, Nat. Rev. Mol. Cell Biol., 2008, 9, 112–124 CrossRef CAS PubMed
- J. E. Smotrys and M. E. Linder, Annu. Rev. Biochem., 2004, 73, 559–587 CrossRef CAS PubMed
- K. Simons and E. Ikonen, Nature, 1997, 387, 569–572 CrossRef CAS PubMed
- A. M. Powl, J. M. East and A. G. Lee, Biochemistry, 2008, 47, 12175–12184 CrossRef CAS PubMed
- C. R. Loomis, G. G. Shipley and D. M. Small, J. Lipid Res., 1979, 20, 525–535 CAS
- D. L. Gater, V. Reat, G. Czaplicki, O. Saurel, A. Milon, F. Jolibois and V. Cherezov, Langmuir, 2013, 29, 8031–8038 CrossRef CAS PubMed
- P. O. Eriksson and G. Lindblom, Biophys. J., 1993, 64, 129–136 CrossRef CAS
- S. T. Hyde, J. Phys. Chem., 1989, 93, 1458–1464 CrossRef CAS
- R. H. Templer, J. M. Seddon, P. M. Duesing, R. Winter and J. Erbes, J. Phys. Chem. B, 1998, 102, 7262–7271 CrossRef CAS
- D. C. Turner, Z. G. Wang, S. M. Gruner, D. A. Mannock and R. N. Mcelhaney, J. Phys. II, 1992, 2, 2039–2063 CrossRef CAS
- D. M. Anderson, S. M. Gruner and S. Leibler, Proc. Natl. Acad. Sci. U. S. A., 1988, 85, 5364–5368 CrossRef CAS
- M. Pisani, S. Bernstorff, C. Ferrero and P. Mariani, J. Phys. Chem. B, 2001, 105, 3109–3119 CrossRef CAS
- G. Lindblom, L. Rilfors, J. B. Hauksson, I. Brentel, M. Sjolund and B. Bergenstahl, Biochemistry, 1991, 30, 10938–10948 CrossRef CAS
- H. I. Petrache, S. Tristram-Nagle, K. Gawrisch, D. Harries, V. A. Parsegian and J. F. Nagle, Biophys. J., 2004, 86, 1574–1586 CrossRef CAS
- I. R. Miller and M. Eisenstein, Bioelectrochemistry, 2000, 52, 77–81 CrossRef CAS
- S. M. Masum, S. J. Li, Y. Tamba, Y. Yamashita, T. Tanaka and M. Yamazaki, Langmuir, 2003, 19, 4745–4753 CrossRef CAS
-
M. Yamazaki, in Advances in Planar Lipid Bilayers and Liposomes, ed. A. L. Liu, Academic Press, 2009, vol. 9, pp. 163–209 Search PubMed
- T. S. Awad, Y. Okamoto, S. M. Masum and M. Yamazaki, Langmuir, 2005, 21, 11556–11561 CrossRef CAS PubMed
- P. Szekely, T. Dvir, R. Asor, R. Resh, A. Steiner, O. Szekely, A. Ginsburg, J. Mosenkis, V. Guralnick, Y. Dan, T. Wolf, C. Tamburu and U. Raviv, J. Phys. Chem. B, 2011, 115, 14501–14506 CrossRef CAS PubMed
-
D. Andelman, in Structure and dynamics of membranes, ed. R. Lipowsky and E. Sackmann, Elsevier Science, Amsterdam, New York, 1995, pp. 603–641 Search PubMed
- D. Roux and C. R. Safinya, J. Phys., 1988, 49, 307–318 Search PubMed
- F. Caboi, G. S. Amico, P. Pitzalis, M. Monduzzi, T. Nylander and K. Larsson, Chem. Phys. Lipids, 2001, 109, 47–62 CrossRef CAS
- A. Salonen, S. Guillot and O. Glatter, Langmuir, 2007, 23, 9151–9154 CrossRef CAS PubMed
Footnotes |
| † Electronic supplementary information (ESI) available: Extended description of Materials and methods, information on structural models for bicontinuous cubic phases, full details of the calculation of bicontinuous cubic phases water content, further discussion of the effect of charged lipids on spontaneous curvature and additional plots as noted in the main text. See DOI: 10.1039/c5sm00311c |
| ‡ These authors contributed equally to the work presented. |
| This journal is © The Royal Society of Chemistry 2015 |