 Open Access Article
Creative Commons Attribution 3.0 Unported Licence
Fractional Debye–Stokes–Einstein behaviour in an ultraviscous nanocolloid: glycerol and silver nanoparticles
Szymon
Starzonek
ab,
Sylwester J.
Rzoska
*ab,
A.
Drozd-Rzoska
b,
Sebastian
Pawlus
a,
Ewelina
Biała
a,
Julio Cesar
Martinez-Garcia
c and
Ludmila
Kistersky
d
aSilesian Intercollegiate Center for Education and Interdisciplinary Research & Institute of Physics, University of Silesia, ul. 75 Pułku Piechoty 1A, 41-500 Chorzów, Poland. E-mail: sylwester.rzoska@gmail.com
bInstitute of High Pressure Physics, Polish Academy of Sciences, ul. Sokołowska 27/39, 01-142 Warsaw, Poland
cUniversity of Bern, Freiestrasse 3, Bern CH-3012, Switzerland
dV. Bakul Institute for Superhard Materials of the National Academy of Superhard materials NASU, Avtozavodskaya Str.2, 04074 Kiev, Ukraine
First published on 12th June 2015
Abstract
One of the major features of glass forming ultraviscous liquids is the decoupling between translational and orientational dynamics. This paper presents studies of this phenomenon in glycerol, an accepted molecular glass former, concentrating on the impact of two exogenic factors: high pressures (P) up to the extreme 1.5 GPa and silver (Ag) nanoparticles (NPs). The analysis is focused on the fractional Debye–Stokes–Einstein (FDSE) relationship: σ(T,P)(τ(T,P))S = const, linking DC electric conductivity (σ) and primary (alpha, structural) relaxation time (τα). In glycerol and its nanocolloid (glycerol + Ag NPs) at atmospheric pressure only negligible decoupling (S ∼ 1) was detected. However, in the compressed nanocolloid, a well-defined transformation (at P = 1.2 GPa) from S ∼ 1 to the very strongly decoupled dynamics (S ∼ 0.5) occurred. For comparison, in pressurized ‘pure’ glycerol the stretched shift from S ∼ 1 to S ∼ 0.7 took place. This paper also presents the general discussion of FDSE behavior in ultraviscous liquids, including the new link between the FDSE exponent, fragility and the apparent activation enthalpy and volume.
Introduction
Glass transition physics has remained a challenge for condensed and soft matter physics for many decades.1–3 The most intriguing feature is the set of strong previtreous effects for dynamic properties, with similar patterns for qualitatively different glass forming systems.2 The key representative of such behavior is the super-Arrhenius (SA) evolution of various dynamic properties on approaching the glass temperature (Tg):2,3 | (1) |
The basic Arrhenius equation can be restored for ΔEa(T) = ΔEa = const.
The ‘universal’ metric of the SA behavior is called ‘fragility’ and is defined as:2,4
 | (2) |
![[thin space (1/6-em)]](https://www.rsc.org/images/entities/char_2009.gif) τα(Tg) − log
τα(Tg) − log![[thin space (1/6-em)]](https://www.rsc.org/images/entities/char_2009.gif) τ0, ΔHa = d
τ0, ΔHa = d![[thin space (1/6-em)]](https://www.rsc.org/images/entities/char_2009.gif) ln
ln![[thin space (1/6-em)]](https://www.rsc.org/images/entities/char_2009.gif) τα(Tg)/d(1/Tg) is the activation enthalpy, τα(Tg) = 100 s and τ0 = 10−11–10−16 s is the prefactor in the SA eqn (1). The SA behavior is assisted by the stretched exponential (SE) time decay of the physical properties: I(t) ∝ exp[−(t/τα)β], with the SE exponent 0 < β ≤ 1 or equivalently the non-Debye distribution of relaxation times in the frequency domain.2
τα(Tg)/d(1/Tg) is the activation enthalpy, τα(Tg) = 100 s and τ0 = 10−11–10−16 s is the prefactor in the SA eqn (1). The SA behavior is assisted by the stretched exponential (SE) time decay of the physical properties: I(t) ∝ exp[−(t/τα)β], with the SE exponent 0 < β ≤ 1 or equivalently the non-Debye distribution of relaxation times in the frequency domain.2
It is particularly notable that the evolution of translation and orientation related dynamic properties (x(T)) in the ultraviscous domain near Tg is decoupled, which is manifested by the fractional Stokes–Einstein (FSE) and fractional Debye–Stokes–Einstein (FDSE) relationships:2,7–10
| D/T = Aη−1+ϖ and D/T = A′τ−1+ϖα with the exponent ς = 1 − ϖ | (3) |
| στ1−μα = const with the exponent S = 1 − μ | (4) |
The experimental evidence indicates that generally FDSE or FSE behavior with non-zero fractional exponents (ϖ,μ ≠ 0) takes place in the ultraviscous/ultraslowing dynamical domain for TB (τα ∼ 10−7 s, η ∼ 103 Poise) < T(τ,η) < Tg (τα ∼ 102 s, η ∼ 1013 Poise). For T > TB the crossover to Debye–Stokes–Einstein (DSE) or SE behavior occurs when (ϖ,μ = 0 or ζ,S = 1).2,8–40 The temperature TB is related to the crossover from the high temperature (ergodic) to the low-temperature (non-ergodic) dynamic domain.2,11 The latter is also associated with the appearance of multimolecular dynamic heterogeneities (DHs) or alternatively cooperatively rearranging regions near the Tg, with vastly different relaxation times and viscosity.2,16–40 They are considered as the most probable reason for the universal patterns in the ultraviscous/ultraslowing (low temperature) domain in the immediate vicinity of the Tg.2 Studies of FDSE or FSE behavior are recognized as one of key tools for obtaining insight into, the still mysterious, dynamic heterogeneities.2,8,15 Nevertheless, the knowledge regarding the fundamental background of FDSE/FSE behavior is still heuristic, despite the growing number of experimental and theoretical research reports.2,7–40
All these suggests the significance of FDSE studies in ultraviscous liquids atemporal ‘research status quo’. This is the target of this report.
Firstly, an outline of the FDSE reference results will be given, particularly focusing on eqn (4), is presented. This topic is concluded by exploring the novel link between the FDSE exponent and the basic characteristics of the SA behavior, namely: the fragility, the activation enthalpy and the activation volume. Secondly, results related to the impact of exogenic factors on the dynamics of glycerol, one of the accepted glass forming liquids, are presented. They are: (i) high pressures up to a challenging P = 1.5 GPa and (ii) the addition of silver nanoparticles (Ag NP), forming a nanocolloid/nanocomposite/nanofluid with the ultraviscous glycerol. The impact of NPs lead to the crossover of the strongly decoupled region in the immediate vicinity of the Tg, i.e., within the ultraviscous domain, a phenomenon which has not been reported before.
II. The translational–orientational decoupling
For coupling between translational and orientational processes in ‘classical’ liquids one can expect the Debye, Stokes and Einstein relationships to be valid:2,14,41 | (5) |
 | (6) |
 | (7) |
It is notable that for the Debye–Stokes (DS) equation [eqn (6)], τα(T) ∝ η(T)/T.15,41 However, the alternative approach by the Maxwell relationship15 gives τ = G∞η. Consequently, assuming that in the ultraviscous domain the instantaneous shear modulus G∞ = const one obtains τ(T) ∝ η(T).15 It is worth recalling that in the Maxwell relationship, τ denotes the stress relaxation time and there is no clear experimental evidence that the structural (τα) and stress relaxation time (τ) are interchangeable.2,15 Linking the above dependences with the Nernst–Einstein (NE) relationship Dtr = kBTσ/nq2,14 where n is the number of electric charges/carriers, σ denotes the DC electric conductivity and q is the electric charge, one obtains:
 | (8) |
 | (9) |
In low molecular weight liquids the DC conductivity arises from residual ionic dopants: salts or other ionic species that inevitably get into samples during their synthesis.12 For broad band dielectric spectra (BDS) such behavior always dominates at lower frequencies, often beginning just below the kHz domain. In ionic or highly conductive liquids this can also be the governing factor for the multi MHz region. It is notable that taking into account the Nernst–Smoluchowski relationship (NS: Dtr = λ/2τh),14,41,42 and the NE equations one obtains the relationship linking DC conductivity and the hopping time of ions, responsible for the DC conductivity, namely:
 | (10) |
This relationship makes it possible to present eqn (3)–(7) as the result of the comparison between the two time scales associated with the orientation of molecules (∼primary, alpha, structural relaxation) and the translation related ions hopping time. The entrance into the ultraviscous domain converts eqn (10), NS and NE relationships into their fractional forms. Consequently, FSE and FDSE eqn (3) and (4) can be presented as the results of the comparison of the two previously mentioned timescales:43
 | (11) |
The last dependence resembles the one used in polymeric systems for the comparison of segmental (τS) and chain (τC) relaxation processes: R = τS/τC ∝ (τS)ε. For LMW liquids, the primary relaxation time τα can be compared to τS and τC on the large time scale: in polymers it is estimated by τC ∝ 〈τS〉. In ref. 43 the thermally activated barrier hopping model for the glass transition phenomenon is recalled to enable a deeper discussion of this issue. This model assumes that the leading role of heterogeneities/(local domains) is coordinating a group of molecules (LMW) or segments (P) in the ultraviscous/ultraslowing region. Fluctuating local density excesses result in a distribution of barrier heights, which gives rise to the decoupling of primary relaxation time and diffusion related processes as well as to the stretched exponential (non-Debye) relaxation. For polymers this ‘heterogeneous’ model yields: ε = Δ/(1 + Δ) = 1 + (1/acq), where Δ = aCq′ = aCσE2/2〈FB〉, σE2 is the energy barrier fluctuations variance, ΔEa(T) = acFB(T) in SA eqn (1), ac is a presumably temperature independent cooperation parameter, FB(T) is the hopping barrier energy and 〈FB(T)〉 is the mean value. The parameter q′ = 0.1–0.2 is the volume fraction of cooperative domains (heterogeneities). Based on the previous dependences and the semi-empirical correlation for the fragility m = 16 + 40.6(ac)0.56 in polymers, one can directly arrive at the relationship which can easily be tested experimentally:43
 | (12) |
In experimental studies on ultraviscous LMW liquids, particular attention was paid to eqn (4) linking structural relaxation time and DC electric conductivity. So far, this is the only ‘fractional coupling’ relationship which can be tested both as the function of temperature and pressure. Furthermore, experimental values of σ(T,P) and τα(T,P) can be determined from the same scan of the imaginary part of dielectric permittivity ε″(f), using the BDS. This fact essentially reduces biasing artifacts. There is broad experimental evidence supporting the validity of FDSE eqn (4), (8) and (9) and showing that the exponent 0.75 < S < 0.9.2,10,16–26,37–41 Psurek et al.20,23,24 indicated a possible pressure–temperature isomorphism for the FDSE behavior, namely:
| σ(T,P)τα(T,P)1−μ = const, 1 − μ = S | (13) |
When discussing the FDSE behavior in glass forming ultraviscous liquids, it is worth recalling that the challenging compilation of experimental data for 50 glass forming liquids focused on the normalized version of the FDSE eqn (4).8 For all liquids in the ultraviscous domain the same ‘universal’ FDSE exponent ζ ≈ 0.85, i.e. ω ≈ 0.15 was obtained.8 This analysis included glycerol, which is the object of this paper. It is notable that linking eqn (3), (4) and (8), one obtains:
 | (14) |
Generally the pressure counterpart of the SA eqn (1) is given by:2,13,42
 | (15) |
It can be called super-Barus (SB), because the basic equation proposed by Barus44x(P) = xP0![[thin space (1/6-em)]](https://www.rsc.org/images/entities/char_2009.gif) exp(cP) can be rewritten as ΔVxa/RT = c = const. The SA eqn (1) enables the determination of the apparent activation enthalpy using ΔHxa(T)/R = d
exp(cP) can be rewritten as ΔVxa/RT = c = const. The SA eqn (1) enables the determination of the apparent activation enthalpy using ΔHxa(T)/R = d![[thin space (1/6-em)]](https://www.rsc.org/images/entities/char_2009.gif) ln
ln![[thin space (1/6-em)]](https://www.rsc.org/images/entities/char_2009.gif) x(T)/d(1/T).45–47 Following ref. 2 and 45–47 the SB eqn (15) gives the apparent activation volume by ΔVxa(T)/R = d
x(T)/d(1/T).45–47 Following ref. 2 and 45–47 the SB eqn (15) gives the apparent activation volume by ΔVxa(T)/R = d![[thin space (1/6-em)]](https://www.rsc.org/images/entities/char_2009.gif) ln
ln![[thin space (1/6-em)]](https://www.rsc.org/images/entities/char_2009.gif) x(T)/d(1/T). Then, based on the FDSE eqn (13) one obtains:
x(T)/d(1/T). Then, based on the FDSE eqn (13) one obtains:
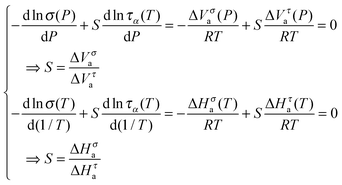 | (16) |
 | (17) |
 | (18) |
 | (19) |
Despite the success of the VFT equation in empirical applications and model analysis,2–4,12,13 its general fundamental validity has been questioned recently.5,46,47 However, glycerol can be encountered in the limited group of materials where the VFT parameterization remains valid.47 With the SA and SB behavior inherently associated with the concept of fragility, it is one of the most prominent ideas within the glass transition physics field.2,4,12,13 The fragility constitutes the metrics of the ‘degree’ of the SA or SB behavior over basic Arrhenius or Barus ones. It is defined by the temperature related isobaric fragility (eqn (2)) and for the isothermic, pressure related path as: mT=const = [d![[thin space (1/6-em)]](https://www.rsc.org/images/entities/char_2009.gif) log10
log10![[thin space (1/6-em)]](https://www.rsc.org/images/entities/char_2009.gif) x(P)/d(P/Pg)]P=Pg.13,45,48,49
x(P)/d(P/Pg)]P=Pg.13,45,48,49
In ref. 45 following the links between x(T,P), experimental data and basic parameters describing SA or SA dynamics were derived:
d![[thin space (1/6-em)]](https://www.rsc.org/images/entities/char_2009.gif) ln ln![[thin space (1/6-em)]](https://www.rsc.org/images/entities/char_2009.gif) x(T)/d(1/T) = ΔHxa/R = Tmp/log10 x(T)/d(1/T) = ΔHxa/R = Tmp/log10![[thin space (1/6-em)]](https://www.rsc.org/images/entities/char_2009.gif) e for P = const e for P = const | (20) |
d![[thin space (1/6-em)]](https://www.rsc.org/images/entities/char_2009.gif) ln ln![[thin space (1/6-em)]](https://www.rsc.org/images/entities/char_2009.gif) x(P)/dP = ΔVxa/RT = mT/log10 x(P)/dP = ΔVxa/RT = mT/log10![[thin space (1/6-em)]](https://www.rsc.org/images/entities/char_2009.gif) e for T = const. e for T = const. | (21) |
 | (22) |
Experimental
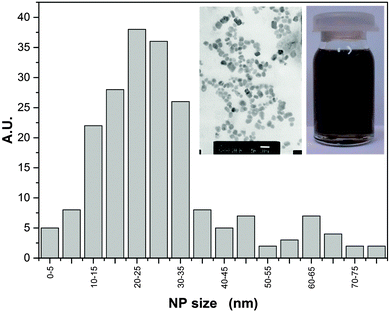
A fluid nanocomposite–nanocolloidal mixture with the concentration reaching 180 ppm of Ag NPs in glycerol was prepared at the Institute of Superhard Materials in Kiev, Ukraine. It is notable that no additional chemicals or surfactants were needed to stabilize the nanocolloid and to avoid the sedimentation. Ag NP were synthesized using the localized ion-plasma sputtering and immediate implantation of freshly created NPs to the carrier liquid in vacuum which allows highly concentrated stable dispersions of ultra clean metal nanoparticles in various carrier liquids to be produced.50 The size distribution of the NPs, averaged at ∼25 nm was below 2%, which is shown in Fig. 1. The concentration of Ag NP (180 ppm) was the highest for which long-term stability (at least one year) was reached, without the addition of any other component. However, a further increase of NP concentration led to their aggregation. Fig. 1 also contains two photographs: (i) the bottle with the nanocolloid and (ii) the scanning electron microscopy (SEM) image (ambient conditions). For the latter, the view was influenced by the preparation for the SEM treatment and the fact that several layers of Ag NPs are ‘collected’ on a plate.The quality of NPs was comparable with the ultraclean solutions produced by laser ablation in liquids but the combined ion plasma sputtering demonstrated much higher productivity and cost effectiveness.50,51 Nevertheless, immediately prior to measurements the Ag nanocolloid samples were mixed ultrasonically for few hours, to preserve the uniform dispersion of the NPs.
Dynamics of the pressurized glycerol and the Ag–glycerol nanocolloid were tested using the piston-based high pressure set-up, described in ref. 52. The gap of the flat parallel measurement capacitor was equal to 0.2 mm. The macro size of the gap made it possible to reduce parasitic artifacts associated with gas bubbles, finite dimensions or very large intensities of the measurement electric field, which appears for micrometric gaps.
The BDS spectrum was monitored using the Novocontrol BDS Alpha spectrometer giving permanent six number resolution for imaginary and real parts of the dielectric permittivity. This paper focuses on the pressure evolution of DC conductivity σ and the primary relaxation time τα. The latter was estimated directly from the peak frequency of the dielectric loss curves from τα = 1/2πfpeak = 1/ωpeak. The DC conductivity from the low frequency increased by the dependence: ε″(f) = σ/ε0ω.2,12 Typical BDS spectra obtained and analyzed in this research were characteristic both for temperature and pressure studies, and are shown in Fig. 2.
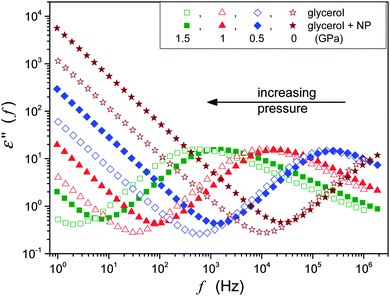 | ||
| Fig. 2 The behavior of the imaginary part of the dielectric permittivity in glycerol and glycerol + Ag NP nanocolloid. Notable is the increasing impact of Ag NPs on compression. | ||
It is worth stressing that the BDS offers unique possibilities of high resolution studies both versus temperature at atmospheric pressure and under high hydrostatic pressures. Furthermore, the fact that both σ(T,P) and τ(T,P) data can be determined from the same ε″(f) scan notably reduces biased results and artifacts. So far, BDS studies under high pressures are limited to frequencies: f < 1 = 10 MHz, and this is because of still unresolved technical problems.13 Nevertheless this frequency/time domain clearly correlates with the range of the ultraviscous/ultraslowing domain in the glass forming systems. There is broad evidence from BDS studies under atmospheric pressure focused on FDSE eqn (3) and (9),2,13,16–41 but surprisingly there are still no results for glycerol, which is one of the accepted glass forming liquids. This can be associated with the fact that glycerol can be encountered as, so called, strong glass formers, for which the clear manifestation of the SB behavior needs to be studied at pressures well above the moderate range of pressures used so far.
This paper presents the results of the first ever FDSE focused test entering the multi GPa domain. High pressure BDS studies were carried out using the innovative piston-based method for the T ≈ 258 K isotherm, which is well below the room temperature tests that have dominated so far.17–24 For the selected isotherm the ‘glass pressure’ can be estimated as Pg = 1.95 GPa, using the Tg(Pg) diagram presented in ref. 53. The precision of pressure estimation was equal to 1 MPa and 0.02 K for temperature. All the results were reversible, i.e., they could be obtained both on cooling and heating as well as after compression and decompression. It is notable that earlier FDSE pressure studies were limited to very fragile (strongly SB) glass formers for which applied (moderate) pressures were able to induce significant changes of the timescale.2,10–26,30,39 For the results presented next, a similar timescale was also obtained for glycerol, because of the extension of the range of pressures, to challenge 1.5 GPa. There have been no reports regarding FDSE behavior in nanocolloids/nanocomposites up to this time.
Results and discussion
This paper focuses on the FDSE behavior in the nanocolloid composed of glycerol and Ag NPs. The ‘background’ behavior in ultraviscous glycerol, which has been lacked so far, is also discussed.Fig. 3 shows the pressure evolution of primary relaxation times and DC electric conductivity in glycerol and its nanocolloid with Ag NPs under compression, and the results are in agreement with those of Fig. 2. The addition of NPs notably increases electric conductivity (Fig. 3a, ∼decade) and decreases the primary relaxation time (Fig. 3b, ∼half a decade). The same pattern is also obtained for the temperature behavior under atmospheric pressure.
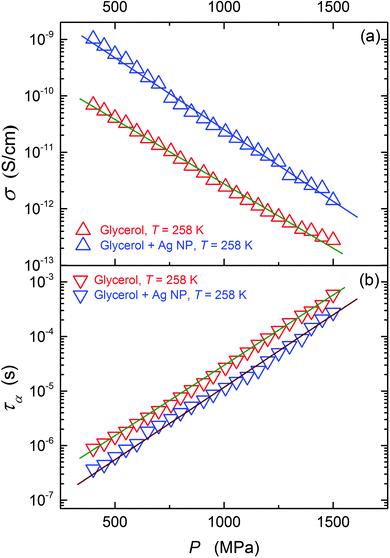 | ||
| Fig. 3 The pressure evolution of the primary relaxation time (τ) and DC conductivity (σ) for pure glycerol and glycerol + Ag NP composite. | ||
The large enhancement in the thermal conductivity and electric conductivity when even a small amount of metallic and other nanoparticles is dispersed is well evidence for lots of systems.54–58 These extraordinary features have led to a set of innovative applications and to the emergence of a fluid for which there is potentially a large area of practical applications and a new area of research called ‘nanofluidics’.59 Several efforts have been made to explain conductivity enhancements in fluids because of the addition of NPs. However, there has been no general consensus on this issue despite their practical significance.56–59 No ultimate theoretical model is available to predict nanofluid viscosity with good accuracy.58,59 Generally, the addition of NPs increases the viscosity of the resulting nanofluid, which is linked to the aggregation of the NPs.59 However, in viscous heavy oils adding NPs can notably reduce the viscosity.60–62 This unique behavior is indicated as being particularly important for the petroleum industry.60 Following eqn (4) and (6) the same pattern may be expected for viscosity and primary relaxation time. For the latter, the direct experimental evidence is very poor. Nevertheless, for a few ‘dense’ fluid systems the atypical increase of electric conductivity matching the decrease of the primary relaxation time have been reported.61–64 This paper presents the first ever results for an ultraviscous glass forming nanocolloid/nanofluid, supercooled and superpressed.
Generally, in very viscous and ultraviscous systems the self-aggregation of the NPs can be difficult and the ultrasonication can further support the stable and homogeneous dispersion of the NPs. Consequently, the self-aggregation most often observed in ‘typical’ nanofluids can be limited or even avoided. The behavior of the ultraviscous liquids near the Tg is dominated by the emergence of ‘dynamic heterogeneities’ with a larger density than the fluid-like surrounding and even possible elements of the structural arrangements.2 This can cause the collection of NPs on the border of solid-like heterogeneities and the fluid-like surroundings and subsequently the fragmentation of the ‘heterogeneities’. Consequently, a smaller number of molecules is located within the heterogeneities which can lead to a decrease of the average rotational relaxation time and can also support the decrease of the viscosity. The hypothetical string-like arrangements of the DHs in the ultraviscous domain near the Tg2 can facilitate string-like arrangements of NPs. Such behavior can support larger electric and heat conductivity. The decrease of viscosity can also be supported by the appearance of string-like, elongated mesoscale structures in a similar way as in the addition of a selected polymer to a fluid. It is notable that the increase of electrical conductivity matched the decrease of the relaxation time and viscosity and was observed in NP doped liquid crystals,63,64 in which the behavior was dominated by multimolecular, pretransitional fluctuations.65
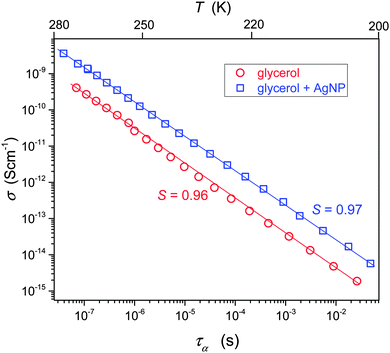
Fig. 4 shows the interplay between the translational and orientational dynamics in pure and Ag NP doped glycerol. The analysis shows that in glycerol for TB < T < Tg the FDSE exponent S ≈ 1. Thus, in glycerol alone, a negligible decoupling between the DC conductivity and the relaxation time takes place. This behavior is atypical, when comparing it with the dominating evidence for other glass forming liquids, indicating that S < 1 for the ultraviscous region.
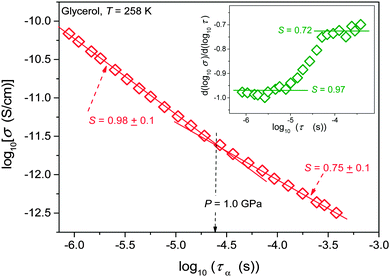
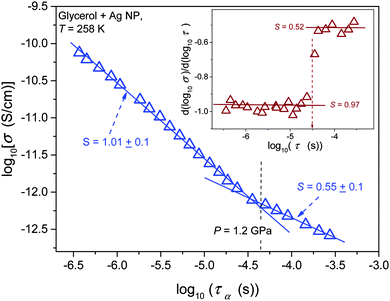
Results of the analysis of the translational–orientational decoupling on compressing up to P = 1.5 GPa are presented in Fig. 5 for glycerol and in Fig. 6 for the nanocolloid. For glycerol up to P ∼ 1 GPa the FDSE exponent S ≈ 1, i.e., the behavior resembles the behavior observed under atmospheric pressure. However, on further pressurization towards the glass transition the gradual translational–orientational decoupling towards the exponent S ≈ 0.75 occurs. For glycerol plus Ag NP nanocolloid this transformation is ‘sharp’ and occurs at a well-defined pressure P ≈ 1.2 GPa, where a jump from S ≈ 1 to an extremely decoupled FDSE behavior at S ≈ 0.5 takes place.
The FDSE behavior observed under pressure can be correlated with the broadening of the primary relaxation loss curves, as shown in Fig. 7. Up to P ≈ 1 GPa, a clear superposition of loss curves takes place. For higher pressures the broadening, both for the high- and low-frequency branches of loss curves, also occurs.
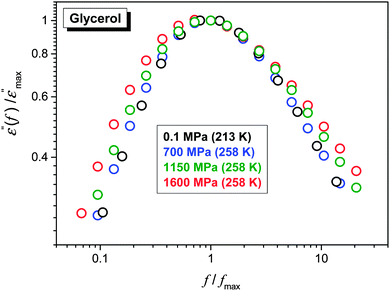 | ||
| Fig. 7 Normalized superposition of dielectric loss curves ε″(f) for ultraviscous glycerol under various pressures. | ||
The comparison of ε″(f) evolution in Fig. 2 and 7 enables a qualitative explanation of FDSE coupling/decoupling manifested by eqn (4) and (13). In Fig. 1 the primary relaxation time is determined from coordinates of the loss curve peak as τ = 1/ωm = 1/2πfpeak and the DC electric conductivity is using the plot: y = log10![[thin space (1/6-em)]](https://www.rsc.org/images/entities/char_2009.gif) ε″(log10
ε″(log10![[thin space (1/6-em)]](https://www.rsc.org/images/entities/char_2009.gif) f) = ax + b = a(log10
f) = ax + b = a(log10![[thin space (1/6-em)]](https://www.rsc.org/images/entities/char_2009.gif) f) + b with the slope a = 1, from the linear behavior in the low frequency part of the spectrum. If the low frequency branch of ε″(f) loss curves do not change, the shift of σ(T,P) exactly follows the shift of τ(T,P) on cooling or pressurization. However, the broadening of ε″(f) on cooling or pressuring the loss curve induces an extra shift of σ(f), which can result in FDSE decoupling by eqn (13).
f) + b with the slope a = 1, from the linear behavior in the low frequency part of the spectrum. If the low frequency branch of ε″(f) loss curves do not change, the shift of σ(T,P) exactly follows the shift of τ(T,P) on cooling or pressurization. However, the broadening of ε″(f) on cooling or pressuring the loss curve induces an extra shift of σ(f), which can result in FDSE decoupling by eqn (13).
Conclusions
Glycerol is a versatile material because of its enormous significance in a variety of applications ranging from biotechnology to pharmaceuticals, cosmetics, ‘green and biodegradable’ plastics, textiles and foodstuffs.66–69 Glycerol and Ag NP based nanocolloids/nanocomposites are important in these applications because of the well-known antimicrobial activity of Ag NPs.70,71From the fundamental point of view, glycerol has a simple molecular structure, large permanent dipole moment and a relatively small electric conductivity, which coincides with the preferred features for the BDS monitoring.12 It can be also very easily supercooled. All these reasons mean that glycerol is used as a model ‘classical’ system in glass transition studies.2,12,13 This paper also presents the first ever experimental report of FDSE behavior in a nanocolloid–nanocomposite system. Also the range of high pressure implemented is considerably higher than that used in earlier studies. The key result of the paper is the crossover from the almost coupled (DSE) to the strongly decoupled (FDSE) behavior for the pressurized glycerol and glycerol-based nanocolloid in the vicinity of the glass transition. For the extremely decoupled state associated with S ≈ 0.5, which is probably the lowest value of the FDSE exponent detected so far, the crossover takes place within the non-ergodic ultraviscous domain where so far it was observed solely for the transition into the ultraviscous domain (ergodic–non-ergodic transformation) at much larger distances from the glass transition. The crossover within the pressurized ultraviscous domain takes place both for the ‘pure’ pure glycerol (S ≈ 1 → S ≈ 0.7) and glycerol + Ag NP nanocolloid (S ≈ 1 → S ≈ 0.5). For the latter it took place for one, well-defined pressure. Thus, the presence of NPs leads to a qualitative enhancement of manifestations of this phenomenon. The explanation of origin of this phenomenon needs further experimental studies to follow the NPs in the immediate vicinity of the glass transition under high pressure, which in fact is beyond the current experimental state-of-the-art. New possibilities can be opened using advanced microscopic observations of highly compressed liquids, based on the set-up currently built in the lab of the authors. One speculative explanation can be related to better definition of heterogeneities because of the inclusion of NPs. Their possible chain-like arrangements can create elements of uniaxial, orientational ordering within heterogeneities. As shown recently, the fragility is proportional to the parameter n describing the local, symmetry m ∝ n, with 0.2 < n < 1.5: the lower value is for the dominated positional ordering, the upper limit is for the clearly orientated case and n = 1 is for the ‘no-symmetry’ case. It is also seen that pressurization notably increases density (for glycerol in the GPa domain down to 20%), thus decreasing the inter-particle distances which can facilitate the ordering of the Ag NPs. It is also worth recalling Fig. 7 and the discussion nearby which indicates the link of the decrease of the FDSE exponent near the glass temperature to the broadening of the distribution of the primary relaxation time, which is strongly linked to the enhancement of the appearance of the dynamic heterogeneities.
It is noteworthy that the analysis based on D(T), η(T) and experimental data indicated for glycerol FDSE exponent ζ ≈ 0.85 (eqn (4)),8 the value suggested as universal ones for the ultraviscous domain. The results in this paper do not confirm this finding. It has been found that glycerol exhibits a unique behavior: (i) first, there is no change of FDSE exponent when passing the dynamic crossover point, namely S ≈ 1 both below and above (TB,PB), (ii) a new (not observed so far) crossover to the behavior governed by S < 1 occurs already within the ultraviscous domain, particularly under high compression and (iii) the presence of Ag NPs in the glycerol notably strengthens the features related to the FDSE domain emerging in the immediate vicinity of the glass transition.
The simple analysis based solely on SA and SB relationships and the general FDSE dependences yielded a new link between the FDSE exponent S and temperature and pressure related fragilities indicating that for the mσT = SmτT and mσP = SmτP. The larger fragility coefficient for primary relaxation time related processes are in agreement with the above fundamental findings discussed by Sokolov and Schweitzer.43 Worth stressing is the link obtained of the FDSE exponent to the apparent activation enthalpy and volume.
In conclusion, this report shows new features of translational–orientational decoupling dynamics emerging from the impact of very high pressures on ultraviscous glycerol and the formation of an Ag NP based nanocolloid. The report also indicates that some basic features of the decoupling can be deduced from the general SA, SB and FDSE equations.
Acknowledgements
Research by SJR was carried out with the support of the National Science Centre (Poland) grant No. 2011/01/B/NZ9/02537. The research by ADR and SSz was supported by the National Centre for Science (Poland), grant No. UMO 2011/03/B/ST3/02352.References
- D. Kennedy, Science, 2005, 309, 83 CrossRef PubMed.
- K. L. Ngai, Relaxation and Diffusion in Complex Systems, Springer, Berlin, 2011 Search PubMed.
- R. A. L. Jones, Soft Condensed Matter Physics, Oxford Univ. Press, Oxford, 2002 Search PubMed.
- C. A. Angell, Strong and fragile liquids, in Relaxations in Complex Systems, ed. K. L. Ngai and G. B. Wright, National Technical Information Service, U.S. Dept. of Commerce, Springfield, 1985 Search PubMed.
- J. C. Martinez-Garcia, S. J. Rzoska, A. Drozd-Rzoska, S. Starzonek and J. C. Mauro, Sci. Rep., 2015, 5, 8314 CrossRef CAS PubMed.
- A. L. Agapov, V. N. Novikov and A. P. Sokolov, in Fragility and other properties of glass-forming liquids: two decades of puzzling correlations, Fragility of glass forming liquids, ed. L. A. Greer, K. F. Kelton and S. Sastry, Hindustan Book Agency, 2013 Search PubMed.
- A. I. Nielsen, S. Pawlus, M. Paluch and J. C. Dyre, Philos. Mag., 2008, 88, 4101–4108 CrossRef CAS PubMed.
- F. Mallamace, C. Branca, C. Corsaro, N. Leone, J. N. Spooren, S.-H. Chen and H. E. Stanley, Proc. Natl. Acad. Sci. U. S. A., 2010, 28, 22457–22462 CrossRef PubMed.
- M. A. Anisimov, Critical Phenomena in Liquids and Liquid Crystals, Gordon and Breach, Reading, 1992 Search PubMed.
- V. N. Novikov and A. P. Sokolov, Phys. Rev. E: Stat., Nonlinear, Soft Matter Phys., 2003, 67, 031507 CrossRef CAS.
- P. J. Griffin, J. R. Sangoro, Y. Wang, A. P. Holt, V. N. Novikov, A. P. Sokolov, M. Paluch and F. Kremer, Soft Matter, 2013, 43, 10373–10380 RSC.
- F. Kremer and A. Schoenhals, Broadband Dielectric Spectroscopy, Springer Verlag, Berlin, 2003 Search PubMed.
- G. Floudas, M. Paluch, A. Grzybowski and K. L. Ngai, Molecular Dynamics of Glass-Forming Systems: Effects of Pressure, Springer, Berlin, 2012 Search PubMed.
- K. A. Dill and S. Bromber, Molecular Driving Forces: Statistical Thermodynamics in Chemistry and Biology, Garland Science, London, 2011 Search PubMed.
- J. C. Dyre, Rev. Mod. Phys., 2006, 78, 953–972 CrossRef CAS.
- L. Andreozzi, A. Di Schino, M. Giordano and D. Leporini, Europhys. Lett., 1997, 38, 669–674 CrossRef CAS.
- S. Corezzi, M. Lucchesi and P. A. Rolla, Philos. Mag. B, 1999, 79, 1953–1963 CrossRef CAS PubMed.
- S. Hensel Bielowka, T. Psurek, J. Ziolo and M. Paluch, Phys. Rev. E: Stat., Nonlinear, Soft Matter Phys., 2001, 63, 062301 CrossRef.
- P. G. Debenedetti, T. M. Truskett and C. P. Lewis and F. H. Stillinger, Theory of supercooled liquids and glasses. Energy Landscape and Statistical Geometry Perspective, Advances in Chemical Engineering, Academy Press, Princeton, 2001, vol. 28, pp. 21–30 Search PubMed.
- M. Paluch, T. Psurek and C. M. Roland, J. Phys.: Condens. Matter, 2002, 14, 9489–9494 CrossRef CAS.
- M. Paluch, C. M. Roland, J. Gapinski and A. Patkowski, J. Chem. Phys., 2003, 118, 3177–3186 CrossRef CAS PubMed.
- R. Casalini and C. M. Roland, J. Chem. Phys., 2003, 119, 4052–4059 CrossRef CAS PubMed.
- R. Casalini, M. Paluch, T. Psurek and C. M. Roland, J. Mol. Liq., 2004, 111, 53–60 CrossRef CAS.
- T. Psurek, J. Ziolo and M. Paluch, Physica A, 2004, 331, 353–364 CrossRef CAS PubMed.
- G. P. Johari and O. Andersson, J. Chem. Phys., 2006, 125, 124501 CrossRef CAS PubMed.
- O. Andersson, G. P. Johari and R. M. Shanker, J. Pharm. Sci., 2006, 95, 2406–2418 CrossRef CAS PubMed.
- R. Richertand and K. Samwer, New J. Phys., 2007, 9, 36 CrossRef.
- G. Power, J. K. Vij and G. P. Johari, J. Phys. Chem. B, 2007, 111, 11201–11208 CrossRef CAS PubMed.
- M. G. Mazza, N. Giovambattistam, H. E. Stanley and F. W. Starr, Phys. Rev. E: Stat., Nonlinear, Soft Matter Phys., 2007, 76, 031203 CrossRef.
- S. Pawlus, M. Paluch, J. Ziolo and C. M. Roland, J. Phys.: Condens. Matter, 2009, 21, 332101 CrossRef CAS PubMed.
- L. Xu, F. Mallamace, Z. Yan, F. W. Starr, S. V. Buldyrev and H. E. Stanley, Nat. Phys., 2009, 5, 565–569 CrossRef CAS PubMed.
- A. Drozd-Rzoska and S. J. Rzoska, Anomalous Decoupling of the dc Conductivity and the Structural Relaxation Time in the Isotropic Phase of a Rod-like Liquid Crystalline Compound, in Metastable Systems under Pressure, ed. S. J. Rzoska, V. Mazur and A. Drozd-Rzoska, Springer, Berlin, 2010, pp. 141–152 Search PubMed.
- G. Sesé, J. O. de Urbina and R. Palomar, J. Chem. Phys., 2012, 137, 114502 CrossRef PubMed.
- K. V. Edmonda, M. T. Elsesserb, G. L. Huntera, D. J. Pinebo and E. R. Weeksa, Proc. Natl. Acad. Sci. U. S. A., 2012, 109, 17891–17896 CrossRef PubMed.
- F. Mallamace, C. Corsaro, N. Leone, V. Villari, N. Micali and S.-H. Chen, Sci. Rep., 2014, 4, 3747 Search PubMed.
- Z. Shi, P. G. Debenedetti and F. H. Stillinger, J. Chem. Phys., 2013, 138, 12526 CrossRef PubMed.
- N. Leone, V. Villari, N. Micali and S.-H. Chen, Sci. Rep., 2013, 4, 3747 Search PubMed.
- J. Swiergiel and J. Jadzyn, Phys. Chem. Chem. Phys., 2011, 13, 3911–3916 RSC.
- Z. Wojnarowska, Y. Wang, J. Pionteck, K. Grzybowska, A. P. Sokolov and M. Paluch, Phys. Rev. Lett., 2013, 111, 225703 CrossRef CAS.
- E. Herold, M. Strauch, D. Michalik, A. Appelhagenand and R. Ludwig, Phys. Chem. Chem. Phys., 2014, 15, 3040–3048 CAS.
- D. A. Turton and K. Wynne, J. Phys. Chem. B, 2014, 118, 4600–4605 CrossRef CAS PubMed.
- Soft Matter under Exogenic Impacts, ed. S. J. Rzoska and V. Mazur, Springer, Berlin, 2007 Search PubMed.
- A. P. Sokolov and K. S. Schweitzer, Phys. Rev. Lett., 2009, 102, 23831 CrossRef.
- C. Barus, Proc. Am. Acad. Arts Sci., 1891, 27, 13–15 CrossRef.
- A. Drozd-Rzoska and S. J. Rzoska, Phys. Rev. E: Stat., Nonlinear, Soft Matter Phys., 2006, 73, 041502 CrossRef.
- J. C. Martinez-Garcia, S. J. Rzoska, A. Drozd-Rzoska and J. Martinez-Garcia, Nat. Commun., 2013, 4, 1823 CrossRef PubMed.
- J. C. Martinez-Garcia, S. J. Rzoska, A. Drozd-Rzoska, J. Martinez-Garcia and J. C. Mauro, Sci. Rep., 2014, 4, 5160 CAS.
- M. Paluch, S. J. Rzoska and J. Zioło, J. Phys.: Condens. Matter, 1998, 10, 4131–4138 CrossRef CAS.
- A. Drozd-Rzoska, S. J. Rzoska and C. M. Roland, J. Phys.: Condens. Matter, 2008, 20, 244103 CrossRef.
- L. Barber and T. Kistersky, Apparatus and method for localized ion sputtering/Publ, US Pat., 5591313, 1997 Search PubMed.
- P. Liu, Y. Liang, H. B. Li and G. W. Yang, Nanomaterials: Applications and Properties, NAP, Beijing, 2011, vol. 1, pp. 136–150 Search PubMed.
- M. Paluch, M. Sekula, S. Pawlus, S. J. Rzoska, J. Ziolo and C. M. Roland, Phys. Rev. Lett., 2003, 90, 175702 CrossRef CAS.
- A. Drozd-Rzoska, S. J. Rzoska, M. Paluch, A. R. Imre and C. M. Roland, J. Chem. Phys., 2007, 126, 164504 CrossRef CAS PubMed.
- S. U. S. Choi, Z. G. Zhang, W. Yu, F. E. Lockwood and E. A. Grulke, Appl. Phys. Lett., 2001, 79, 2252–2254 CrossRef CAS PubMed.
- J. A. Eastman, S. U. S. Choi, S. Li, W. Yu and W. Thompson, Appl. Phys. Lett., 2001, 78, 718 CrossRef CAS PubMed.
- P. Warrier and A. Teja, Nanoscale Res. Lett., 2011, 6, 247–253 CrossRef PubMed.
- I. M. Mahbubul, R. Saidur and M. A. Amalina, Int. J. Heat Mass Transfer, 2012, 55, 874–888 CrossRef CAS PubMed.
- S. B. White, A. Jau-Min Shih and K. P. Pipe, Nanoscale Res. Lett., 2011, 6, 346 CrossRef PubMed.
- S. K. Das, S. U. Choi, W. Yu and T. Pradeep, Nanofluids: Science and Technology, Wiley, NY, 2008 Search PubMed.
- Y. H. Shokrlu and T. Babadagli, J. Pet. Sci. Eng., 2014, 119, 210–220 CrossRef CAS PubMed.
- R. J. Sengwa, S. Choudhary and S. Sankhla, eXPRESS Polym. Lett., 2008, 2, 800–809 CrossRef CAS.
- M. Dong, L. P. Shen, H. Wang, H. B. Wang and J. Miao, J. Nanomater., 2013, 2013, 1–7 CrossRef PubMed.
- S. P. Yadav, M. Pande, R. Manohan and S. Singh, J. Mol. Liq., 2015, 208, 34–37 CrossRef CAS PubMed.
- S. Krishna Prasad, M. Vijay Kumar, T. Shilpa and C. V. Yelamaggad, RSC Adv., 2014, 4, 4453–4462 RSC.
- S. J. Rzoska, A. Drozd-Rzoska, P. K. Mukherjee, D. O. Lopez and J. C. Martinez-Garcia, J. Phys.: Condens. Matter, 2013, 25, 245105 CrossRef PubMed.
- M. Pagliaro and M. Rossi, Future of Glycerol: New Usages for a Versatile Raw Material, RSC, Cambridge, 2008 Search PubMed.
- E. S. Stevens, Green Plastics: An Introduction to the New Science of Biodegradable Plastics, Princeton Univ. Press, Princeton, 2002 Search PubMed.
- F. Gunstone, Oils and Fats in the Food Industry, Wiley & Sons, NY, 2009 Search PubMed.
- J. Choi and J. C. Bishof, Cryobiology, 2010, 60, 49–52 CrossRef PubMed.
- C. Balny and R. Hayashi, High Pressure Bioscience and Biotechnology, Progress in Biotechnology, Elsevier, Amsterdam, vol. 13, 1996 Search PubMed.
- J. A. Lemire, J. J. Harrison and R. J. Turner, Nat. Rev. Microbiol., 2013, 11, 371–384 CrossRef CAS PubMed.
| This journal is © The Royal Society of Chemistry 2015 |

