
 Open Access Article
 This Open Access Article is licensed under a
 Creative Commons Attribution 3.0 Unported Licence
Molecular-level understanding of the adsorption mechanism of a graphite-binding peptide at the water/graphite interface†
M. J.
Penna
ab,
M.
Mijajlovic
a,
C.
Tamerler
c and
M. J.
Biggs
*ad
aSchool of Chemical Engineering, The University of Adelaide, Adelaide, South Australia 5005, Australia
bSchool of Aerospace, Mechanical and Manufacturing Engineering, RMIT University, GPO Box 2476, Victoria 3001, Australia
cDepartment of Mechanical Engineering, University of Kansas, 1530 W 15th Street, 3138 Learned Hall, Lawrence, KS 66045, USA
dSchool of Science, Loughborough University, Leicestershire, UK LE11 3TU. E-mail: m.biggs@lboro.ac.uk
First published on 22nd April 2015
Abstract
The association of proteins and peptides with inorganic material has vast technological potential. An understanding of the adsorption of peptides at liquid/solid interfaces on a molecular-level is fundamental to fully realising this potential. Combining our prior work along with the statistical analysis of 100+ molecular dynamics simulations of adsorption of an experimentally identified graphite binding peptide, GrBP5, at the water/graphite interface has been used here to propose a model for the adsorption of a peptide at a liquid/solid interface. This bottom-up model splits the adsorption process into three reversible phases: biased diffusion, anchoring and lockdown. Statistical analysis highlighted the distinct roles played by regions of the peptide studied here throughout the adsorption process: the hydrophobic domain plays a significant role in the biased diffusion and anchoring phases suggesting that the initial impetus for association between the peptide and the interface may be hydrophobic in origin; aromatic residues dominate the interaction between the peptide and the surface in the adsorbed state and the polar region in the middle of the peptide affords a high conformational flexibility allowing strongly interacting residues to maximise favourable interactions with the surface. Reversible adsorption was observed here, unlike in our prior work focused on a more strongly interacting surface. However, this reversibility is unlikely to be seen once the peptide–surface interaction exceeds 10 kcal mol−1.
Introduction
The interaction of proteins and peptides with inorganic materials is fundamental to the formation of a diverse array of functional materials similar to the ones found in nature such as bone and mollusc shell.1,2 Such natural biological materials are achieved through biomolecule-mediated mineralization.3–5 There is a growing interest in using synthetic peptides to replicate such processes to make materials and systems of technological interest. These synthetic peptides have to date been either de novo designed using supramolecular chemistry approaches6–9 or identified through combinatorial biological protocols,1,10–13 along with, more recently, bioinformatics.14 This ‘biopanning’ approach has been used to identify peptides with affinity for materials as diverse as metals,1,10 semiconductors11 and, of particular interest here, carbon.12,13,15 Further advances in the field would, however, come through a detailed fundamental understanding of the peptide adsorption process,16 particularly on a molecular-level.17,18Eliciting greater fundamental understanding from experiment alone is challenging because the methods do not give explicit molecular-level insight into the nature of the protein adsorption mechanism. Rather, the individual steps in the adsorption processes must be hypothesised from the macroscopic experimental observables (e.g. amount of protein adsorbed as a function of time).1 The challenges in this ‘top-down’ protein adsorption model development approach is reflected in the myriad of such models that have been proposed over the past five or more decades, with much debate still circling around them.19,20 Moreover, these models are also normally underpinned by a range of other assumptions that rarely hold in practice. For example, the ubiquitous Langmuir model21–23 and modifications thereof24–26 assume, amongst other things, no lateral interaction between adsorbed peptides and reversible adsorption. Another common thread of the numerous protein adsorption models is their neglect of the biomolecule behaviour as it approaches the interface; they normally assume contact formation from the bulk phase is a single step process. The mismatch between the model assumptions and reality mean any thermodynamic data derived from them (e.g. free energy of adsorption) should be used with some caution.27
Molecular modelling provides an alternative avenue to generate improved adsorption models and predict thermodynamic properties for protein adsorption. Over the past decade the reports of such modelling of biomolecule adsorption have become increasingly prevalent in the literature.28,29 Numerous reports of the adsorption of biomolecules on sp2 hybridized carbon materials exist with a variety of foci: conformational change of the biomolecule upon adsorption,30–35 quantification of the adsorption propensity of amino acids36 and peptides,37–40 and the influence of interfacial water on the adsorption process,41,42 for example. However, none has attempted to fully describe the molecular adsorption process taking place at the interface between water and graphite, which is of relevance to, for example, physiological response to carbon-based implants and nanomaterials, and peptide-directed self-assembly of carbon-based technologies.43 Rather, by considering the process between what could be termed a ‘semi-adsorbed state’, usually generated via some artificial process, and the final adsorbed state, most molecular simulation studies have focused on elucidating the minutiae of the final stages of the adsorption process. Moreover, by generally considering a small number of simulations (typically less than 10, often not much more than a few) for a given condition, the results are not generalizable in the form of adsorption mechanisms such as those hypothesised via experiment as outlined above.
By undertaking detailed statistical analysis of the results of 110 long (50–200 ns) molecular dynamics (MD) simulations of the adsorption of an experimentally-identified graphite binding peptide (GrBP) from the bulk phase to the water/graphite interface, we elucidate here a peptide adsorption mechanism at the molecular level from the ‘bottom-up’. This work thereby extends the adsorption mechanism described by Penna et al.44 to lower energy surfaces. Implications for the reversibility of biomolecule adsorption at liquid/solid interfaces are also discussed with reference to the limited experimental data.
Methods
Model detail
A total of four separate systems were studied here: (1) adsorption of a graphite binding peptide, GrBP5,12 at the water/graphite interface; (2) the same peptide in the bulk phase; (3) adsorption of phenyl hydroxide and butane, both of which are the sidechain analogues of two of the amino acids of GrBP5 that play a more prevalent role in its adsorption behaviour (tyrosine and isoleucine respectively); and (4) benzene, for reasons that will become clear when we present the results. The models for each are described in the following.The GrBP5 graphite binding peptide has an amino acid sequence of IMVTESSDYSSY, and was identified via phage display as having the highest binding affinity for graphite from a pool of peptides after numerous rounds of bio-panning.12 The peptide can be split into three distinct domains:14 a hydrophobic domain (D-I) containing residues IMV; a hydrophilic domain (D-II) containing residues TESSD; and an aromatic domain (D-III) containing residues YSSY.12 The peptide was represented in the zwitterionic form.
An all-atom representation of the peptide was used with the intra- and inter-molecular interactions being modelled by the CHARMM27 potential.45,46 Water molecules were treated explicitly using the TIP3P water model.47 The density of the water well away from the graphite surface was arranged to be equal to that of bulk water at 298 K and 1 atm. Although a range of graphite planes would have been accessible in the phage display experiments, the basal plane would have certainly been one of the most dominant as graphite preferentially cleaves along this plane to expose it. It was, therefore, used for the work reported here. The graphite was composed of five parallel rigid graphene layers stacked in the A–B–A graphite configuration;48 the solution phase would see this as a semi-infinite block of graphite due to the truncation length of the interaction between them (12 Å) being less than the distance spanned by the five layers (twice 13.4 Å due to periodic boundary conditions). The carbon atoms interacted with the solution phase via a truncated 12-6 Lennard-Jones model with the Steele parameters49 combined with those of the CHARMM potential model using the Lorentz–Berthelot mixing rules.50 The dimensions of the graphite plane were 66.40 × 63.90 Å, whilst the fluid volume above it was 80.2 Å in size. The system contained the peptide, 8100 carbon atoms, approximately 9000 water molecules, and NaCl at 0.15 M.
The bulk phase study of the GrBP5 peptide was done by performing simulations of the peptide model as described above in a water box of approximately 4000 water molecules (∼48 × 48 × 48 Å). The study of the adsorption of the various amino acid sidechain analogues and benzene was undertaken using a system similar to that described for the full peptide excepting the periodic simulation cell was 24.6 × 25.6 × 49.4 Å in size, containing the solute molecule, 1000 carbon atoms and approximately 600 water molecules.
Adsorption simulation details
Molecular dynamics (MD) simulation as implemented in NAMD51 was used for all the work reported here. In all simulations, a cut-off distance of 12 Å was applied for non-bonded interactions with switching applied between 10 and 12 Å. Long range electrostatic interactions were treated using the particle-mesh Ewald method.52 A timestep size of 2 fs was similarly used in all simulations; this was made possible by fixing the O–H bond lengths of the water molecules using the SHAKE algorithm.53NPT simulations were undertaken using a Langevin thermostat54 and piston to control the temperature and pressure, respectively. The NVT simulations were undertaken using a Langevin thermostat with a damping coefficient of 1 ps−1 to control the temperature.The bulk phase simulations of GrBP5 were all undertaken in the NPT ensemble at 298 K and 1 bar for around 100 ns. In the adsorption simulations, the water volume above the graphite surface was first prepared at 1 bar and 298 K in the absence of the peptide via a 1 ns NPT simulation. This formed the basis for all the adsorption simulations. An arbitrary peptide conformation was taken from the NPT simulation of the peptide in the bulk phase and inserted above the centre of the graphite surface such that its centre of mass (CoM) was 25 Å above the first layer of the graphite surface. Any water molecules overlapping the peptide following its insertion were eliminated and the height of the simulation cell was adjusted marginally to ensure the density of the water 15 Å or more from the graphite surface was equal to that of bulk water at 298 K and 1 atm. The system was then subject to local relaxation at 0 K before heating up to 298 K in an NVT MD simulation of 300k timesteps. The peptide was constrained within the vicinity of its initial insertion point during this phase of the simulation by a harmonic constraint attached to its CoM. A single NVT simulation was then run with the harmonic constraint still attached to generate the 110 starting configurations for the adsorption simulations, each separated by 0.5 ns. The adsorption simulations, which were started by releasing the harmonic constraint, were all undertaken in the NVT ensemble at 298 K for between 25–100 million timesteps (i.e. 50–200 ns) depending on the time taken to move from the starting point to the final adsorbed state.
Statistical analysis of adsorption events
Results from the 110 adsorption simulations were subject to extensive statistical analysis. This involved separating the region between the bulk phase and the solid surface (the ‘interface’) into three distinct regions based on the height of water layers above the solid surface, as illustrated in Fig. 1. The ‘interfacial association’ region (B) ranged over 7.5 to 9 Å, the ‘anchoring’ region (C) was considered to be 4.5 to 7.5 Å, and the ‘contact’ region (D) was assigned a height range of 0 to 4.5 Å. A residue or terminal group was considered to have achieved interfacial association if a minimum of 3 atoms remained within the region B for 10 ps. When this occurred an interfacial association event was attributed to that residue. A group was considered to have disassociated from the interface if all atoms were found outside this range. If the same group was found to have re-associated with the interface within 100 ps of disassociation this was considered to be the same event and no additional association event was attributed to that group. This was done due to the strict cut off distances used to define the interfacial association range and helps smooth the statistics with respect to numerous events of very short time span closely grouped together. If an association event for a group was observed to occur less than 100 ps after a disassociation of another group these were deemed to also be part of the same event, a ‘combined’ event, and the event was evenly distributed amongst all groups which met this requirement. Identical treatment was given to anchoring and contact events.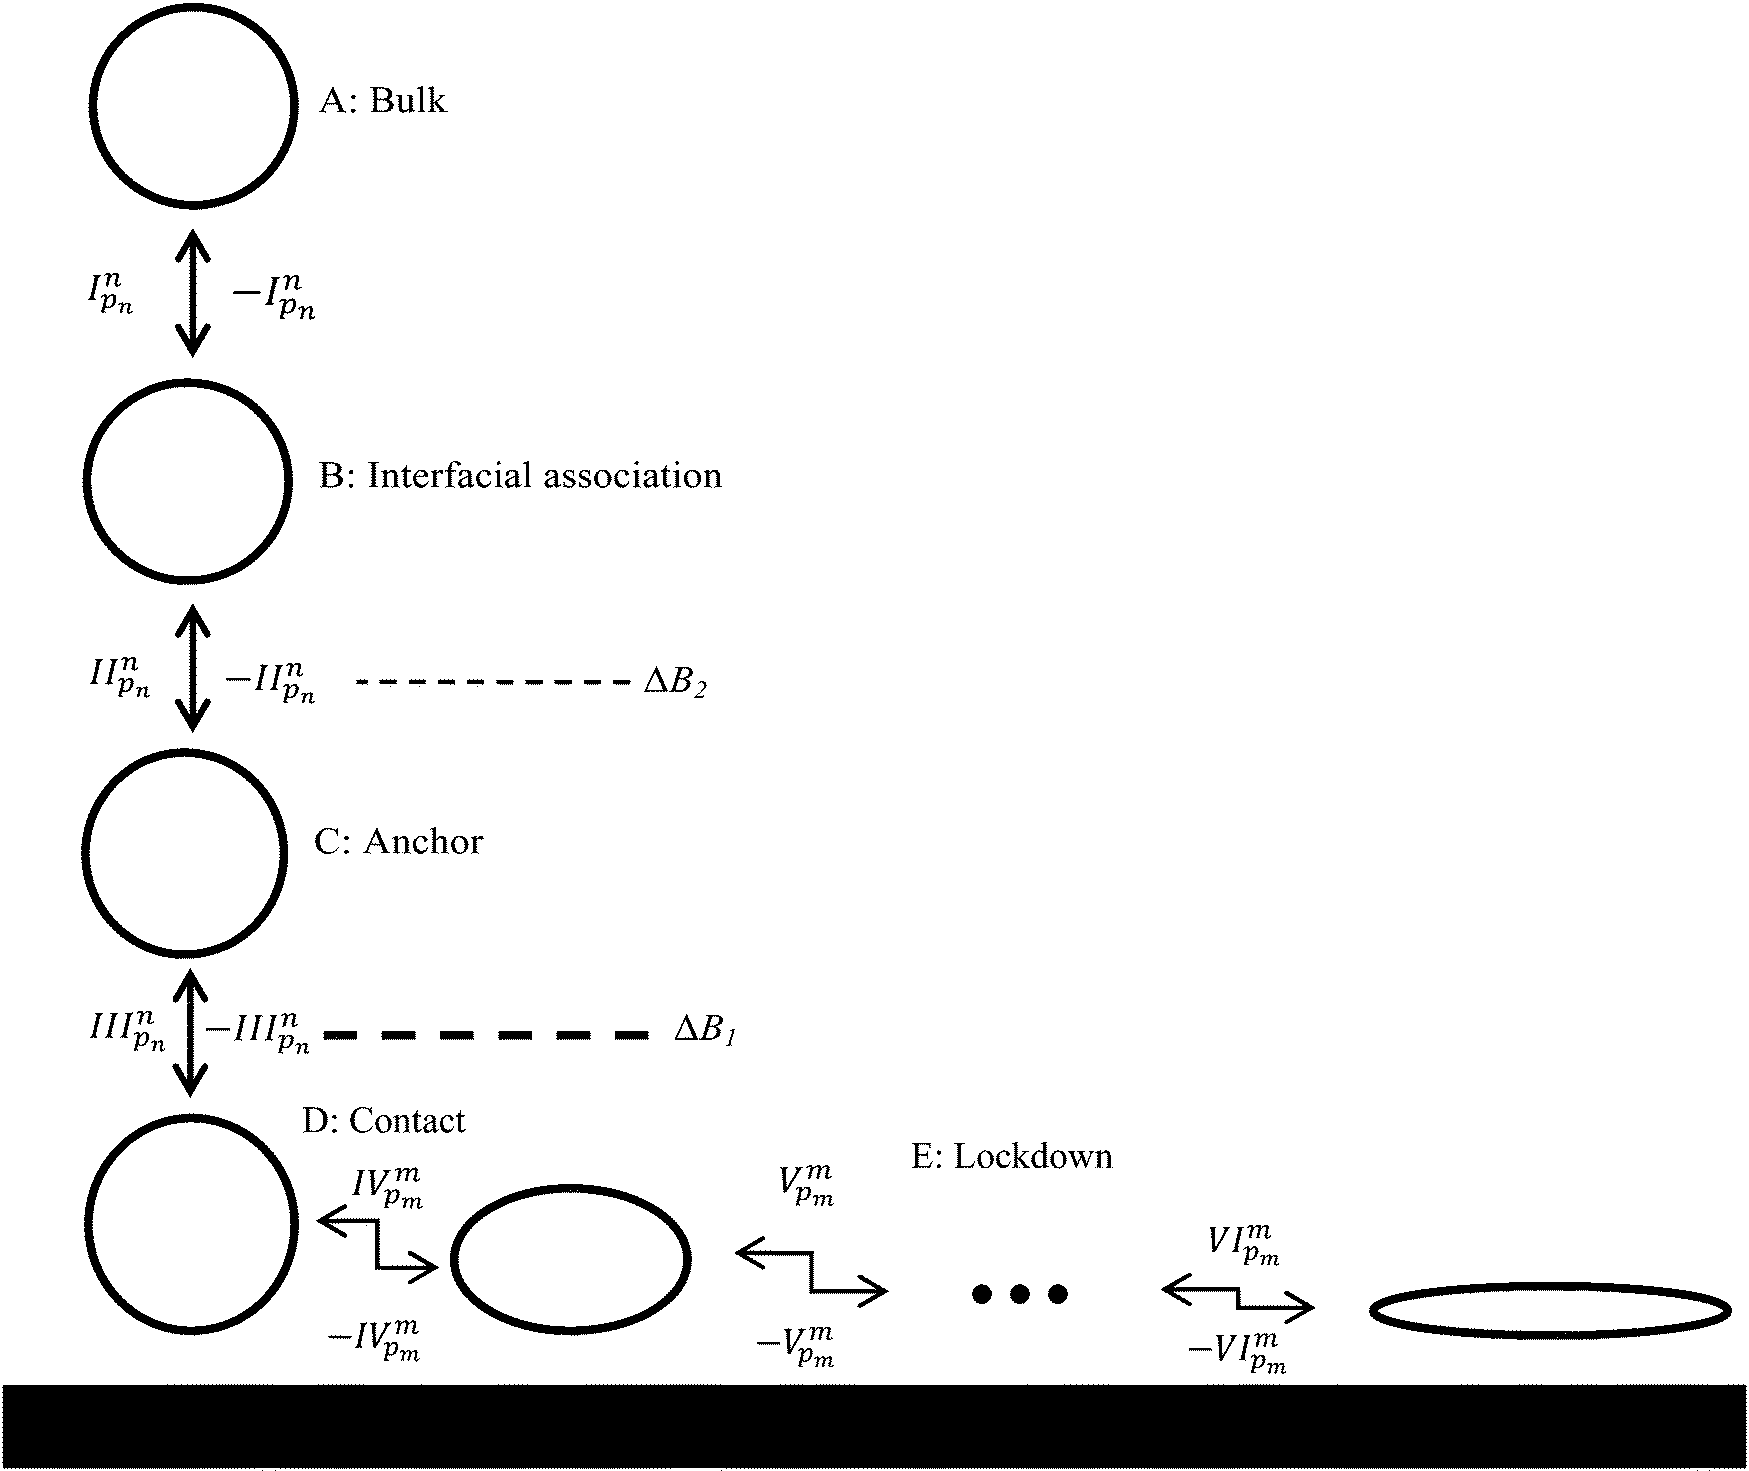 | ||
| Fig. 1 Proposed adsorption model for peptides at liquid/solid interfaces: I reversible biased diffusion process44 taking the peptide, or a region thereof, from bulk solvent to the liquid/solid interface; II reversible ‘anchoring’ process44 where some region(s) of the peptide penetrate the second interfacial water layer; III reversible ‘contact initiation’ between a region of the peptide and solid surface atoms (this is termed ‘lockdown initiation’ in our previous work44 focused on more strongly interacting surfaces where reversibility was not observed); IV to VI the ‘lockdown’ process where the peptide rearranges itself to bring an increasing fraction of the peptide into direct contact with the solid surface in a lock-step manner (this process was essentially irreversible in our previous work44). The ●●● in the lockdown phase indicates the possibility of a number of steps required in this phase. Dashed lines signify energy barriers to adsorption, with the magnitude of the barrier qualitatively indicated by the line thickness. Energy barriers in the lockdown phase have been omitted for clarity. The possibility for the peptide to diffuse in the plane parallel to the surface during the lockdown phase is not shown. | ||
Free energy profile evaluation details
The free energy profiles for benzene, phenyl hydroxide and butane were generated using the procedure outlined in Penna et al.39 The starting point for the steered MD (SMD) simulations were taken from adsorption simulations for the molecules, which were undertaken in the same way as for the peptide except for their length, which were much shorter due to the smaller molecule size (two simulations of 100 ns each for both benzene and phenyl hydroxide; a single simulation of 100 ns for butane). The SMD simulations involved pulling the initially adsorbed molecules normally away from and towards the graphite surface at a constant speed of vz = 0.1 m s−1via a spring of stiffness k = 10 kcal mol−1 Å−2 connected to the molecule CoM.Results and discussion
Proposed adsorption model
To aid in the discussion of results we present in Fig. 1 a generalised adsorption mechanism for a protein at a liquid/solid interface. The vertical component shows the transition of the protein (or region(s) of), represented as a globular mass for clarity, through a number interfacial water layers in a series of steps until it achieves direct contact with the solid surface. The dashed lines indicate that each water layer presents a barrier to the peptide migrating towards the surface,44,55 with the magnitude of the barrier increasing from the second to the first water layer (indicated by the line thickness). The superscript to the step indices show that each of the n residues of the biomolecule is capable of instigating a given action (association, anchoring, contact formation) while the subscript indicates that each residue has a varying probability, pn, of doing so. The horizontal component of Fig. 1 combines the finding of our current and prior work that increased surface contact occurs via a stepwise lockdown mechanism44 with the adsorption model of Szollosi et al.56 This illustrates that the adsorbed biomolecule is capable of transitioning though a series of states, each being separated by a free energy barrier. Superscripts in the horizontal component indicate that at each adsorbed state there exist m adjacent states that the biomolecule may transition to with each transition having a probability pm of occurring. Omitted from Fig. 1 for clarity is that the transitions in the horizontal component are biased to some optimal, or collection thereof, low energy adsorbed conformation.56To better elucidate the free energy barriers that exist along the pathway between the bulk phase and solid surface, ΔB2 and ΔB1 in Fig. 1, the free energy profiles for the sidechain analogues of tyrosine and isoleucine (phenyl hydroxide and butane, respectively), which were observed to be amongst the most common of the anchoring and contact initiating peptides, have been determined as shown in Fig. 2. The free energy profile of benzene is also included for reasons that will become clear in the section below entitled ‘Stabilisation of adsorption through interaction with interfacial water’. All profiles exhibit free energy barriers to adsorption due to existence of the interfacial water layers. A local free energy minimum (ΔMC) exists between the 1st and 2nd water layer and a second smaller minimum (ΔMB) is observed above the 2nd water layer.
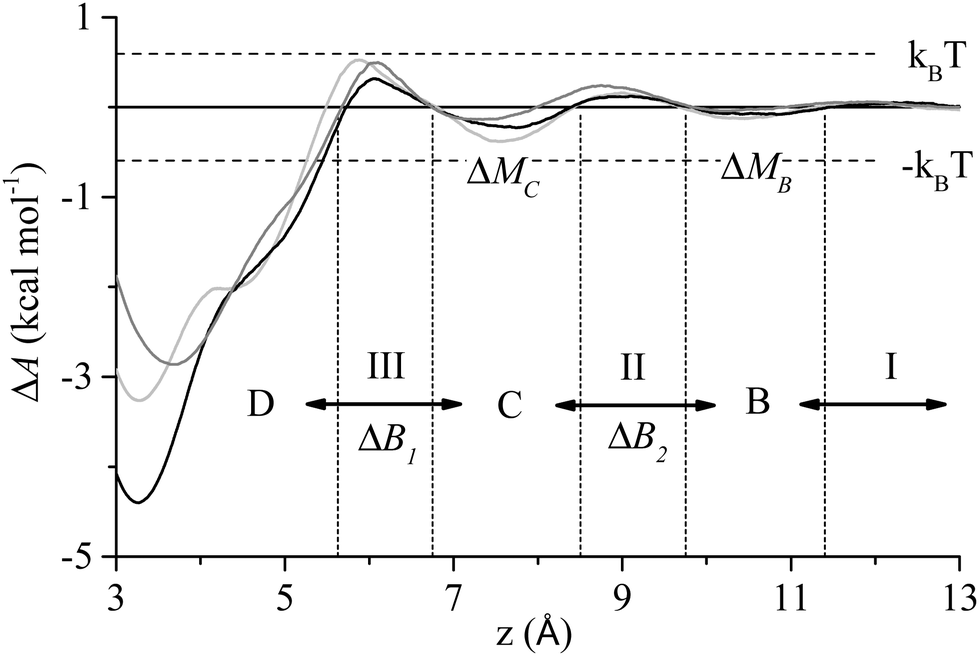 | ||
| Fig. 2 Free energy profile of phenyl hydroxide (black), butane (dark grey) and benzene (light grey) at the water/graphite interface. The events I–III, states B–D, and free energy barriers ΔB1 and ΔB2 from Fig. 1 are also shown along with the free energy minima between the water layer, ΔMB and ΔMC. | ||
Overview of adsorption process
All of the 110 simulations performed for GrBP5 adhered to the generalised adsorption mechanism presented in Fig. 1. To aid in the explanation of key findings reported in the following sections and their relationship to Fig. 1, extracts from an exemplar trajectory are presented in Fig. 3–5. Fig. 3 shows the initial phase of the adsorption process (0 to 25 ns), capturing processes I to III in Fig. 1. Fig. 4 shows the first 30 ns of the lockdown phase (20 to 50 ns) where GrBP5 undergoes stepwise conformational rearrangement as it locks down onto the solid surface (i.e. processes IV, ●●●, VI in Fig. 1). Fig. 5 shows the partial reversibility of the lockdown phase (i.e. processes −VI, ●●●, −IV in Fig. 1) (50–80 ns), highlighting the dynamic nature of the adsorbed state. The exemplar trajectory is shown in full in Fig. S1 and a movie is also provided in the ESI.† Along with commentary relating to the exemplar trajectory, the statistical analysis described in the methods section has been performed over the 110 simulations to identify generalised trends for the adsorption of GrBP5 at the water/graphite interface.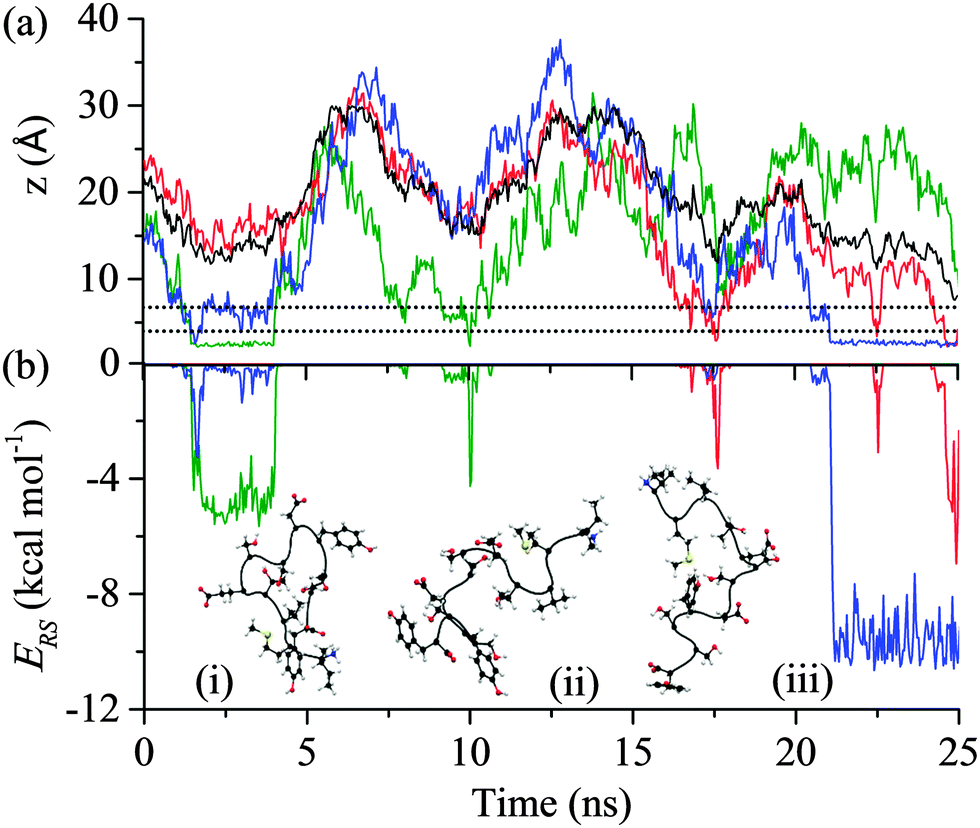 | ||
| Fig. 3 Trajectory of the exemplar MD simulation of GrBP5 adsorption during the initial phase in which the peptide moves from the bulk phase to above the two interfacial water layers (shown as dashed lines): (a) trajectory of the peptide CoM (black), the minimum height above the surface atoms for Ile1 (green), Tyr9 (red) and Tyr12 (blue); and (b) interaction energy between residue and surface, ERS, for Ile1 (green), Tyr9 (red) and Tyr12 (blue) and four events which result in direct contact between a region of the peptide and the solid surface. Inset are snapshots of the peptide at: (i) 2 ns, (ii) 17.5 ns and (iii) 22 ns (the surface underneath and the water have been omitted for simplicity). The residues considered here are those that make initial contact with the interface in this instance and, as shown in Fig. S2 (ESI†), almost exclusively provided the total interaction between the peptide and the surface over the first 25 ns. | ||
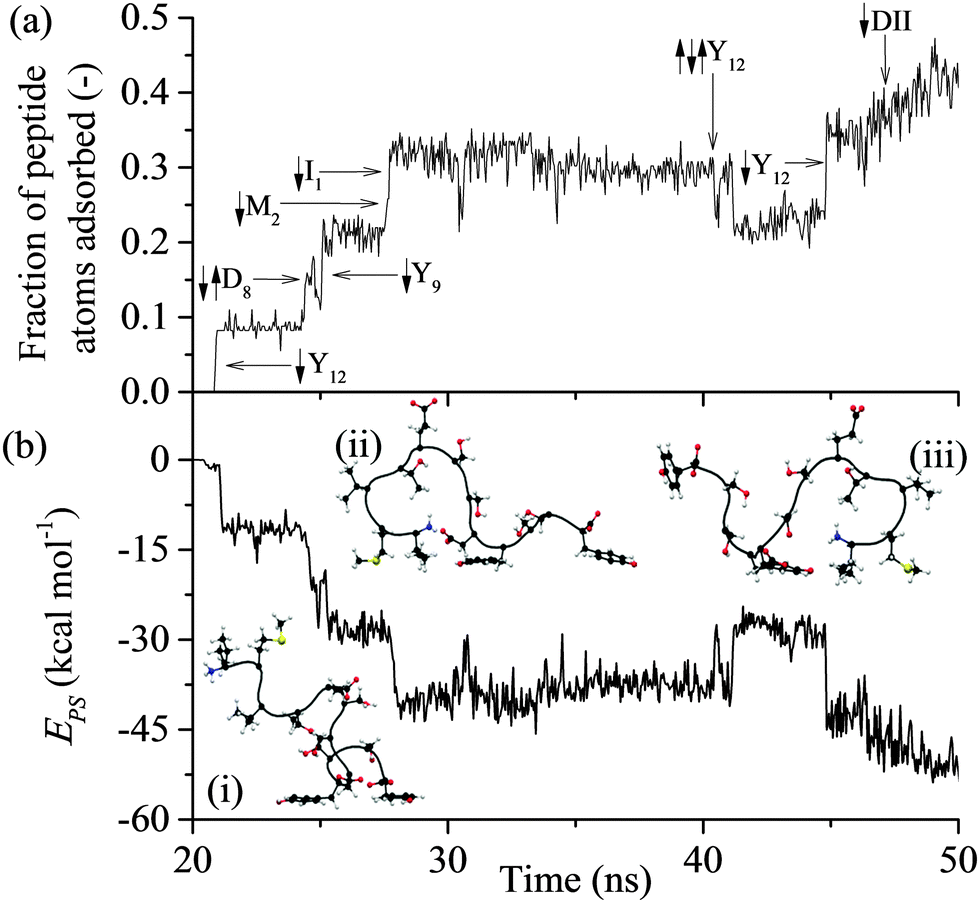 | ||
| Fig. 4 Trajectory of the exemplar MD simulation of GrBP5 adsorption during initiation of the lockdown phase and ongoing lockdown in a step-wise fashion: (a) fraction of peptide atoms in direct contact with the solid surface; (b) total interaction energy between peptide and solid surface, Eps. In (a), direct contact (↓) and break away (↑) of groups from the surface are shown. Snapshots of four adsorbed states are shown in (b) at: (i) 26 ns, (ii) 35 ns, (iii) 43 ns (the surface underneath and the water have been omitted for simplicity). | ||
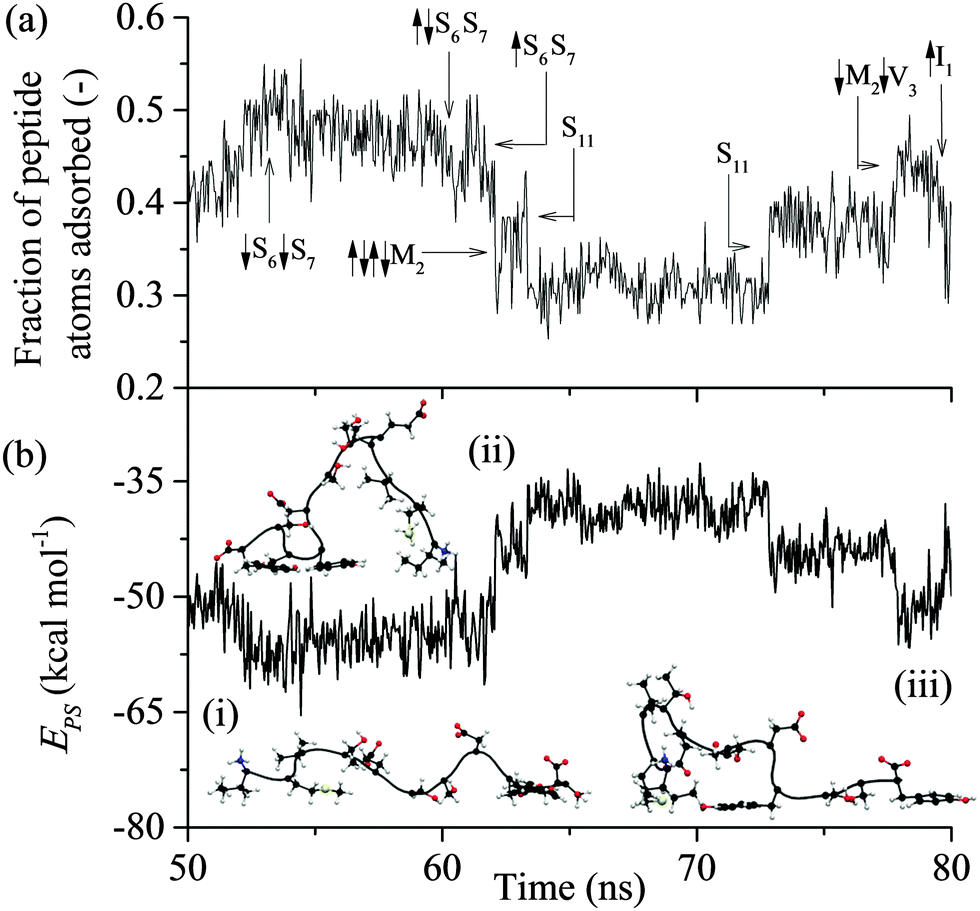 | ||
| Fig. 5 Trajectory of the exemplar MD simulation of GrBP5 during unlocking: (a) fraction of peptide atoms in direct contact with the solid surface; (b) total interaction energy between peptide and solid surface, Eps. In (a) direct contact (↓) and break away (↑) of groups from the surface are shown. Snapshots of four adsorbed states are shown in (b) at: (i) 51 ns, (ii) 65 ns and (iv) 75 ns (the surface underneath and the water have been omitted for simplicity). | ||
Biased diffusion and interfacial association
The first process in Fig. 1 is the biased diffusion of a region of the peptide from the bulk solvent to above the interfacial water layers.44 This process can be seen in Fig. 3(a) on multiple occasions. The first occurrence of diffusion is at 0.4 ns where Ile1 and Tyr12 both descend sharply towards the interface from approximately 15 Å above the surface to 7 Å where these residues stabilise above the 2nd water layer. A second example can be observed at 7.1 ns where Ile1 descends singularly from 18 Å to again stabilise above the 2nd water layer at approximately 7 Å. From Fig. 3(b) it can be seen that this process occurs outside the range of peptide–surface interactions, agreeing with our previous finding that structuring of the interfacial water, which is illustrated in Fig. 6(a), plays a role in the initial phase of peptide adsorption. In our previous work focused on elucidating the mechanism for strongly interacting surfaces,44 the biased diffusion was driven substantially by the electrostatic interaction arising between the peptide and the charged interfacial region that comes out of the orientational structuring in the water layers. Whilst orientational structuring and consequent charging of the interface also occurs here as shown by Fig. 6, the extent of both is significantly less. This is reflected in the observation here (see below) that non-polar residues appear to play as important if not more important role in the adsorption mechanism, including the biased diffusion phase – this suggests a shift here in the driving force for biased diffusion to a hydrophobic interaction.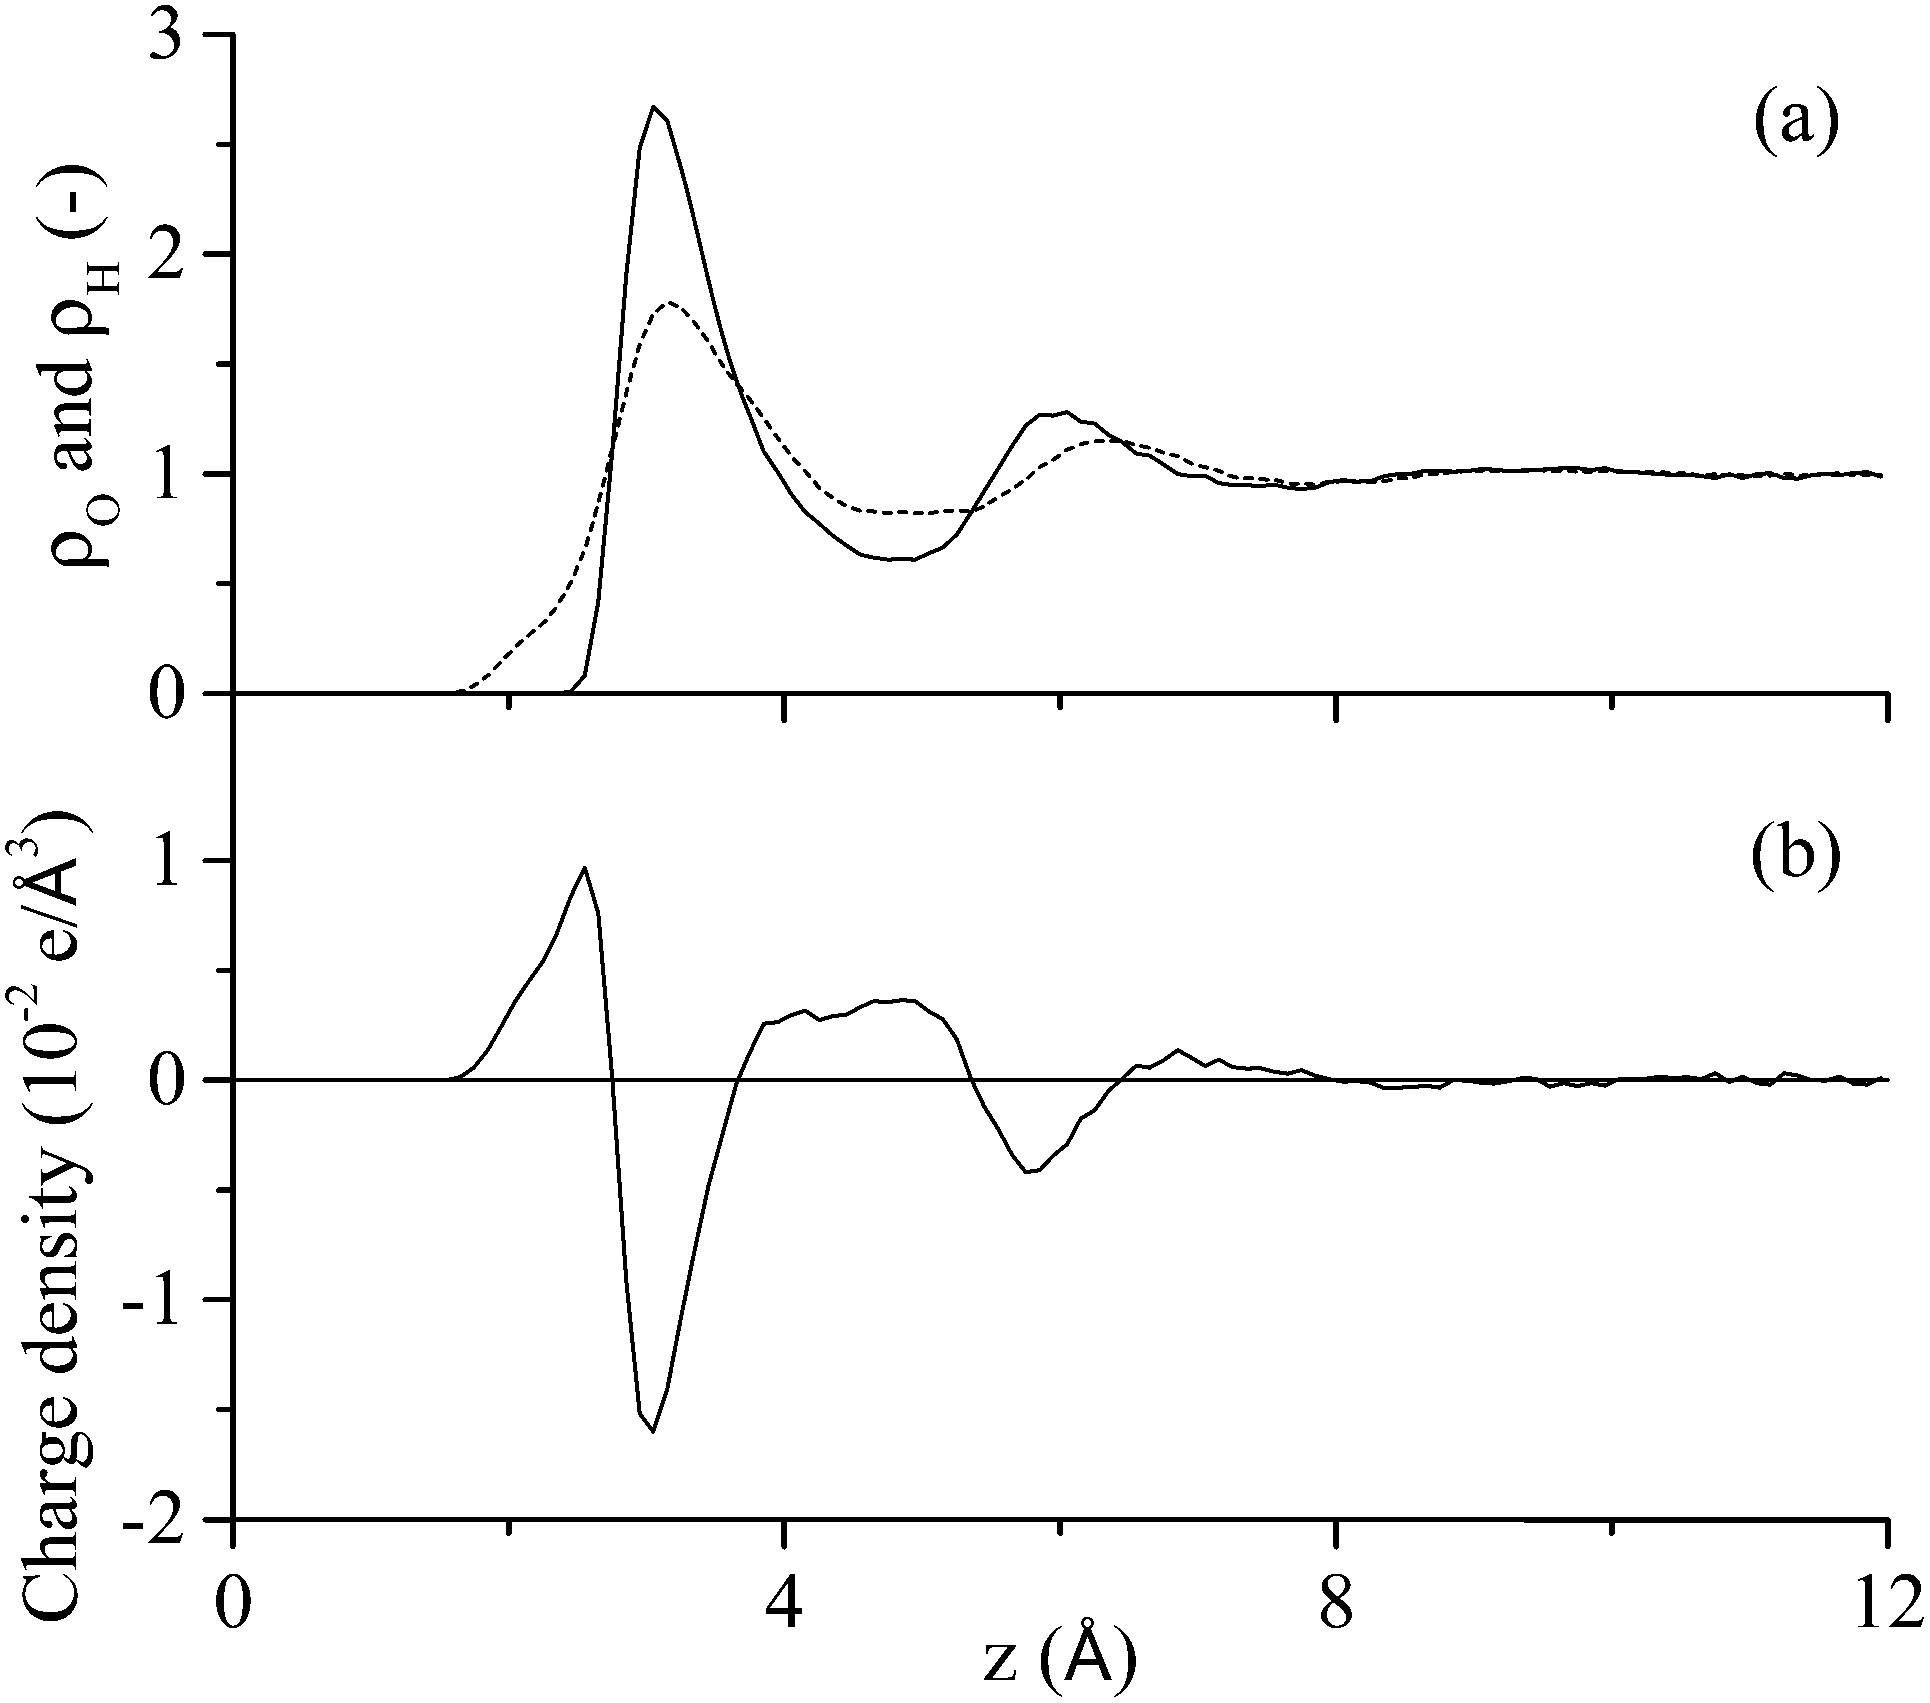 | ||
| Fig. 6 Interfacial water characteristics: (a) variation of density of oxygen (solid) and hydrogen (dashed) atoms in the water molecules relative to the bulk phase density; and (b) charge profile above the graphite surface that results from differences in the oxygen and hydrogen atom distributions. | ||
Diffusion towards the surface is halted by the presence of the 2nd water layer, Fig. 6(a), which presents the first appreciable free energy barrier to adsorption as suggested by Fig. 2. Clear examples of stabilisation above the 2nd water layer can be observed in Fig. 3(a) at 1 ns, 7.5 ns and 17 ns. In each case the minimum separation between the residue and the surface fluctuates between 7 and 9 Å for approximately 0.4 ns before going on to anchor into the 2nd water layer. Interfacial association statistics, presented in Fig. 7, show that 52% of interfacial association events are contributed by hydrophobic (3 residues) or aromatic (2 residues) groups while charged or polar groups (7 residues + 2 terminals) contribute the remaining 48%. On a per residues basis, hydrophobic/aromatic residues (i.e. the residues in domains D-1 and D-III) have a 10.4% chance of instigating interfacial association compared to only a 5.3% for polar/charged groups – this is the opposite to what was observed for strongly interacting surfaces,44 suggesting a shift in the origin of interfacial association from an electrostatic one in the strongly interacting system to a hydrophobic interaction here.
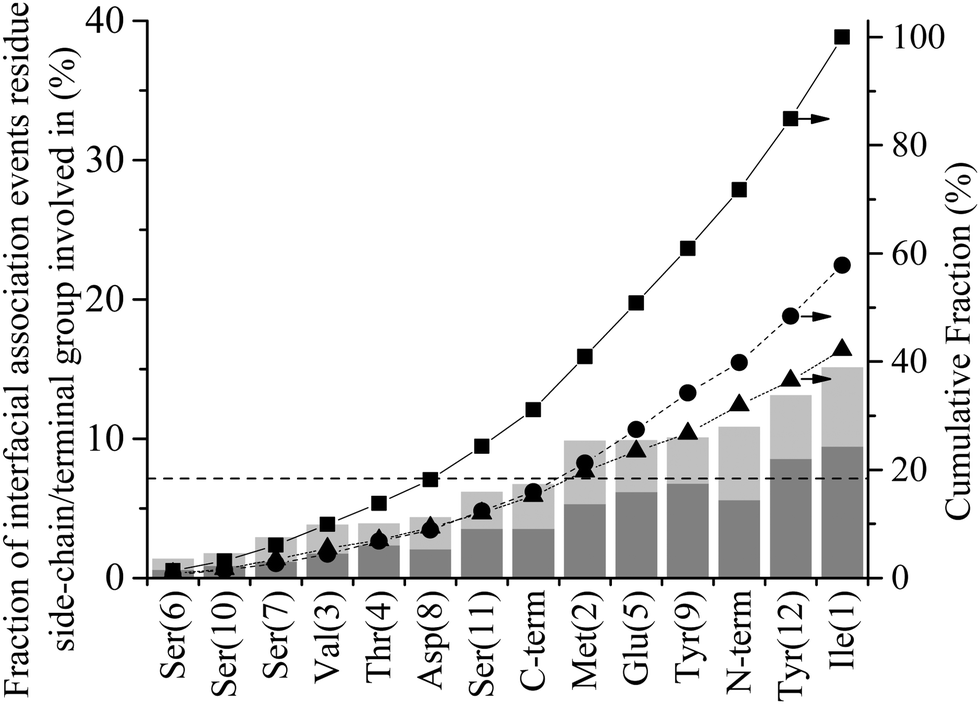 | ||
| Fig. 7 Interfacial association statistics for GrBP5 at the water/graphite interface. Percentage of total number of anchoring events contributed by each residue or terminal group, alone (dark grey) and in combination with other residues (light grey). The dashed horizontal line at 7.1% corresponds to the fraction of events each residue/terminal would contribute if they were proportionally distributed along the length of the peptide Cumulative fraction of (■) total anchoring events, (●) events contributed by a single residue and (▲) combined events where two or more residues instigate anchoring. | ||
Anchoring
Anchoring, which corresponds to process II in Fig. 1, sees a region of the peptide penetrating into the 2nd water layer and falling into the free energy well that exists between the two water layers, indicated by C in Fig. 2. Numerous anchoring events can be observed in Fig. 3 at 2 ns, 8 ns, 9 ns, 17 ns, 18 ns and 21 ns. The anchoring at 2 ns is a combined event involving both Ile1 and Tyr12. In Fig. 3(a) the minimum height of both residues descends into the space between the two water layers (i.e. the region bracketed by the two dashed lines) and stabilises there indicating that the residues have penetrated into the second water layer. Within this region there is a small but appreciable ERS (<![[thin space (1/6-em)]](https://www.rsc.org/images/entities/char_2009.gif) −1 kcal mol−1) for the two residues. All other anchoring events are instigated by single residues and the same descent into the 2nd water layer, stabilisation and associated increase in ERS is observed. The 110 MD simulations produced 413 anchoring events, an average of 3.75 events per simulation. Of these 413 anchoring events, 159 subsequently lead to contact initiation (i.e. C → D) with the remainder (303) resulting in de-anchoring (i.e. C → B). The preference to de-anchor over contact initiation is suggested by Fig. 2 where it can be seen that the free energy barrier for the latter is around 50% larger than for de-anchoring.
−1 kcal mol−1) for the two residues. All other anchoring events are instigated by single residues and the same descent into the 2nd water layer, stabilisation and associated increase in ERS is observed. The 110 MD simulations produced 413 anchoring events, an average of 3.75 events per simulation. Of these 413 anchoring events, 159 subsequently lead to contact initiation (i.e. C → D) with the remainder (303) resulting in de-anchoring (i.e. C → B). The preference to de-anchor over contact initiation is suggested by Fig. 2 where it can be seen that the free energy barrier for the latter is around 50% larger than for de-anchoring.
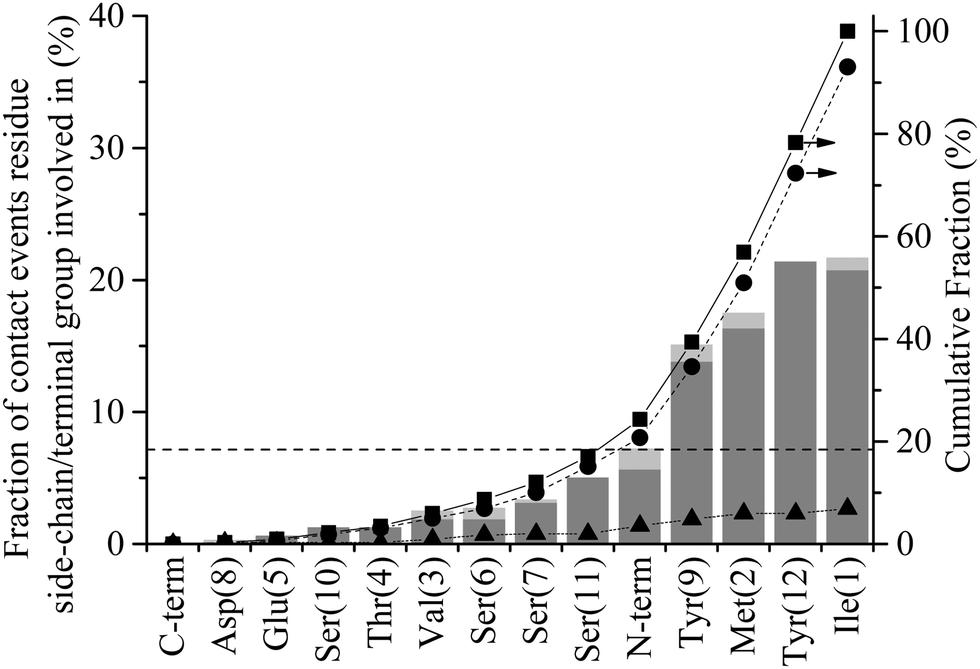
Fig. 8 shows the percentage of total anchoring events contributed by each residue or terminal group, individually (dark grey) and in combination with other residues (light grey) (see Method section for details of how these statistics were derived). The dashed horizontal line at 7.1% corresponds to the fraction of events each residue/terminal would contribute if events were proportionally distributed along the length of the peptide (i.e. 100/N where N = number of residues + 2 terminal groups). Groups falling substantially below this line can be said to be poor anchors and, conversely, those that are overrepresented are good anchors. The 24.2% of combined events is a decrease from the 41.2% observed for interfacial association (see Fig. 7). The decrease in combined events with progress through the adsorption mechanism is discussed below in the section titled ‘Contact Initiation’.
 | ||
| Fig. 8 Anchor statistics for GrBP5 at the water/graphite interface. Percentage of total number of anchoring events contributed by each residue or terminal group, alone (dark grey) and in combination with other residues (light grey). The dashed horizontal line at 7.1% corresponds to the fraction of events each residue/terminal would contribute if they were proportionally distributed along the length of the peptide Cumulative fraction of (■) total anchoring events, (●) events contributed by a single residue and (▲) combined events where two or more residues instigate anchoring. | ||
Evident from Fig. 8 is that many of the hydrophobic and aromatic residues have high anchoring propensities. The hydrophobic residues, Ile1 and Met2, contribute 33.2% of all anchoring events, providing strong statistical evidence for a hydrophobic driving force for the anchoring of GrBP5 to the water/graphite interface. The underrepresentation of the hydrophobic Val3 residue likely arises from a combination of two factors: (1) it has a smaller side chain compared to both Ile1 and Met2 and limited side chain motion independent of the peptide backbone, which means the bulk of the peptide must be closer to the second water layer before Val3 can engage with it; and (2) NH3+ is overrepresented in interfacial recognition events, which leads to Ile1 and Met2 being close to the interface, providing more opportunity for anchoring to be initiated by these groups. Together the aromatic-containing Tyr9 and Tyr12 contribute 23.1% of anchoring events. Two factors which may lead to this lower anchoring percentage compared to the two dominant non-polar residues of D-I are: (1) the separation of the Tyr residues in the primary sequence decreasing cooperative effects; and (2) the presence of the hydroxyl group on all side chains in D-III reducing the hydrophobic driving force for anchoring. These hydroxyl groups appear to play a critical role in stabilising the adsorbed state as discussed further below in ‘Role of hydrogen bonding in stabilising the peptide in the adsorbed phase’.
The hydrophilic, negatively charged Glu5 residue shows significant anchoring capacity at 150% that of proportional representation. This would appear contradictory when viewed in conjunction with the negative charge in the second water layer, Fig. 3(b). However, when a void is created in this water layer as a water molecule moves out of it due to thermal fluctuations, a charge deficiency is created locally that the negatively charged Glu5 is well-suited to fill. This begs the question as to why the other negatively charged groups (C-term, Glu5 and Asp8) are only proportionally represented in anchoring statistics. The first reason is their smaller sidechain length, whilst their proximity to overrepresented groups is also likely to impact negatively in the case of Asp8 and the C-term. Similarly, the positively charged NH3+ is also only proportionally represented with regards to anchoring. The absence of additional like-charged residues makes drawing conclusions difficult, however. The small hydroxyl-containing residues, Ser and Thr, make up a large portion of the underrepresented residues, contributing collectively just 12.8% of all anchoring events. For comparison, in our earlier study of higher energy surfaces,44 these groups were found to be neutral or overrepresented for SD152/Pt and A3/Au systems respectively. This is also supported by experimental reports that show a decrease in adsorption propensity with the mutation of polar residues to Ala for the SD152/Pt system.57 The underrepresentation of polar residues here compared to these prior studies further suggests a shift in driving force away from electrostatic interaction with interfacial water molecules to a hydrophobic association.
Examination of anchoring statistics for the overrepresented groups shows there is no discernible trend with respect to the nature of the anchoring group and percentage of lone vs. combined events. Of the anchoring events, the positively charged N-term is involved in only 28% of the combined events. This is the highest percentage for the groups which are overrepresented in anchoring statistics. Within this group the aromatic Tyr12 has the lowest percentage of combined anchoring events at 17%. The other four overrepresented anchors (Ile1, Met2, Glu5 and Tyr9) all fall within this range, with the average being 21%.
Contact initiation
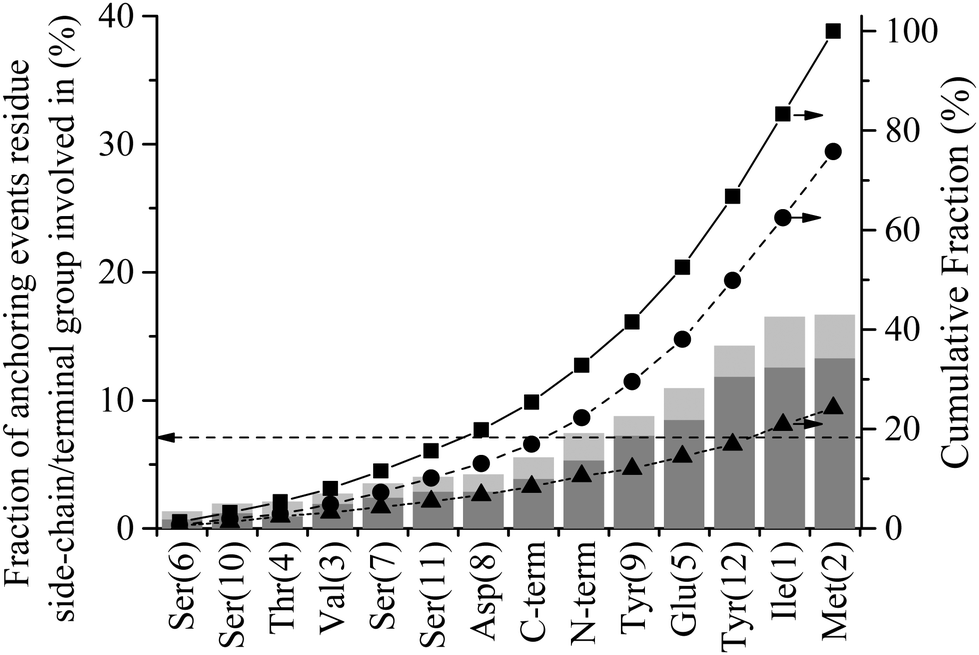
Initiation of direct contact between the peptide and the graphite surface, corresponding to action III in Fig. 1, occurs when a region of the peptide crosses the free energy barrier arising from the 1st water layer. In Fig. 3 this event corresponds to the minimum of a residue descending below the dashed line at 4 Å. Four instances of initial contact formation can be seen in the exemplar trajectory, Fig. 3. The first contact event sees both Ile1 and Tyr12 come into direct contact with the graphite surface. Whilst Tyr12 detaches quickly, Ile1 remains in contact for greater than 2 ns before popping back into the second water layer. Both Ile1 and Tyr9 come into contact with the solid surface for brief periods in subsequent contact events at 10 and 17.5 ns respectively. All contact events result in a marked increase in the magnitude of ERS, with the residue in direct contact with the surface having an ERS less than −3 kcal mol−1. Stable direct contact is finally established by Tyr12 at 21 ns. This contact is more persistent than the previous instances of contact between aromatic residues and the surface because the ring fully penetrates into the first water layer to lie flat to the surface. This more than doubles the interaction between this residue and the surface.The contact statistics presented in Fig. 9 show clear trends between functionality and contact initiation. There is again a decrease in the level of combined events compared to anchoring, with only 6.9% of contact initiation events being combined compared to 24.2% for anchoring. This is indicative of the more ordered nature of the first water layer and consequent larger barrier to be overcome for penetration to occur (ΔB1 ≈ 2.8ΔB2), which two groups are unlikely to overcome simultaneously. The dominance of non-polar and aromatic domains, D-I and D-III respectively, is more pronounced in this phase of the process than in the previous two phases, with both parts of the peptide possessing similar contact statistics. The D-I domain initiates 49% of all direct contacts, with Ile1 and Met2 residues making up 21.7% and 17.5% of this. The Val3 in this domain is, as with the anchoring phase, similarly under-represented in contact events. The D-III domain contributes net 42.8% of all contact initiation events, with the Tyr9 and Tyr12 residues within it contributing much of this at 15.1% and 21.4%, respectively. The terminal residues, Ile1 and Tyr12, have increased conformational freedom as they are not constrained by the peptide chain. This may result in them being able to more readily take up conformations which are favourable for contact initiation providing an explanation for the increase in probability that these groups initiate contact compared to other dominant groups in D-I and D-III.
 | ||
| Fig. 9 Contact statistics for GrBP5 at the water/graphite interface. Percentage of the total number contact events contributed by each residue or terminal group, alone (dark grey) and in combination with other residues (light grey). The dashed horizontal line at 7.1% corresponds to the fraction of events each residue/terminal would contribute if they were proportionally distributed along the length of the peptide Cumulative fraction of (■) total anchoring events, (●) events contributed by a single residue and (▲) combined events where two or more residues instigate anchoring. | ||
Comparison of Fig. 8 with Fig. 9 reveals that the anchoring propensity possessed by the negatively charged functional groups (Glu5, Asp8, C-terminal) is not carried through to an ability to form direct contact with the solid surface: 20.7% of anchoring events are contributed by the negatively charged functional groups, while less than a total 1% of all initial contact events are instigated by them. This lack of contribution to contact initiation reflects the appreciable negative charge present in the 1st water layer, as seen in Fig. 6(b), combined with its greater ‘rigidity’, unlike the second water layer. This negative charge of the 1st water layer means the positively charged N-terminal experiences the same level of propensity in contact initiation as anchoring (around 7%). The under-representation of polar residues observed in both the interfacial association and anchoring stages of adsorption carries through to contact initiation where all five small polar residues (Ser and Thr) are underrepresented.
Lockdown
As reflected in Fig. 4 for the exemplar simulation, lockdown is the process of conformational rearrangement of the peptide at the liquid/solid interface so as to increase in a stepwise fashion the fraction of peptide atoms in direct contact with the solid surface. As illustrated in Fig. 5, the lockdown process seen for the system considered here involves reversal of lockdown steps. The peptide initially spreads over the surface with D-II being brought into contact such that over half the peptide atoms are less than 4 Å from the solid surface between 52 and 54 ns before fluctuating between 45–50% until 60 ns where D-II unlocks again followed by Ser11 at 61 ns. This reversibility was not observed in our previous report at strongly interacting surfaces.44Comparing the distribution of the peptide–surface interaction energy, EPS, in Fig. 10(a) with the EPS trajectory presented in Fig. 5(b) indicates that the peptide is capable of exploring the full range of adsorbed energy states in a single simulation. Two peaks are evident in this distribution: a larger one centred at −49 kcal mol−1 that captures the majority of conformations where the D-II domain of the peptide is not in direct contact with the surface; and a smaller peak centred about −65 kcal mol−1 that corresponds to more elongated structures with various residues of the D-II domain in direct contact with the surface. The distribution of EPS is consistent with the proposition of Szollosi et al.56 that the adsorbed peptide can transition between a series of low energy adsorbed states.
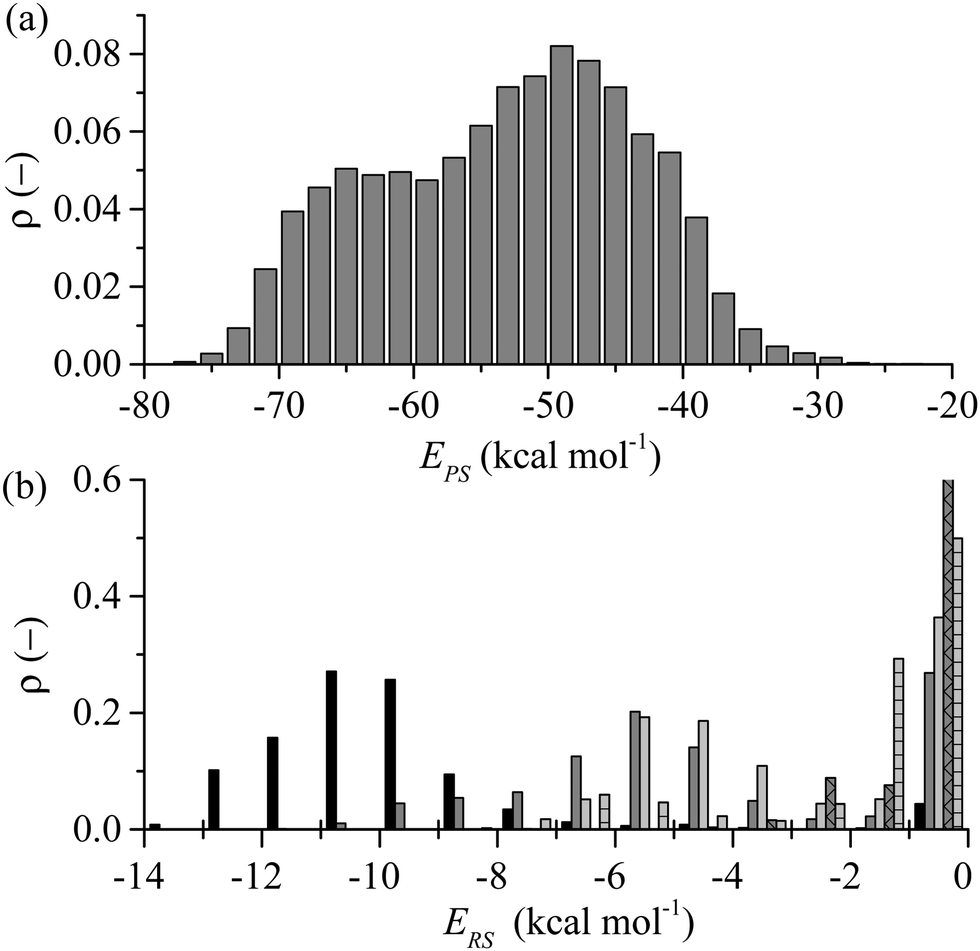 | ||
| Fig. 10 (a) Distribution of the total interaction between the peptide and the surface, EPS, (b) break down of EPS distribution into average distributions for aromatic (Tyr9, Tyr12) (black), non-polar (Ile1, Met2, Val3) (dark grey); polar (Thr4, Ser6, Ser7, Ser10, Ser11) (light grey), N-terminal (dark grey – cross); and negatively charged (Glu5, Asp8, C-terminal) (light grey horizontal bar) residues. The N-terminal bar has been cut off for −1 to 0 kcal mol−1 and extends upwards to 0.82. | ||
The average total interaction energy between GrBP5 and the graphite surface, 〈EPS〉, was found to be −53.5 kcal mol−1, with the contributions from D-I, D-II and D-III being −13.9 kcal mol−1, −11.7 kcal mol−1 and −27.8 kcal mol−1 respectively. An indication of the level of interaction a residue has with the graphite surface once the peptide is adsorbed can be garnered from the interaction between the residues and the surface. Fig. 10(b) shows the distribution of residue surface interaction energy, ERS, for different classes of residues. The distribution for the aromatic residues (Tyr9 and Tyr12), EArS, with an average interaction energy, 〈EArS〉 = −9.7 kcal mol−1. This energy indicates that the aromatic rings are lying parallel to the surface, as exemplified by the snapshots in Fig. 5(b). There is a small spike of 4.4% in EArS between −1 and 0 kcal mol−1 range. An ERS > −1 kcal mol−1, as can be seen from Fig. 3(b), is in line with the ERS in the anchoring phase. This indicates that the majority of the residue is not in direct contact with the solid surface. For ease of discussion we dub the probability associated with the −1 to 0 kcal mol−1 range the non-contact percentage (NCP). Snapshot (iii) in Fig. 4(b) shows this situation for Tyr12 where ETyr12s = −0.29 kcal mol−1. The distribution of non-polar residues, ENPS, is broader than EArS indicative of the increased variation in sidechain size and content. The NCP is 27%, a 23% increase from EArS. Individual NCPs for Ile1, Met2 and Val3 are 36%, 22% and 23%. This again shows the variation in behaviour due to the additional conformation freedom afforded Ile1 due to its being at the beginning of the peptide chain. The small polar residues, Thr and Ser, show similar behaviour to the non-polar residues. The distribution is shifted by approximately 1 kcal mol−1 due to their slightly smaller size and lacks the negative tail as the residues are all of similar size and composition. The NCP for these residues is 37% and is skewed due to Ser10 having an NCP = 15%, a result of the proximity to Tyr9 which draws Ser10 close to the surface. The N-term has a NCP of 82%, which would appear to contradict the contact initiation statistics in which it is proportionally represented. The limited interaction between N-term and the surface can be explained with reference to snapshots (ii) and (iii) in Fig. 4(b) and those in Fig. 5(b): the N-term is set opposite from Ile1 and in order for Ile1 to maximise its interaction with the solid surface the N-term sits above the 1st water later, as seen in the aforementioned snapshots. For negative and positive functional groups, outside of a small peak centred about 6 kcal mol−1 when Glu5 is in contact with the surface there is very limited interaction with the solid surface.
Unlike at higher energy interfaces where lockdown results in the peptide being tightly held to the surface,44,58,59 GrBP5 freely diffuses in the plane parallel to surface once adsorbed as illustrated by the mean square displacement (MSD) of the peptide in the adsorbed state, Fig. S3 (ESI†). Comparing the in-plane self-diffusion coefficient derived from this (9.8 × 10⁻⁸ cm2 s−1) with that obtained from the bulk phase MSD (9.7 × 10⁻⁸ cm2 s−1) shows that the loss of translational motion is restricted only to the direction perpendicular to the surface. This also falls into line with a previous computational study of peptide adsorption on carbon nanotubes using an implicit solvent representation that surface defects limit diffusion when a peptide is adsorbed at graphitic carbon interfaces,60 likely a results of the more complex free energy landscape surrounding the vicinity of the defect.
Role of hydrogen bonding in stabilising the peptide in the adsorbed phase
The statistical analysis outlined above – in particular the strong role that the hydrophobic (D-I) and aromatic domains (D-III) of the peptide play in the various phases of the adsorption process – suggests that the adsorption of GrBP5 at the water/graphite interface is dominated by hydrophobic effects. However, it has been observed experimentally that Tyr, the hydroxyl-containing aromatic residue that occurs twice in the D-III domain, enhances binding of peptides to graphitic carbon compared to its non-hydroxyl containing counterpart, Phe, all else being equal.44,61 This is further supported here by the free energy of adsorption of the sidechain analogue of Tyr (phenyl hydroxide) at the water/graphite interface being 33% greater than that of the Phe sidechain analogue (benzene), in line with recently reported results for Tyr and Phe.36 The reason for this increased affinity may be found in the presence of hydrogen bonds between the hydroxyl group and the interfacial water molecules. Upon adsorption it was found here that neither of the Tyr residues lost any hydrogen bonding capacity relative to when present in the bulk solvent, with the average hydrogen bond per residue ranging between 0.90 and 0.95 regardless of the state. Therefore, in addition to having a substantial energetic interaction with the graphite surface via π–π stacking, hydrogen bonding also stabilises the presence of Tyr within the interfacial water layers. An experimental study showed that when both Tyr residues are replaced by Phe, which does not have the capacity to form hydrogen bonds with interfacial water molecules, the peptide displayed much weaker binding.12 This study also showed that replacement of Tyr with Trp, which is capable of hydrogen bonding through the NH group on the side chain, results in high binding without an ordered assembly pattern.12 This suggests that hydroxyl group may play a key role in this ordering while also stabilising Tyr at the interface.Reversibility of adsorption
The concept of reversibility requires specific attention as many of the adsorption models used to calculate thermodynamic properties have as one of the underlying assumptions that adsorption is reversible. To assess reversibility we define interfacial disengagement as the state of the peptide resulting from −I in Fig. 1 where the peptide breaks away from the interface after having at a minimum engaged with the 2nd water layer. A number of such events can be seen in Fig. 3 showing that adsorption can be reversible where the peptide forms direct contact with the solid surface. The peptide associated with the interface a total of 339 times in the course of 110 adsorption simulations. Each simulation was run until the peptide was adsorbed at the liquid/solid interface therefore 110 of 339 association events resulted in the peptide progressing through the stages in Fig. 1 until it underwent step-wise lockdown onto the surface. In the remaining 229 instances the peptide progressed partially through the stages presented in Fig. 1 before retracing its steps and disengaging with the interface (−I in Fig. 1). In 102 cases the peptide proceeded no further than interfacial association before disengaging. In 108 cases the peptide anchored into the second water layer before disengagement. In 19 cases the peptide initiated contact with the solid surface (III in Fig. 1) before undergoing processes (−III through −I) to disengage with the surface. Of these 19 instances, five saw more than a single residue penetrating the first water layer before the peptide disengaged with the interface.The observed reversibility of adsorption behaviour described immediately above and its contrast to our prior work44 that focused on more strongly interacting surfaces begs the question at what level of surface–solution interaction strength do we see essentially irreversible peptide adsorption for the same system (i.e. without a change in solvent conditions, temperature etc.)? This is difficult to determine from molecular simulation alone due to the limited timescales that are accessible to the method compared to experiment (1000 s of ns at best vs. hours to days). Consideration of the behaviour of phenyl hydroxide and benzene may offer a guide, however. The average residence time of benzene on the surface was 27.6 ns compared to 121 ns for phenyl hydroxide. This large increase in residence time for the latter corresponds to a 1.1 kcal mol−1 increase in the magnitude of ΔAads, and suggests that a ΔAads = −4.4 is approaching the limit of reversible adsorption. Wei and Latour27 observed reversible peptide adsorption at a water/hydrophobic SAM interface and determined the free energy of adsorption for three peptides from SPR data between −2.76 and −4.40 kcal mol−1. Free energy data was not presented for a fourth peptide as reversibility of adsorption was not observed. Thus, collectively, this analysis suggests that the upper threshold for reversible adsorption is around −5 kcal mol−1.
In a previous report we showed that ΔAads is proportional to the average interaction energy between the peptide and the solid surface atoms, and for this interface the correlation was found to be EPS ≈ 2ΔAads.40 Extrapolating from this we suggest that here the upper threshold for reversibility is EPS ≈ −10 kcal mol−1. This value compares well with the interaction energy for phenyl hydroxide in the adsorbed state which was found to be −8.7 kcal mol−1. The reversible events seen in Fig. 2 all have ERS and EPS less than −10 kcal mol−1 and over the course of the 110 MD simulations no interfacial disengagement was observed once EPS exceeded −12 kcal mol−1. Once D-III, or more specifically one of the aromatic rings fully engages with the surface, see Fig. 3 snapshot (iii), the interaction energy of the residue reaches this critical threshold, and the peptide loses translational freedom perpendicular to the solid surface, becoming irreversibly adsorbed at the water/graphite interface. From the distributions of ERS in Fig. 10(b), it can be seen that only the aromatic residues have interaction energies beyond the proposed limit, reinforcing the conclusion that it is these residues that ultimately ensure the strong adsorption of GrBP5 at the water/graphite interface.
Link to adsorption mechanism for strongly interacting surfaces
Using a similar methodology as adopted here, the authors have in a previous paper44 elucidated the adsorption mechanism at a molecular level for peptides at the interface between water and strongly interacting surfaces typical of metals. This mechanism – which was observed to apply for two different peptides on two different surfaces – is mechanistically identical to that observed here. In particular, the biased diffusion, anchoring and lockdown phases were all observed. The one main difference with this previous picture, however, is the observation here that a peptide can often disengage after anchoring and will even do so after making direct contact. This difference arises from the weaker surface interaction strength compared to the metal surface in the previous work. This suggests that the mechanism as depicted in Fig. 1 is a generalisation of the mechanism first proposed in our previous paper44 and, because it has been shown to apply to three different systems, may be generally applicable to peptide adsorption at interfaces between water and uncharged surfaces. Confirmation of this will, however, have to await more studies.Conclusions
The initial phase of the adsorption of an experimentally-identified graphite binding peptide, GrBP5, at a water/graphite interface was elucidated by subjecting 110 independent MD simulations of this system to detailed analysis. The adsorption mechanism identified previously for higher energy interfaces44 was found to be equally applicable to the moderate energy interface investigated here. Statistical analysis of the adsorption process in conjunction with previously reported work44,56 has led to development of an adsorption model for peptide adsorption at liquid/solid interfaces which includes the interaction of the peptide with the interfacial water molecules and not just the solid surface directly. The adsorption model has been generated from the bottom-up, observing individual adsorption events, rather than the traditional top-down approach derived from macroscopic experimental data.The statistical analysis also provides significant insight into the functions of the three domains that make-up the GrBP5 peptide12 – the hydrophobic (D-I), hydrophilic (D-II) and aromatic (D-III) – throughout the adsorption process. It is clear that D-I is important in all aspects of the initial adsorption process; interfacial association, anchoring and contact formation, with statistical analysis suggesting that its hydrophobic residues are strongly attracted to the interface, strongly supported by the earlier experimental findings.12 The aromatic D-III domain provides some impetus for initial adsorption but dominates the interaction between the peptide and the surface in the adsorbed state, providing over 50% of the total interaction while also stabilising adsorption through hydrogen bonding with interfacial water molecules. D-II is relatively passive throughout the majority of the adsorption mechanism but the flexibility afforded the adsorbed peptide by having a middle domain which only weakly interacts with the solid surface allows the dominant D-III domain to almost always orientate itself to maximise favourable interactions – this is in line with an observation from some earlier work of the authors, where it was observed that the two glycine residues embedded between the two aromatic residues of met-enkephalin lead to its free energy of adsorption being very high on a per residue basis.39
Viewed in isolation each process in the described adsorption model was observed to be reversible. The ultimately irreversible adsorption of GrBP5 at the water/graphite interface arises due to the growing number of energy barriers that must be crossed to fully disengage with the interface. It was observed that the peptide could come into direct contact with the solid surface and still completely disengage from the interface. However, the upper threshold for potential disengagement in terms of peptide–surface interaction was estimated to be −12 kcal mol−1.
Statistical analysis of the interfacial water layers shows that the magnitude of the charge profile in the direction perpendicular to the surface compared well with strongly interacting surfaces.44 This feature, in conjunction with the importance of hydrophobic residues during the initial adsorption process revealed by statistical analysis applied to each phase of the adsorption process, suggests a shift in the driving force for adsorption of the GrBP5 peptide away from an electrostatic attraction seen for peptides adsorbing at more strongly interacting surfaces44 to a hydrophobic one. It has been suggested here that this transition arises due to the absence of in-plane ordering within the water layer adjacent to the solid surface. However, hydrogen bonding between the hydroxyl groups on the aromatic residues combined with a residue–surface interaction energy approaching the disengagement limit plays a strong role in stabilizing the peptide in the adsorbed phase.
Surfaces which present 2D charge distributions, such as silica, titania or hydrophilic SAM, to the solution phase are clearly of interest. We are, thus, bringing the same statistics-driven approach used by the authors here and elsewhere44 to elucidate the adsorption mechanism for these surfaces. This will also aid in determining the limits of the adsorption model presented here. It is also desirable to calculate from the molecular simulation the kinetic parameters associated with the adsorption model in Fig. 1 so as to provide a complete bottom-up approach to building such models.
Acknowledgements
M.J.P. gratefully acknowledges receipt of an Australian Postgraduate Award (APA) from The University of Adelaide. M.M. is similarly grateful for the postdoctoral fellowship part-funding from The University of Adelaide. The support of the Australian Research Council (DP130101714) is also acknowledged. The supercomputing resources for this work were provided by eResearchSA and both the NCI National Facility at the Australian National University and the iVEC Facility at Murdoch University under the National Merit Allocation Scheme.Notes and references
- M. Sarikaya, C. Tamerler, A. K. Y. Jen, K. Schulten and F. Baneyx, Nat. Mater., 2003, 2, 577–585 CrossRef CAS PubMed.
- C. Sanchez, H. Arribart and M. M. G. Guille, Nat. Mater., 2005, 4, 277–288 CrossRef CAS.
- Q. Q. Hoang, F. Sicheri, A. J. Howard and D. S. C. Yang, Nature, 2003, 425, 977–980 CrossRef CAS PubMed.
- M. A. Meyers, P.-Y. Chen, A. Y.-M. Lin and Y. Seki, Prog. Mater. Sci., 2008, 53, 1–206 CrossRef CAS PubMed.
- S. Weiner and L. Addadi, J. Mater. Chem., 1997, 7, 689–702 RSC.
- J. D. Hartgerink, E. Beniash and S. I. Stupp, Science, 2001, 294, 1684–1688 CrossRef CAS PubMed.
- E. Pouget, E. Dujardin, A. Cavelier, A. Moreac, C. Valery, V. Marchi-Artzner, T. Weiss, A. Renault, M. Paternostre and F. Artzner, Nat. Mater., 2007, 6, 434–439 CrossRef CAS PubMed.
- K. Rajagopal and J. P. Schneider, Curr. Opin. Struct. Biol., 2004, 14, 480–486 CrossRef CAS PubMed.
- S. Zhang, Nat. Biotechnol., 2003, 21, 1171–1178 CrossRef CAS PubMed.
- S. Brown, Nat. Biotechnol., 1997, 15, 269–272 CrossRef CAS PubMed.
- S. R. Whaley, D. S. English, E. L. Hu, P. F. Barbara and A. M. Belcher, Nature, 2000, 405, 665–668 CrossRef CAS PubMed.
- C. So, H. Hayamizu, H. Yazici, C. Gresswell, D. Khatayevich, C. Tamerler and M. Sarikaya, ACS Nano, 2012, 6, 1648–1656 CrossRef CAS PubMed.
- S. Wang, E. S. Humphreys, S. Y. Chung, D. F. Delduco, S. R. Lustig, H. Wang, K. N. Parker, N. W. Rizzo, S. Subramony, Y. M. Chiang and A. Jagota, Nat. Mater., 2003, 2, 196–200 CrossRef CAS PubMed.
- E. E. Oren, C. Tamerler, D. Sahin, M. Hnilova, U. O. S. Seker, M. Sarikaya and R. Samudrala, Bioinformatics, 2007, 23, 2816–2822 CrossRef CAS PubMed.
- Z. Su, E. Daub, T. Leung and J. Honek, J. Phys. Chem. B, 2007, 111, 14411–14417 CrossRef CAS PubMed.
- F. Baneyx and D. T. Schwartz, Curr. Opin. Biotechnol., 2007, 18, 312–317 CrossRef CAS PubMed.
- O. Cohavi, S. Corni, F. De Rienzo, R. Di Felice, K. E. Gottschalk, M. Hoefling, D. Kokh, E. Molinari, G. Schreiber, A. Vaskevich and R. C. Wade, J. Mol. Recognit., 2010, 23, 259–262 CAS.
- R. Di Felice and S. Corni, J. Phys. Chem. Lett., 2011, 2, 1510–1519 CrossRef CAS.
- M. Rabe, D. Verdes and S. Seeger, Adv. Colloid Interface Sci., 2011, 162, 87–106 CrossRef CAS PubMed.
- M. Kastinitin, B. B. Langdon and D. K. Schwartz, Adv. Colloid Interface Sci., 2014, 207, 240–252 CrossRef PubMed.
- S. L. Burkett and M. J. Read, Langmuir, 2001, 17, 5059–5065 CrossRef CAS.
- K. I. Sano, H. Sasaki and K. Shiba, Langmuir, 2005, 21, 3090–3095 CrossRef CAS PubMed.
- Z. Tang, P. Palafox-Hernandez, W.-C. Law, Z. E. Hughes, M. T. Swihart, P. N. Prasad, M. R. Knetch and T. R. Walsh, ACS Nano, 2013, 7, 9632–9646 CrossRef CAS PubMed.
- C. Tamerler, M. Duman, E. E. Oren, M. Gungormus, X. Xiong, T. Kacar, B. A. Parviz and M. Sarikaya, Small, 2006, 2, 1372–1378 CrossRef CAS PubMed.
- C. Tamerler, E. E. Oren, M. Duman, E. Venkatasubramanian and M. Sarikaya, Langmuir, 2006, 22, 7712–7718 CrossRef CAS PubMed.
- U. O. S. Seker, B. R. Wilson, D. Sahin, C. Tamerler and M. Sarikaya, Biomacromolecules, 2009, 10, 250–257 CrossRef CAS PubMed.
- Y. Wei and R. A. Latour, Langmuir, 2008, 24, 6721–6729 CrossRef CAS PubMed.
- O. Cohavi, S. Corni, F. De Rienzo, R. Di Felice, K. E. Gottschalk, M. Hoefling, D. Kokh, E. Molinari, G. Schreiber, A. Vaskevich and R. C. Wade, J. Mol. Recognit., 2010, 23, 259–262 CAS.
- R. A. Latour, Colloids Surf., B, 2014, 124, 25–37 CrossRef CAS PubMed.
- G. Raffaini and F. Ganazzoli, Langmuir, 2003, 19, 3403–3412 CrossRef CAS.
- G. Raffaini and F. Ganazzoli, Langmuir, 2004, 20, 3371–3378 CrossRef CAS.
- L. Ou, Y. Luo and G. Wei, J. Phys. Chem. B, 2011, 115, 9813–9822 CrossRef CAS PubMed.
- S. M. Tomasio and T. R. Walsh, Mol. Phys., 2007, 105, 221–229 CrossRef.
- S. M. Tomasio and T. R. Walsh, J. Phys. Chem. C, 2009, 113, 8778–8785 CAS.
- S. N. Kim, Z. Kuang, J. Slocik, S. E. Jones, Y. Cui, B. L. Farmer, M. C. McAlphine and R. R. Naik, J. Am. Chem. Soc., 2011, 133, 14480–14483 CrossRef CAS PubMed.
- Z. E. Hughes, S. M. Tomasio and T. R. Walsh, Nanoscale, 2014, 6, 5438–5448 RSC.
- A. N. Camden, S. A. Barr and R. J. Berry, J. Phys. Chem. B, 2013, 117, 10691–10697 CrossRef CAS PubMed.
- M. Mijajlovic, M. J. Penna and M. J. Biggs, Langmuir, 2013, 29, 2919–2926 CrossRef CAS PubMed.
- M. J. Penna, M. Mijajlovic and M. J. Biggs, Langmuir Search PubMed , submitted.
- M. J. Penna, M. Mijajlovic and M. J. Biggs, ACS Appl. Mater. Interfaces Search PubMed , submitted.
- J.-W. Shen, T. Wu, Q. Wang, Y. Kang and X. Chen, ChemPhysChem, 2009, 10, 1260–1269 CrossRef CAS PubMed.
- E. K. Peter, M. Agarwal, B. Kim, I. V. Pivkin and J.-E. Shea, J. Chem. Phys., 2014, 141, 22D511 CrossRef PubMed.
- D. Khatayevich, C. So, Y. Hayamizu, C. Gresswell and M. Sarikaya, Langmuir, 2012, 28, 8589–8593 CrossRef CAS PubMed.
- M. J. Penna, M. Mijajlovic and M. J. Biggs, J. Am. Chem. Soc., 2014, 136, 5323–5331 CrossRef CAS PubMed.
- A. D. MacKerell Jr., M. Feig and C. L. Brooks III, J. Comput. Chem., 2004, 25, 1400–1415 CrossRef PubMed.
- A. D. MacKerell Jr., D. Bashford, M. Bellott, R. L. Dunbrack Jr., J. D. Evanseck, M. J. Field, S. Fischer, J. Gao, H. Guo and S. Ha, et al. , J. Phys. Chem. B, 1998, 102, 3586–3616 CrossRef PubMed.
- W. L. Jorgensen, J. Chandrasekhar, J. D. Madura, R. W. Impey and M. L. Klein, J. Chem. Phys., 1983, 79, 926–935 CrossRef CAS PubMed.
- P. Trucano and R. Chen, Nature, 1975, 258, 136–137 CrossRef CAS.
- W. A. Steele, Surf. Sci., 1973, 36, 317–352 CrossRef CAS.
- M. P. Allen and D. J. Tildesley, Computer Simulations of Liquids, Oxford University Press, New York, 1983, p. 21 Search PubMed.
- J. C. Phillips, R. Braun, W. Wang, J. Gumbart, E. Tajkhorshid, E. Villa, C. Chipot, R. D. Skeel, L. Kalé and K. Schulten, J. Comput. Chem., 2005, 26, 1781–1802 CrossRef CAS PubMed.
- T. Darden, D. York and L. Pedersen, J. Chem. Phys., 1993, 98, 10089–10092 CrossRef CAS PubMed.
- J.-P. Ryckaert, G. Ciccotti and H. J. C. Berendsen, J. Comput. Phys., 1977, 23, 327–341 CrossRef CAS.
- D. A. McQuarrie, Statistical Mechanics, Harper Collins Publishers, New York, 1976 Search PubMed.
- L. M. Ghiringhelli, B. Hess, N. F. A. van der Vegt and L. D. Site, J. Am. Chem. Soc., 2008, 130, 13460–13464 CrossRef CAS PubMed.
- G. J. Szollosi, I. Derenyi and J. Voros, Physica A, 2004, 343, 359–375 CrossRef PubMed.
- S. Cetinel, S. Dincer, A. Cebeci, E. E. Oren, J. D. Whitaker, D. T. Schwartz, N. G. Karaguler, M. Sarikaya and C. Tamerler, Bioinspired, Biomimetic Nanobiomater., 2012, 1, 143–153 CrossRef CAS.
- A. Villa Verde, J. M. Acres and J. K. Maranas, Biomacromolecules, 2009, 10, 2118–2128 CrossRef PubMed.
- J. Yu, M. L. Becker and G. A. Carri, Langmuir, 2012, 28, 1408–1417 CrossRef CAS PubMed.
- T. R. Walsh and S. M. Tomassio, Mol. BioSyst., 2010, 6, 1707–1718 RSC.
- H. Xie, E. J. Becraft, R. H. Baughman, A. B. Dalton and G. R. Diekmann, J. Pept. Sci., 2008, 14, 139–151 CrossRef CAS PubMed.
Footnote |
| † Electronic supplementary information (ESI) available: (1) Full exemplar trajectory; (2) peptide–surface interaction energy over first 25 ns of exemplar trajectory (3) MSD of GrBP5 in bulk solvent and adsorbed at water/graphite interface; (4) movie of exemplar trajectory. See DOI: 10.1039/c5sm00123d |
| This journal is © The Royal Society of Chemistry 2015 |