DOI:
10.1039/C4SM02840F
(Paper)
Soft Matter, 2015,
11, 3067-3075
Frontal vitrification of PDMS using air plasma and consequences for surface wrinkling†
Received
19th December 2014
, Accepted 13th February 2015
First published on 13th February 2015
Abstract
We study the surface oxidation of polydimethylsiloxane (PDMS) by air plasma exposure and its implications for the mechanically-induced surface wrinkling of the resulting glass–elastomer bilayers. The effect of plasma frequency (kHz and MHz), oxygen content (from O2 to air), pressure (0.5 ≤ P ≤ 1.5 mbar), as well as exposure time and power, is quantified in terms of the resulting glassy skin thickness h, inferred from wrinkling experiments. The glassy skin thickness is found to increase logarithmically with an exposure time t, for different induction powers p, and all data collapse in terms of a plasma dose, D ≡ p × t. The kinetics of film propagation are found to increase with the oxygen molar fraction yO2 and decrease with the gas pressure P, allowing both the wrinkling wavelength λ and amplitude A to be effectively controlled by gas pressure and composition. A generalised relationship for frontal vitrification is obtained by re-scaling all λ and h data by D/P. A coarse-grained wave propagation model effectively describes and quantifies the process stages (induction, skin formation and propagation) under all the conditions studied. Equipped with this knowledge, we further expand the capabilities of plasma oxidation for PDMS wrinkling, and a wavelength of λ ≈ 100 nm is readily attained with a modest strain εprestrain ≈ 20%.
1 Introduction
Wrinkling of ‘sandwich bilayers’ is an attractive route for large area and low cost surface patterning, with feature sizes ranging from 100s of nm to 100s of μm and beyond.1–3 Pattern formation occurs readily via a mechanical instability of bilayers under compression, typically consisting of a thin, rigid film supported by a softer substrate. Compression along the plane of the film can be imposed by various methods, either during film formation or by a subsequent reversible step. These include mechanical strain,4–6 temperature cycling,7,8 solvent induced swelling and evaporation,7,9–11 and solution deposition and film drying,7,12–14 amongst others. Film formation approaches include thin film floating or transfer,15 vapour deposition,7,16,17 ion sputtering,12–14 substrate oxidation and vitrification (e.g., via plasma exposure or UV ozonolysis).4–6,8,18 While a range of materials can be used as substrates, elastomers like polydimethylsiloxane (PDMS) are convenient due to their relatively low modulus (≈1.6 MPa)19, near incompressibility (the Poisson ratio ν ≈ 0.5),19 large elongation at break (≈200%)20, surface adhesion and transparency. Oxidation of PDMS, by ultraviolet ozonolysis (UVO) or plasma exposure, results in cleaving Si–CH3 groups and the formation of a denser, SiOx-rich glass-like surface layer21–24 effectively yielding a strongly bound ‘sandwich bilayer’ with a high skin/substrate modulus contrast as required for wrinkling. UVO oxidation occurs by exposure to 185 and 254 nm light, accompanied by ozone-formation,22 which in turn induces PDMS conversion with a non-uniform cross-sectional profile (over 50–100 nm)22,25,26, whose effective thickness h yields wrinkling wavelengths λ in the 10 to 100 μm range under compression.4,22 Plasma oxidation takes place by ionisation of a gas, typically oxygen, under vacuum by an oscillating electric field,27 and comparatively yields thinner skins (h ∼ 10 nm) and thus smaller λ (≈100 nm–10 μm)4,5. The efficiency of surface oxidation is expected to depend on the gas (or a mixture of gases) and pressure,23 which have not been explored in the context of wrinkling.
We have recently reported on the PDMS skin formation induced by O2 plasma (40 kHz) exposure and found surface vitrification to be a frontal process, whose glassy thickness h increases with logarithmic kinetics with a plasma dose D5. Three stages of film formation could be identified: (i) induction, (ii) formation and (iii) propagation, describing the increase of the skin modulus and thickness during glassy front propagation. We could then map the wrinkling λ accessible by this method,5 and found the coupling of skin growth and propagation to yield a practical λmin ≈ 140 nm at high strains (ε ≈ 200%),5 near the maximum elongation at break. While smaller λ have been demonstrated in wrinkling cascades,28 we are concerned here with single frequency sinusoidal surfaces.
In this paper, we assess whether air plasma exposure, more attractive from manufacturing and safety standpoints, is effective as a frontal PDMS skin vitrification approach. We evaluate the influence of processing parameters – induction plasma frequency (kHz and MHz), gas pressure P and composition yO2, power p and exposure time t – on the glassy skin thickness h and thus wrinkling wavelengths λ are attainable. For generality, we select the most common plasma induction frequencies, namely 40 kHz and 13.6 MHz, and gas pressures within 0.5–1.5 mbar suitable for ignition.
Our paper is organised as follows: Section 1.1 introduces the fundamental wrinkling equations, in both the low and high deformation sinusoidal regimes, followed by a coarse-grained model of the frontal oxidation process in Section 1.2. Section 2 describes the experiments and wrinkling analysis to directly measure the patterned λ and A, and thereby infer the skin thickness h. In Section 3, the experimental results for the range of processing parameters are presented and interpreted in terms of the frontal model. Section 4 summarizes the findings and provides recommendations for PDMS wrinkling by surface oxidation and mechanical compression.
1.1 Wrinkling bilayer mechanics
Mechanically-induced wrinkling occurs as a consequence of the application of strain to a bilayer consisting of a stiff thin film bonded to a compliant substrate. Sinusoidal surface undulations result from the energy minimisation of bulk deformation and skin bending,29–31 with a wavelength| | 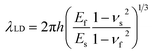 | (1) |
where h is the film thickness, Ef and Es are the elastic moduli of both the film and substrate, and νf,s is the Poisson ratio of each layer. Eqn (1) is often simplified by introducing the plane strain modulus Ē = E(1 − υ2). The wrinkling amplitude| | 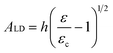 | (2) |
depends on the strain ε, and a critical strain value30,31| |  | (3) |
must be exceeded for wrinkling to occur.29–31
The wrinkling profile, defined by λ and A, can thus be separately tuned by judiciously changing the film thickness h and strain ε (since only A depends on ε, in this low deformation (LD) limit). The wrinkling morphology is effectively tuned by the strain field (see for example4,18,32), although only uniaxial strain is considered here. Beyond the limit of low deformation,33–38 when ε ≫ εc, both the wavelength and amplitude35 now depend on ε and
| | 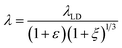 | (4) |
| | 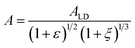 | (5) |
where
ξ = 5
ε(1 +
ε)/32. The low deformation
eqn (1) and
(2) provide a reasonable approximation for a range of low
ε values, and are thus commonly employed. At even higher deformations, wrinkling is no longer sinusoidal, as higher modes and folding eventually dominate
39,40 and the linear relationship between
λ with the film thickness
h no longer holds.
1.2 Modelling the plasma-induced frontal glass formation
Previous studies on wrinkling of bilayers obtained through plasma oxidation of PDMS5,8 have shown the existence of a logarithmic dependence between the oxidised film thickness and the exposure time. This planar frontal glass-formation process has been successfully described by a minimal spatio-temporal model, borrowing concepts from well-established directional solidification via frontal photopolymerisation.41–43 In short, we describe the extent of PDMS conversion into glass as an equation of motion for a conversion order parameter ϕ(z,t)| | 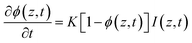 | (6) |
where K is a constant related to the oxidation reaction kinetics, I is the plasma intensity, and z is the position coordinate orthogonal to the specimen and with the origin at the top surface. The boundary conditions ϕ(z,t = 0) = 0 and ϕ(z = 0, t = ∞) = 1 stipulate that the material starts as neat PDMS (ϕ = 0) and fully converts (ϕ = 1) at long times. The non-monotonic variation of I(z,t) is modelled by a relation analogous to the Beer–Lambert law| | 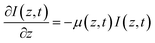 | (7) |
describing the effective penetration of the plasma in the material, where μ is generally an averaged attenuation coefficient (weighed by composition). If the material properties do not change significantly upon conversion, i.e. μ(z,t) ≈ μ (the invariant case),41,42 we obtain an analytical expression for the glassy film thickness h
where ϕc is a critical conversion value required for glass formation (analogous to a percolation threshold), and I0 ≡ I(z = 0,t). Our minimal frontal model describes the glassy film formation with only three parameters: 1/μ, readily determined by the slope of h vs. ln(t),  and ϕc determined by the intercept of the graph (and decoupled by a series of self-consistent experiments at various P). Furthermore, we found that the plasma dose (D ≡ p × t) captured the combined effects of the changing plasma power p and exposure time t5, and D thus collapses all the experimental results for h or λ at different P and t. We therefore re-write the previous expression as
| | 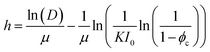 | (8) |
and will seek to obtain quantitative relationships for the model parameters as a function of plasma processing conditions (detailed further in the ESI and Fig. S1 and S2†).
2 Experimental
2.1 Sample preparation
PDMS elastomer samples were obtained by mixing the pre-polymer and crosslinker (Sylgard 184, Dow Corning) at a 10![[thin space (1/6-em)]](https://www.rsc.org/images/entities/char_2009.gif) :1 ratio by mass. The mixture was vigorously stirred with a spatula, placed under vacuum for 15 min to degas, and deposited on a flat glass surface for 3 h, before curing at 75 °C in a convection oven for 1 h to crosslink into an elastomer. The PDMS slab obtained, with a thickness of ≈2 mm, was cut into pieces of 2 cm2 (1 cm × 2 cm).
:1 ratio by mass. The mixture was vigorously stirred with a spatula, placed under vacuum for 15 min to degas, and deposited on a flat glass surface for 3 h, before curing at 75 °C in a convection oven for 1 h to crosslink into an elastomer. The PDMS slab obtained, with a thickness of ≈2 mm, was cut into pieces of 2 cm2 (1 cm × 2 cm).
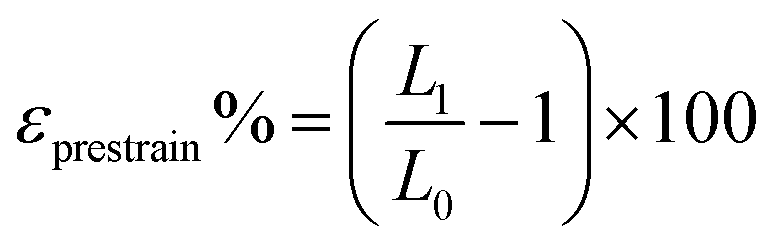
For each experiment, distinct specimens were placed in a uniaxial strain stage and then stretched to the desired extent with a micrometer screw. The value of εprestrain was calculated as
| | 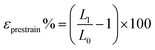 | (9) |
where
L0 and
L1 are the lengths of the PDMS between the two clamps of the stage before and after stretching. The length was measured with a precision of ±0.01 mm. The stretched PDMS specimen was then placed in the plasma chamber for oxidation, removed and released from strain, resulting in permanently wrinkled samples in the relaxed state for profile analysis.
2.2 Plasma oxidation
Two different plasma chambers were utilized: (1) a Harrick Plasma PDC-002, connected to a gas mixer and pressure gauge (PDC-FMG-2, Harrick Plasma), and a vacuum pump (IDP3A01, Agilent Technologies) with a nominal frequency of 13.6 MHz (RF) and three power settings (30, 10 and 7 W); and (2) a Diener Plasma FEMTO, with a frequency of 40 kHz and power settings from 10 to 90 W, fitted with a pressure sensor (TM 101, Thermovac). Air, oxygen and nitrogen gas cylinders (BOC, an O2 purity of 99.5%) supplied the gas mixer or the chamber inlets directly. The chambers were evacuated to a pressure of ≈0.2 mbar over approximately 5 min, before admitting the gas (or the mixture) for 5 min until the desired pressure was reached and stabilized. The plasma was then ignited, at the required power, and exposure controlled with a timer (±1 s). Pressures higher than 1 mbar were found not to allow for plasma ignition, and the plasma was thus ignited at a lower pressure and the gas flow rate immediately increased to reach the desired pressure (this behaviour is expected from Pashen's law,44 and measured for air plasma,45 which in this pressure range requires higher breakdown voltages for ionisation). The temperature variation during plasma exposure was directly monitored and found to be sufficiently small, such that thermally-induced wrinkling upon cooling is not observed in this range (ESI, Fig. S3 and S4†).
Fig. 1 illustrates the experimental procedure followed to produce wrinkled PDMS specimens by plasma oxidation.
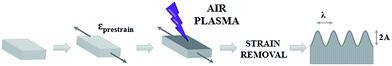 |
| | Fig. 1 Formation of wrinkles on SiOx–PDMS bilayers by plasma oxidation: a neat PDMS specimen is pre-strained uniaxially by εprestrain, then exposed to plasma (for various gas mixtures, frequency, power, pressure and time), and then allowed to relax forming sinusoidal wrinkling patterns with prescribed λ and A from which the glassy skin thickness h is inferred. | |
2.3 Profile analysis
Pattern wavelengths larger than 1 μm were measured by optical microscopy (Olympus BX41M, 100× objective) in brightfield reflection mode, and analyzed using ImageJ. Smaller pattern dimensions were measured via atomic force microscopy (AFM) with a Bruker Innova microscope in tapping mode at 0.2 Hz with Si tips (MPP-11100 W, Bruker), and analysed with NanoScope software. Fig. 2 depicts a representative wrinkled specimen characterized with both microscopes, as well as the corresponding height profile and sinusoidal line fit.
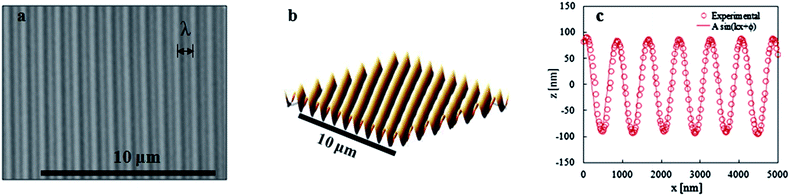 |
| | Fig. 2 Representative wrinkling pattern obtained by plasma exposure of a PDMS specimen upon relaxation of uniaxial strain (Air, MHz plasma, t = 50 min, P = 7 W, and εprestrain = 20%). (a) Optical microscopy image, (b) AFM tapping mode topography and (c) corresponding 1D section profile and fitted sinusoidal curve. | |
3 Results and discussion
3.1 Wavelength measurements
3.1.1 Low deformation and bilayer approximations.
At sufficiently low deformations, eqn (1) and (2) hold and the wrinkling wavelength λ is practically independent of ε, which allows the glass film thickness h to be readily estimated assuming a bilayer model. This procedure has been validated, at least in part, with simultaneous X-ray reflectivity measurements.5 However, ε must exceed the critical εc which in turn depends on the skin glassy modulus Ef subject to variations during the early stages of film formation. In order to compare different plasma exposure conditions, we opt to select a constant value of εprestrain ≈ 20% that exceeds εc under all the conditions studied, while remaining relatively low to ensure relatively low strains, for which the patterns are sinusoidal (Fig. 2c) and eqn (1)–(5) remain valid. This is illustrated in Fig. 3 by plotting λ(ε) for a representative specimen. The experimental data were fitted to eqn (4) where λLD – the single fitting parameter – was obtained through data regression. At a εprestrain of ≈ 20%, one obtains a λLD/λ of ≈ 1.215 from eqn (4), which is verified experimentally within measurement uncertainty. Assuming the experimental λ ≈ λLD and using eqn (1)–(3) to compute h would underestimate the skin thickness by approximately 20%, and we thus employ eqn (4) to compute h. The largest source of uncertainty remains therefore the assumption of a bilayer film structure, discussed previously,5 but which appears acceptable in a comparative evaluation of plasma processing parameters. We focus on the experimentally measured λ (20%) in the presentation of results and then parameterize both λ (20%) and h in conclusion.
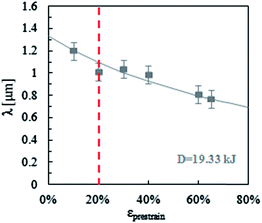 |
| | Fig. 3 Dependence of the experimental wrinkle wavelength (λ) on pre-strain εprestrain applied prior to MHz air plasma exposure at a constant pressure of P = 0.93 mbar and a dose of D = 19.33 kJ. The line is a fit to eqn (8) yielding λLD for ε → 0. | |
3.1.2 Effect of time, power and frequency.
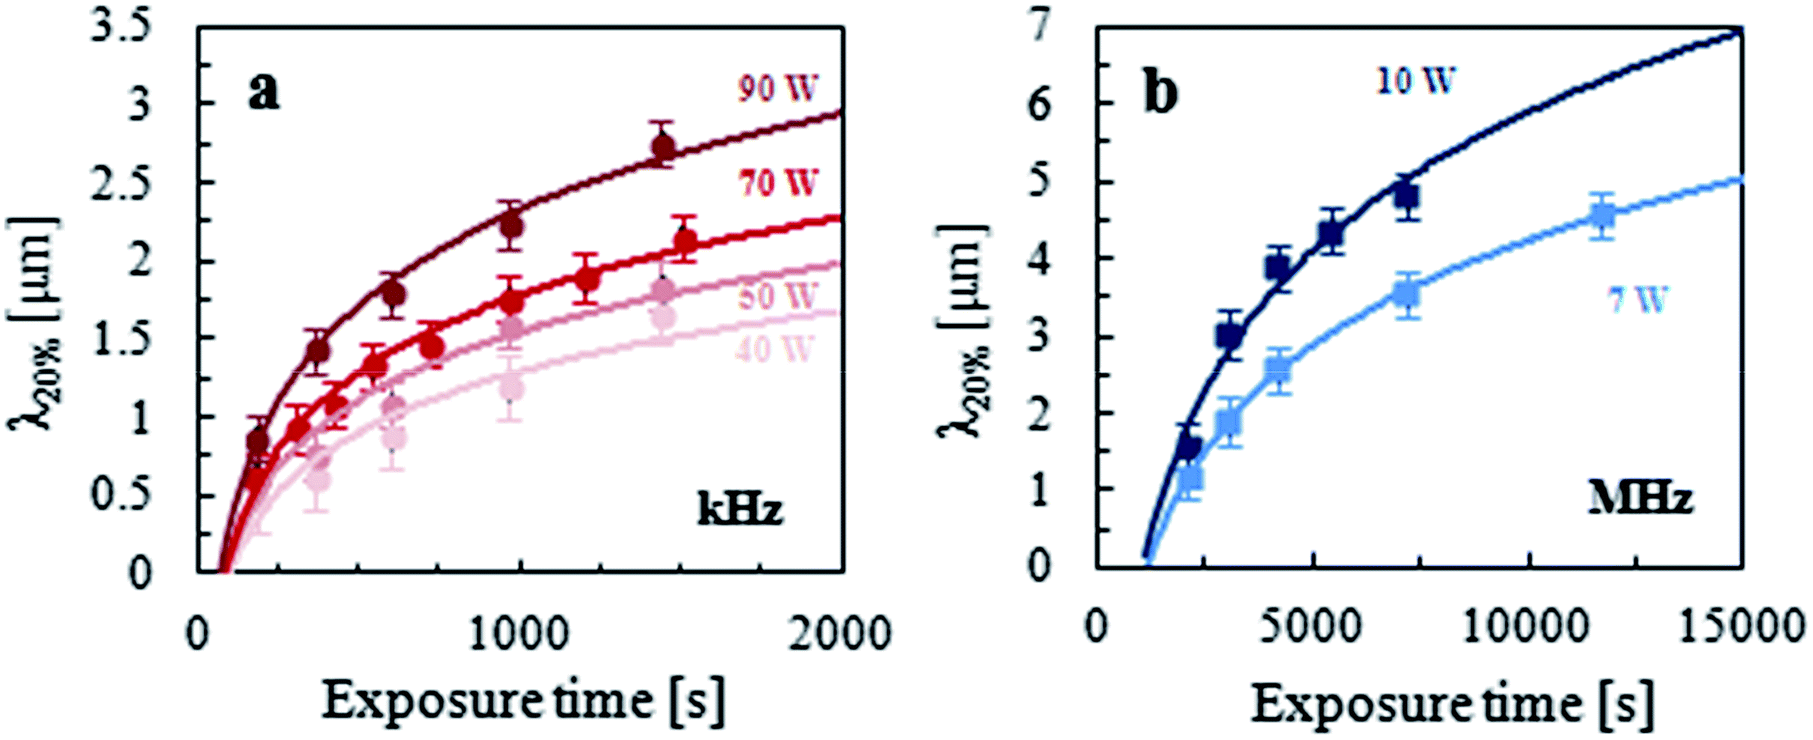
We first report on the effect of air plasma frequency on the wavelength of oxidised PDMS at εprestrain ≈ 20%, and measure distinct specimens at different powers p and exposure times t. The results are summarised in Fig. 4 and confirm the logarithmic dependence5 of wrinkling periodicity λ (and thus the skin thickness h) in all the cases investigated.
 |
| | Fig. 4 Wavelengths of sinusoidal wrinkles for samples prestrained by a εprestrain of = 20% and treated with (a) kHz and (b) MHz air plasmas, as a function of the exposure time for different power settings, where air pressure was kept constant at P = 0.93 mbar. The lines are logarithmic fits. | |
Following our earlier work on O2 plasma oxidation of PDMS,4–6 we find that rescaling the dependence of λ as a function of dose D (≡ p × t) results in the collapse of all the data (pairs of t, p) onto a single master curve for each plasma frequency, as shown in Fig. 5. Given the direct proportionality between the wrinkling λ and the glassy film thickness h in this sinusoidal regime, it is possible to interpret the data in terms of skin growth kinetics. Both the slope and intercept of the logarithmic relationship vary with plasma frequency and the inspection of eqn (8) thus indicates that μ and K, the effective attenuation parameter and rate constant, depend on the frequency at constant pressure. Frontal vitrification is faster with a MHz plasma (yielding a lower μ) but has a slightly longer induction time/dose (corresponding to a lower K), with respect to a kHz plasma under the same conditions (of gas composition, pressure and dose).
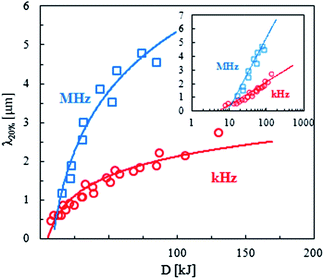 |
| | Fig. 5 Wrinkling wavelengths (λ) of PDMS samples strained by εprestrain = 20% and exposed to kHz and MHz air plasmas, at a constant pressure of P = 0.93 mbar, as a function of the plasma dose (D). All data in Fig. 4 collapse into single master curves for the two frequencies, well described by a logarithmic dependence. The inset shows the results in a lin–log scale. | |
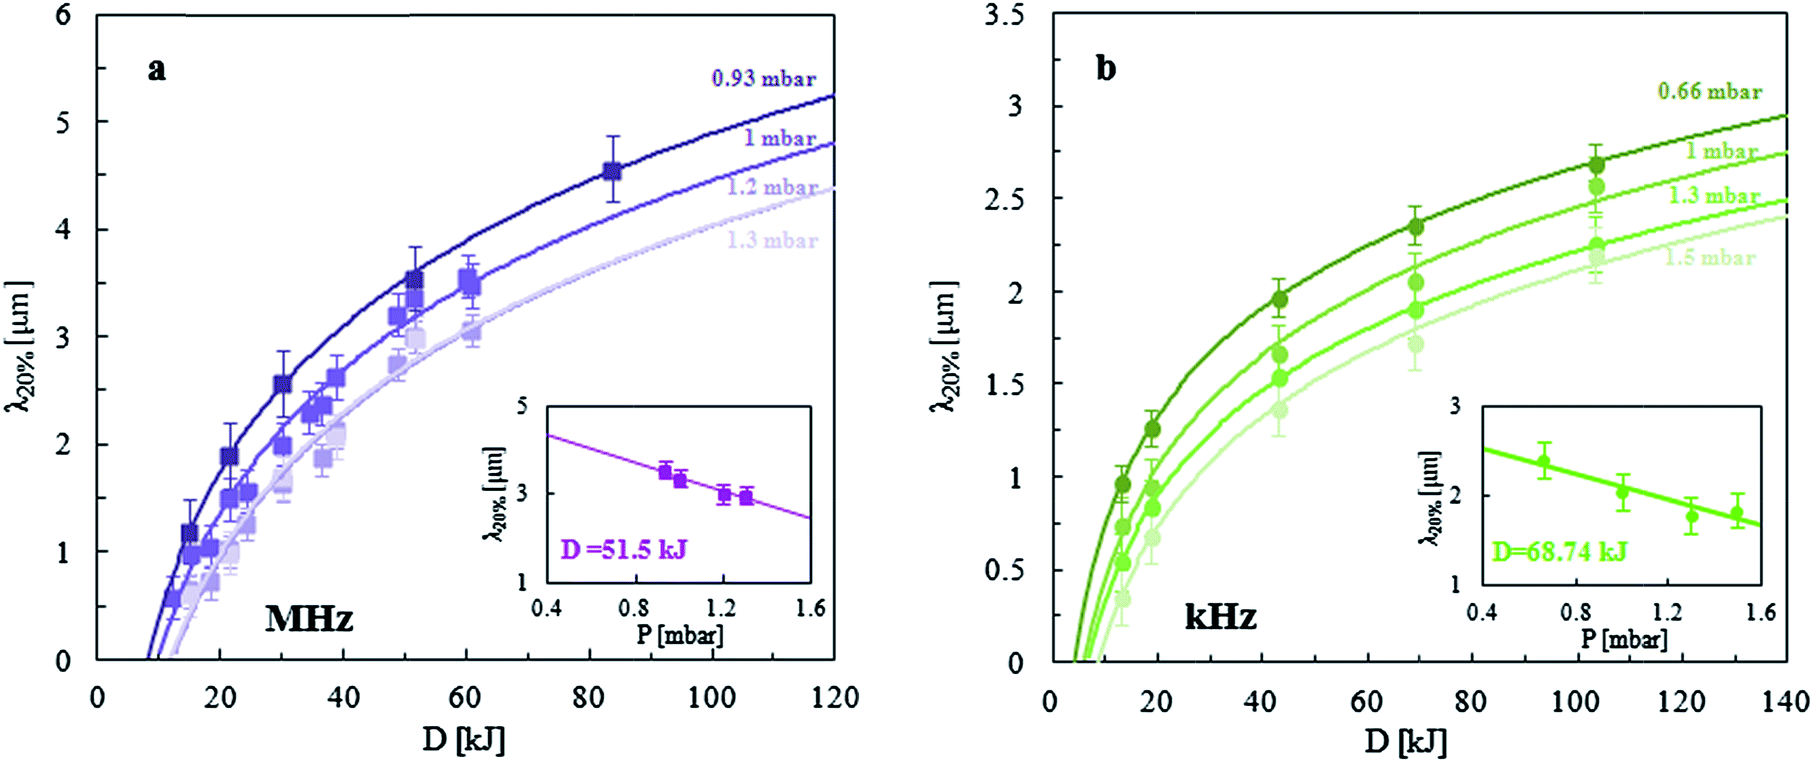
3.1.3 Effect of pressure.
We next consider the effect of gas pressure, within 0.66–1.5 mbar, on the frontal vitrification kinetics induced by air plasma. The experimental results are shown in Fig. 6 and demonstrate that increasing pressure P decreases λ at a constant plasma dose (illustrated in the inset, for both MHz and kHz frequencies). In order to rationalise the results, we recall again the proportionality of λ and h (eqn (1) and (4)) in this regime to conclude that an increase in the plasma pressure slows down the kinetics of the oxidation reaction. The result is not unexpected: as the collision rate in the plasma increases with pressure the molecular mean free path decreases, which in turn compromises the ionisation process.44 Since the oxidation reaction (leading to the formation of the glassy layer) proceeds with a radical mechanism, a decrease in the ionization rate at higher pressures should thus slow down conversion and thus yield thinner glassy films (and lower wrinkling λ).
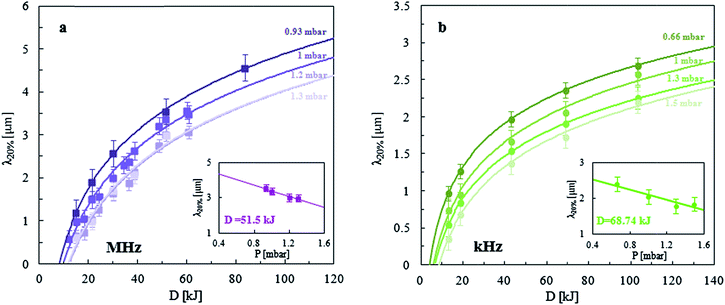 |
| | Fig. 6 Sinusoidal wrinkle periodicity (λ) at 20% prestrain as a function of the plasma dose (D) for different values of air pressure (P) for (a) a kHz and (b) a MHz plasma. The lines are logarithmic fits. The inset shows dependence of λ with P at a fixed dose, which is found to be linear within this range. | |
Inspired by the successful rescaling of wrinkling data at differing powers p and exposure times t in terms of a plasma dose D, we evaluated various rescaling variables involving pressure P. For this purpose, we fit all the data according to our eqn (8) at the various gas pressure P, yielding the results shown in Fig. 7. Evidently μ (which sets the log slope) remains unchanged with P. However, K (or KI0), which sets the intercept, is found to decrease with P, as expected from the discussion above. Since ϕc is constant (≈0.06) and KI0∼ P−1 within this (narrow) P range (cf.Fig. 7), one might expect from eqn (8) that approximately h ∝ ln(D/P). Indeed, we find that, within this P range, all data collapse when plotted as a function of D/P, as shown in Fig. 8. This correlation provides useful guidance in designing the PDMS surface A and λ via plasma oxidation.
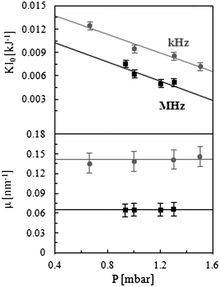 |
| | Fig. 7 Pressure dependence of model parameters KI0 and μ for all air plasma exposure doses and different frequencies. The parameters were computed from eqn (8) taking ϕc = 0.06. The pressure dependence of KI0 is equally well described by ∼P−1 or linearly with -P, within this (relatively narrow) range. | |
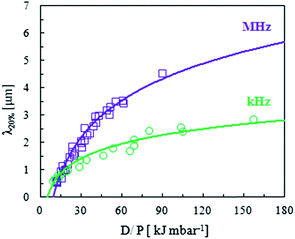 |
| | Fig. 8 Wrinkling wavelengths (λ) of PDMS samples strained by εprestrain = 20% and oxidized by kHz and MHz air plasmas, as a function of the ratio of the plasma dose/air pressure (D/P). The curves in Fig. 6 collapse further into single master curves for each frequency. Lines are fits to eqn (9). | |
3.1.4 Film formation and propagation.
During the early stages of plasma oxidation and accompanying glassy film formation, we have found4,5 that both the skin modulus Ēf and thickness h increase during O2 plasma exposure, which we term the skin formation stage. This stage is particularly important as the modulus mismatch between the skin and the substrate continuously increases, which in turn sets εc required for wrinkling to take place, which decreases following eqn (3). Limited by the material elongation at break (εmax), the combination of the two effects results in a minimum λ achievable5 at constant ε. At the end of the film formation stage, as the surface glassy layer densifies,22,46 it eventually reaches full conversion or saturation, corresponding to ϕ(z = 0, t > ts) = 1, in the context of our model where ts is the saturation time (or the corresponding dose Ds). Beyond ts the film largely propagates with a constant modulus and a sharp interfacial profile into the unconverted PDMS bulk layer, and we refer to this stage as the film propagation stage. The transition between film formation and propagation is manifested in two ways: (i) a discontinuity (i.e. a ‘kink’) appears in the logarithmic dependence of λ(D) and (ii) the aspect ratio of wrinkling profiles A/λ becomes insensitive to D, as the modulus Ēf ceases to change and only h increases (which is cancelled by taking A/λ).
In order to examine whether this physical picture applies for air plasma oxidation and to evaluate the effect of pressure in the skin formation stage, we investigate very low air plasma doses, D < Ds. Previously,5 with an O2 kHz plasma we found an effective of λmin ≈ 140 nm with a high ε of 200% (near PDMS failure at εmax, and thus compromising reproducibility). Our skin thickness estimates of h ≈ 5–50 nm agree broadly with the various previous measurements22–26,46 of plasma, UV, UVO and corona discharge, which we have discussed earlier.5 Our hypothesis is that by increasing air pressure, one might be able to access even lower wrinkling wavelengths, desirable for a range of nanoscale applications. The experimental results for λ obtained at low D for two different pressures in a MHz air plasma are shown in Fig. 9. In line with our observations in the propagation regime (Fig. 6 and 7), increasing the pressure P also decreases λ in the film formation stage. Employing even a modest strain of εprestrain = 20% and P = 1.2 mbar, we readily obtain a wrinkle periodicity of λ ≈ 100 nm (ESI, Fig. S5†), below what was achieved previously5 and indicating that tuning plasma pressure (as well as further increasing ε, while decreasing D) are effective routes for obtaining sub-100 nm wrinkling wavelengths. This is one of the main results of our paper.
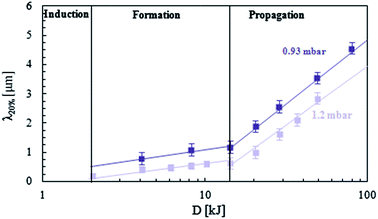 |
| | Fig. 9 Wavelengths (λ) of wrinkled PDMS samples prestrained by εprestrain = 20% and treated with MHz plasma, as a function of dose (D) for the two values of air pressure P = 1.2 mbar and P = 0.93 mbar. The transition from film formation to propagation stages, defined by the saturation time/dose when the glassy skin reaches full conversion at the surface, is visible by a kink on the logarithmic propagation kinetics. | |
3.2 Wrinkling amplitude during film propagation
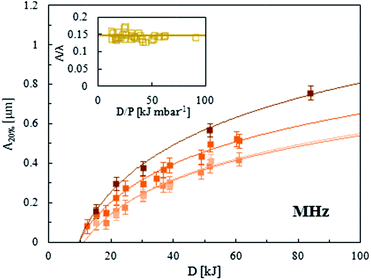
We next consider the effect of plasma pressure P on the wrinkling amplitude A. Our results so far indicate that the plasma processing parameters effectively tune the kinetics of glassy film formation and, in the propagation regime, this corresponds to changing h(t) as the modulus Ēf is expected to remain largely constant. Since we find that increasing P decreases λ (and thus h), as shown in Fig. 6 and 7, we expect the same linear dependence of the wrinkling amplitude A with P, in accordance to eqn (2) and (5). The experimental data for A achieved in for PDMS exposed to a MHz air plasma at a constant value of εprestrain = 20% are shown in Fig. 10, confirming our expectation.
 |
| | Fig. 10 Sinusoidal wrinkling amplitude (A) as a function of the plasma dose (D) for different values of air pressure (P) within a MHz plasma, during the film propagation stage. A constant value of εprestrain = 20% was utilized to stretch the PDMS samples prior to plasma exposure. As in previous figures, the lines are logarithmic fits to eqn (5) and (8). The inset shows the aspect ratio A/λ as a function of D/P which is found to remain constant within measurement uncertainty. | |
Inspection of eqn (1), (2) and (4), (5) indicates that, at constant strain ε, the aspect ratio A/λ should only depend on the plane strain moduli of the film and PDMS substrate. If Ēf remains constant and only the glassy skin thickness h changes with time t, characteristic of the propagation regime, then the aspect ratio A/λ should be constant with pressure. The inset of Fig. 10 reveals that, within measurement uncertainty, A/λ does remain constant, consolidating the conclusion that, in the propagation regime, the plasma processing parameters – and in particular P – provide an effective way to tune h(t) frontal kinetics, as described in Fig. 7 (for λ).
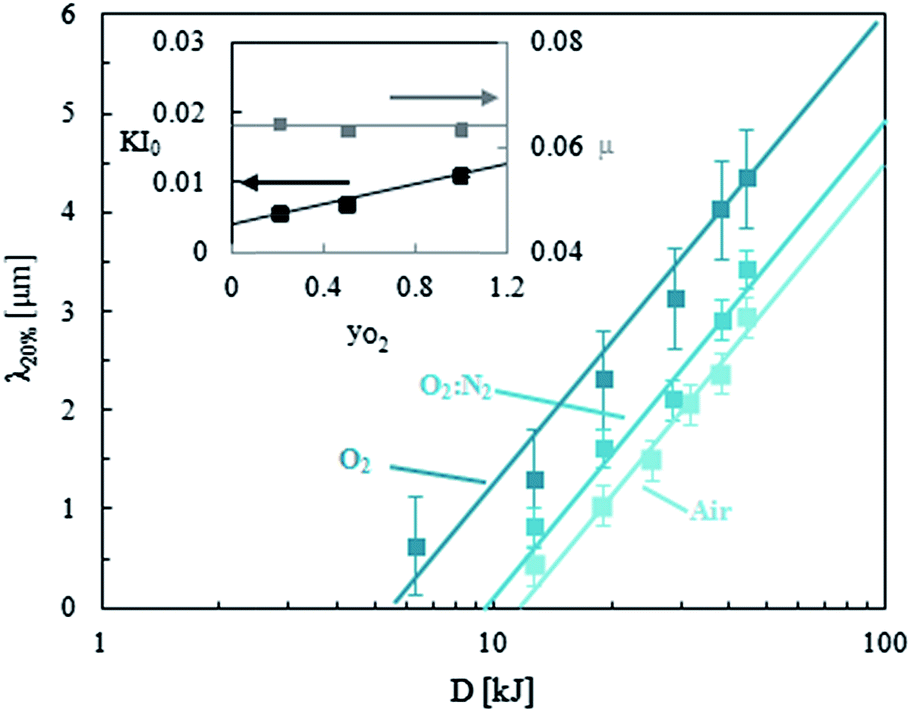
3.3 Effect of gas composition on frontal glass formation kinetics
We finally quantify the effect of the ionizing gas composition on the wrinkling profile λ and glassy film thickness h. The MHz plasma was operated with pure oxygen, air and an equimolar mixture of oxygen and nitrogen, at a constant pressure of P = 0.93 mbar, and as a function of the exposure dose D. Experimental results in the propagation regime are plotted in Fig. 11. We find that decreasing the concentration of oxygen results in slower log kinetics of glassy film formation h(t). This behaviour is expected, since the oxidation reaction slows down, as the concentration of active species decreases. Interestingly, as shown in the inset, the model parameter μ appears insensitive to gas composition, while KI0 increases linearly with the O2 content yO2. We have found as mentioned above (Section 3.1.2) that the gas pressure P affected the reaction kinetics KI0 but not μ, which can be understood as an attenuation parameter and thus a material property. Only plasma frequency, MHz or kHz, was found to affect μ. We now find that the variation of KI0 with both pressure P and yO2 is linear within the range investigated and measurement uncertainty.
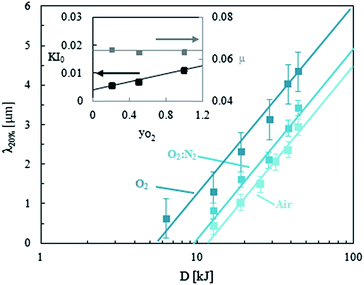 |
| | Fig. 11 Wrinkling wavelengths (λ) of PDMS samples prestrained by εprestrain = 20% and exposed to a MHz plasma, as a function of dose (D) for different ionizing gases at a constant pressure of P = 0.93 mbar. The inset shows the behaviour of the parameters of eqn (8) with the oxygen molar fraction in the gas. These were obtained through a regression using the values of h computed through (1) and taking ϕc = 0.06. | |
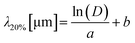
In practical terms, both increasing P and reducing the O2 content is found to result in slower glass formation kinetics and thus smaller λ and thinner glassy films h, under otherwise identical conditions. During the film propagation stage, a rather simple physical picture emerges in that eqn (8) holds and h(t) is finely tuned by P, t and p (via D), O2 composition and plasma frequency. The model parameters for λ and h are summarised in Table 1. (Graphical results for h(t) are computed in the ESI, Fig. S1 and S2†).
Table 1 Plasma-induced frontal vitrification kinetics of h and λ20% with a dose D, following eqn (8) and (1), (2). Our minimal model provides a self-consistent description of all the data in terms of the plasma frequency (kHz and MHz), pressure P [mbar], oxygen content yO2 of the ionizing gas, and exposure time t and power p, via the dose D [kJ]
|
|
|
f
|
μ [nm−1] |
KI
0 [kJ−1] |
| 13.6 MHz |
0.065 ± 0.002 |
0.0072yO2−0.0061P + 0.01053 |
| 40 kHz |
0.136 ± 0.006 |
0.0072yO2−0.0061P + 0.0147 |
|
|
|
f
|
a [μm−1] |
b [μm] |
| 13.6 MHz |
0.51 ± 0.02 |
1.68yO2−2.02P − 2.81 |
| 40 kHz |
1.07 ± 0.4 |
1.04yO2 −1.255P − 2.42 |
4 Conclusions
We have investigated the mechanism and kinetics of glassy film formation on PDMS by plasma oxidation, focusing on the resulting wrinkling profiles, wavelength λ and amplitude A, attainable by uniaxial strain. An unprecedented range of experimental processing variables was considered: the exposure time t, power p, gas pressure P, O2 composition yO2, and plasma induction frequency (kHz and MHz). Under all these conditions, the surface oxidation, densification and glass formation of PDMS induced by plasma is well described by a planar frontal process, in which the glassy skin thickness h grows logarithmically with time (or dose), and more generally with D/P. Our minimal frontal model captures the key aspects of the process and three stages, namely induction, film formation and propagation, can be identified.
Our model allows us to extract kinetic parameters μ and KI0 that are useful in describing the frontal process and provide us with two main conclusions. During the film propagation stage, the skin modulus Ēf remains unchanged and only the film thickness h evolves (logarithmically) during exposure, as seen by the constant aspect ratio A/λ and continuous log kinetics. The propagation kinetics are straightforwardly tuned by the plasma processing parameters. We find that increasing the O2 content or decreasing P accelerates the kinetics KI0, while the plasma frequency alone (MHz or KHz) defines μ, an effective attenuation parameter. Equipped with this knowledge, designing a wrinkled sinusoidal topography with prescribed A and λ becomes trivial in the propagation stage.
In the early stages of plasma exposure, the PDMS surface simultaneously increases in the modulus Ēf and thickness h.5 This means that within a range of a low plasma exposure dose, the bilayer modulus contrast is too small, and no wrinkling is observed up to large strains ε (until the material fails at εmax). We refer to this as the induction stage. Beyond this point, wrinkling can be practically attained but the coupling of increase in the modulus Ēf and thickness h with exposure defines that an effective minimum wrinkling wavelength λmin is possible. With an O2 kHz plasma, we found the value to be λmin ≈ 140 nm with a large prestrain of εprestrain ≈ 200% which brings the PDMS close to failure and compromises the reproducibility of the approach. In this work, we find that the film formation stage is also non-trivially affected by plasma processing parameters, such that a lower λmin ≈ 100 nm is readily attained, at much lower strains (εprestrain ≈ 20% demonstrated) using air, at a higher P = 1.2 mbar with a MHz plasma. These findings open an attractive and facile route for sub-100 nm PDMS wrinkling with plasma exposure by further optimisation of plasma exposure and strain parameters, by decreasing the O2 content, increasing P, decreasing D (via p and t) and increasing εprestrain to ensure that εc is exceeded.
While only uniaxial strain fields are investigated in the present work, we and others have demonstrated multiaxial mechanical strain fields, and multi-step wrinkling processes4,18,32 to controllably extend the morphologies attainable in 2D. Inexpensive, uniform, large-area, non-lithographic wrinkling at the nanoscale is attractive for a range of patterning applications, ranging from wetting and spreading of fluids and nanofluidics, to the directed assembly of complex fluids and colloids, as well as contact printing.
Acknowledgements
We acknowledge the Department of Chemical Engineering at Imperial College London for a studentship for MN, and Drs Alisyn Nedoma, Alessandra Vitale and Rajeev Dattani for assistance with AFM measurements. JTC thanks Arnaud Chiche (DSM) for many useful discussions.
Notes and references
- J. Groenewold, Phys. A, 2001, 298, 32–45 CrossRef.
- J. Genzer and J. Groenewold, Soft Matter, 2006, 2, 310–323 RSC.
- B. Li, Y. P. Cao, X. Q. Feng and H. Gao, Soft Matter, 2012, 8, 5728–5745 RSC.
- A. Chiche, C. M. Stafford and J. Cabral, Soft Matter, 2008, 4, 2360–2364 RSC.
- F. A. Bayley, J. L. Liao, P. N. Stavrinou, A. Chiche and J. T. Cabral, Soft Matter, 2014, 10, 1155–1166 RSC.
- M. Pretzl, A. Schweikart, C. Hanske, A. Chiche, U. Zettl, A. Horn, A. Boker and A. Fery, Langmuir, 2008, 24, 12748–12753 CrossRef CAS PubMed.
- N. Bowden, S. Brittain, A. G. Evans, J. W. Hutchinson and G. M. Whitesides, Nature, 1998, 393, 146–149 CrossRef CAS PubMed.
- N. Bowden, W. T. S. Huck, K. E. Paul and G. M. Whitesides, Appl. Phys. Lett., 1999, 75, 2557–2559 CrossRef CAS PubMed.
- D. Breid and A. J. Crosby, Soft Matter, 2009, 5, 425–431 RSC.
- M. Guvendiren, S. Yang and J. A. Burdick, Adv. Funct. Mater., 2009, 19, 3038–3045 CrossRef CAS.
- J. Y. Chung, A. J. Nolte and C. M. Stafford, Adv. Mater., 2009, 21, 1358–1362 CrossRef CAS.
- M. Watanabe, Polym. Adv. Technol., 2005, 16, 744–748 CrossRef CAS.
- J. R. Serrano, Q. Xu and D. G. Cahill, J. Vac. Sci. Technol., A, 2006, 24, 324–327 CAS.
- M. D. Casper, A. O. Gozen, M. D. Dickey, J. Genzer and J. P. Maria, Soft Matter, 2013, 9, 7797–7803 RSC.
- C. M. Stafford, C. Harrison, K. L. Beers, A. Karim, E. J. Amis, M. R. VanLandingham, H. C. Kim, W. Volksen, R. D. Miller and E. E. Simonyi, Nat. Mater., 2004, 3, 545–550 CrossRef CAS PubMed.
- Z. Chen, R. Wencai, L. Gao, B. Liu, S. Pei and H. M. Cheng, Nat. Mater., 2011, 10, 424–428 CrossRef CAS PubMed.
- S. J. Chae, F. Gunes, K. K. Kim, E. S. Kim, G. H. Han, S. M. Kim, H. J. Shin, S. M. Yoon, J. Y. Choi, M. H. Park, C. W. Yang, D. Pribat and Y. H. Lee, Adv. Mater., 2009, 21, 2328–2333 CrossRef CAS.
- D. B. H. Chua, H. T. Ng and S. F. Y. Li, Appl. Phys. Lett., 2000, 76, 721 CrossRef CAS PubMed.
- I. D. Johnston, D. K. McCluskey, C. K. L. Tan and M. C. Tracey, J. Micromech. Microeng., 2014, 24, 035017 CrossRef.
- K. M. Choi and J. A. Rogers, J. Am. Chem. Soc., 2003, 125, 4060–4061 CrossRef CAS PubMed.
- M. Demir, Y. Menceloglu and B. Erman, Polymer, 2005, 46, 4127–4134 CrossRef CAS PubMed.
- K. Efimenko, W. E. Wallace and J. Genzer, J. Colloid Interface Sci., 2002, 254, 306–315 CrossRef CAS.
- M. J. Owen and P. J. Smith, J. Adhes. Sci. Technol., 1994, 8, 1063–1075 CrossRef CAS PubMed.
- H. Hillborg and U. W. Gedde, Polymer, 1998, 39, 1991–1998 CrossRef CAS.
- M. Ouyang, C. Yuan, R. J. Muisener, A. Boulares and J. T. Koberstein, Chem. Mater., 2000, 12, 1591–1596 CrossRef CAS.
- J.-Y. Park, H. Y. Chae, C. H. Chung, S. J. Sim, J. Park, H. H. Lee and P. J. Yoo, Soft Matter, 2010, 6, 677–684 RSC.
-
P. A. Sturrock, Plasma Physics : Introduction to the Theory of Astrophysical, Geophysical and Laboratory Plasma, Cambridge University Press, 1994 Search PubMed.
- K. Efimenko, M. Rackaitis, E. Manias, A. Vaziri, L. Mahadevan and J. Genzer, Nat. Mater., 2005, 4, 293–297 CrossRef CAS PubMed.
-
H. G. Allen, Analysis and Design of Structural Sandwich Panels, Pergamon, New York, 1969 Search PubMed.
- A. L. Volynskii, S. Bazhenov, O. V. Lebedeva and N. F. Bakeev, J. Mater. Sci., 2000, 35, 547–554 CrossRef CAS.
- R. Huang, J. Mech. Phys. Solids, 2005, 53, 63–89 CrossRef PubMed.
- P. C. Lin and S. Yang, Appl. Phys. Lett., 2007, 90, 241903 CrossRef PubMed.
- S. Cai, D. Breid, A. J. Crosby, Z. Suo and J. W. Hutchinson, J. Mech. Phys. Solids, 2011, 59, 1094–1114 CrossRef PubMed.
- H. Jiang, D. Y. Khang, J. Song, Y. Sun, Y. Huang and J. A. Rogers, Proc. Natl. Acad. Sci. U. S. A., 2007, 104, 15607–15612 CrossRef CAS PubMed.
- J. Song, H. Jiang, Z. J. Liu, D. Y. Khang, Y. Huang, J. A. Rogers, C. Lu and C. G. Koh, Int. J. Solids Struct., 2008, 45, 3107–3121 CrossRef PubMed.
- C. Harrison, C. M. Stafford, W. Zhang and A. Karim, Appl. Phys. Lett., 2004, 85, 4016–4018 CrossRef CAS PubMed.
- H. Jiang, D. Y. Khang, H. Fei, H. Kim, Y. Huang, J. Xiao and J. A. Rogers, J. Mech. Phys. Solids, 2008, 56, 2585–2598 CrossRef CAS PubMed.
- H. Vandeparre, M. Pineirua, F. Brau, B. Roman, J. Bico, C. Gay, W. Bao, C. N. Lau, P. M. Reis and P. Damman, Phys. Rev. Lett., 2011, 106, 224301 CrossRef.
- L. Pocivavsek, R. Dellsy, A. Kern, S. Johnson, B. Lin, K. Y. C. Lee and E. Cerda, Science, 2008, 320, 912–916 CrossRef CAS PubMed.
- F. Brau, H. Vandeparre, A. Sabbah, C. Poulard, A. Boudaoud and P. Damman, Nat. Phys., 2011, 7, 56–60 CrossRef CAS.
- J. T. Cabral, S. D. Hudson, C. Harrison and J. F. Douglas, Langmuir, 2004, 20, 10020–10029 CrossRef CAS PubMed.
- J. T. Cabral and J. F. Douglas, Polymer, 2005, 46, 4230–4241 CrossRef CAS PubMed.
- J. A. Warren, J. T. Cabral and J. F. Douglas, Phys. Rev. E: Stat., Nonlinear, Soft Matter Phys., 2005, 72, 021801 CrossRef.
-
J. Townsend, The Theory of Ionization of Gases by Collision, Constable, London, 1910 Search PubMed.
-
E. M. Bazelyan and Y. P. Raizer, Spark Discharges, CRS Press, New York, 1998 Search PubMed.
- H. Hillborg, J. F. Ankner, U. W. Gedde, G. D. Smith, H. K. Yasuda and K. Wikström, Polymer, 2000, 41, 6851–6863 CrossRef CAS.
Footnote |
| † Electronic supplementary information (ESI) available. See DOI: 10.1039/c4sm02840f |
|
| This journal is © The Royal Society of Chemistry 2015 |
Click here to see how this site uses Cookies. View our privacy policy here. 
 Open Access Article
 This Open Access Article is licensed under a


 and ϕc determined by the intercept of the graph (and decoupled by a series of self-consistent experiments at various P). Furthermore, we found that the plasma dose (D ≡ p × t) captured the combined effects of the changing plasma power p and exposure time t5, and D thus collapses all the experimental results for h or λ at different P and t. We therefore re-write the previous expression as