 Open Access Article
Creative Commons Attribution 3.0 Unported Licence
Influence of ligand distribution on uptake efficiency†
Veronika
Schubertová
a,
Francisco J.
Martinez-Veracoechea
b and
Robert
Vácha
*c
aFaculty of Science, Masaryk University, Kotlárská 2, 611 37 Brno, Czech Republic
bInfochem-KBC, 23 Queen Elizabeth Street, London SE1 2LP, UK
cFaculty of Science and CEITEC – Central European Institute of Technology, Masaryk University, Kamenice 5, 625 00 Brno, Czech Republic. E-mail: robert.vacha@mail.muni.cz; robertvacha@gmail.com
First published on 16th February 2015
Abstract
Cellular uptake is a crucial process in nanomedicine and drug-delivery; however, the factors that affect its efficiency/speed are not well understood. We report computer simulations on passive uptake via receptor-mediated endocytosis of nanoparticle coated with ligands. In particular, we study how the distribution of ligands on the nanoparticle surface influences the uptake rate. The speed of membrane wrapping and uptake was found to be the fastest for nanoparticles with homogeneous ligand distributions, where ligands are spread evenly on the surface. We show that the diffusion of the ligands on the nanoparticle can hinder its uptake, since upon the interaction with the membrane the ligand distribution becomes extremely inhomogeneous, with a large ligand-free patch. When the ligand-free-area was more than 20% of the surface, we did not observe uptake within the scale of our simulations.
1 Introduction
Understanding and controlling nanoparticle uptake across cellular membranes is a key step in nanomedicine development.1,2 It was recently shown that the process of nanoparticle internalization via receptor mediated endocytosis can be spontaneous for homogeneous nanoparticles.3–8 The thermodynamic force that drives the passive endocytosis is mediated by interactions between membrane receptors and nanoparticle ligands. Once internalized, the nanoparticle remains encapsulated by the membrane, from which it can be released upon a change of pH or other external conditions.9 Different chemical compositions and shapes of nanoparticles have been recently studied.4,5,7,10–15 However, the uptake dependence on different ligand distributions on the nanoparticle surface remains unknown.Many nanoparticles are inspired by virus capsids, where ligand distribution corresponds to the surface distribution of receptor binding sites, also known as virus attachment protein positions. Such distribution follows the symmetry of the virus capsid but is generally not known. A few examples have been recently revealed by cryo-electron microscopy. The virus family Picornaviridiae, which includes the Rhinovirus and Poliovirus species, has 60 binding sites located between the binate and the quintet symmetry axis on an icosahedral capsid.16 On the Canine Parvovirus capsid the receptor binds to the center of the face on the capsid.17
As we are interested in the generic aspects of how the ligand distribution influences endocytosis, we use a simplified coarse grained model. We employed icosahedral shape particles, because it is the most common shape of virus capsids and is close to spherical nanoparticles. The effect of nanoparticle shape has been investigated before.4,18–20 We performed Molecular Dynamics (MD) simulations of nanoparticles in contact with a tensionless phospholipid membrane and studied the uptake process with focus on the influence on the uptake time by the concentration and distribution of binding sites on the nanoparticle surface.
2 Methods
We employed an implicit-solvent coarse-grained model, in which the phospholipid molecules are represented by three-bead chains.21 The first bead (hydrophilic headgroup) is purely repulsive, while the other two beads, representing hydrophobic tails, attract each other. Half of the lipids had a modified headgroup bead to act as simplified model receptors. The excess of receptors was chosen not only to eliminate the effects of receptor diffusion but also to mimic the important case of cancer cells, where membrane receptors are usually overexpressed.22 We constructed the model bilayer from 8000 phospholipid molecules, placed in a rectangular box with periodic boundary conditions.Nanoparticles were made of beads of the same size as phospholipids and are mostly hydrophilic (i.e., purely repulsive). Specific numbers of beads (ligands) were made attractive to the membrane receptors (short range attraction with 8 kT minimum) and the positions of these beads were varied to represent different ligand distributions. The nanoparticle shell was made of 792 beads resulting in a diameter of about 13 nm. The choice of the model and its parameters is based on our previous studies where we investigated the uptake of nanoparticles with random homogeneous ligand distributions affected by the nanoparticle size, shape, total number of ligands, and strength of the ligand–receptor interaction. More details about the model and the uptake results can be found in ref. 4 and 9. Note that a tension-less membrane is a valid assumption to study nanoparticles of sizes up to a few hundred nanometers, beyond which the cellular tension (in order 3 × 10³ to 1 dyn cm−1)23 will start to play a role.24 The simulation time unit τ can be related to 100 ns based on the lipid diffusion; however, this should be considered as a very rough estimate since hydrodynamic effects are missing in our implicit solvent model.
3 Results and discussion
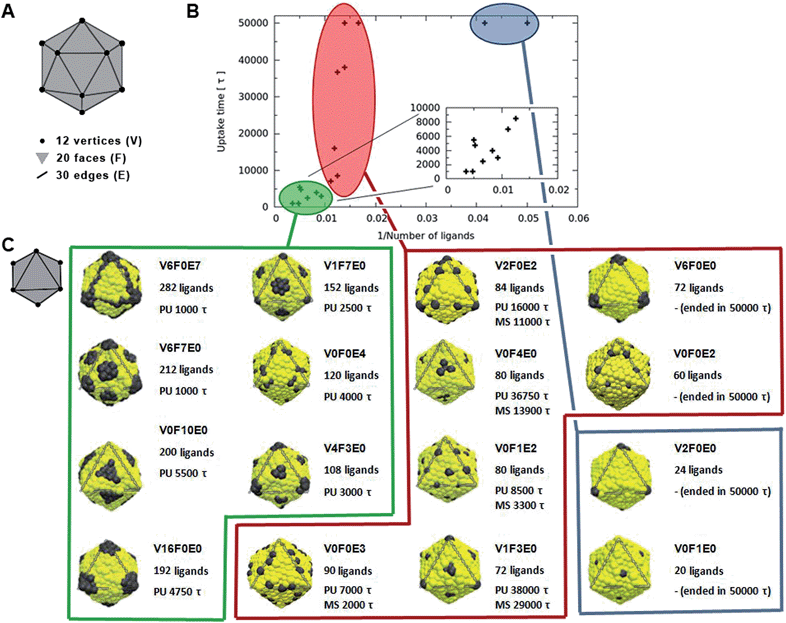
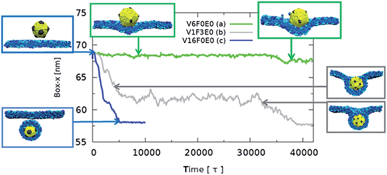
The dependence of the rate of passive endocytosis on the nanoparticle ligand distribution was investigated on 12 symmetric distributions (see in Fig. 1). Distributions were named with a key VxFxEx, where x corresponds to the number of ligands located at a single icosahedral vertex (V), face (F), and/or edge (E) (see Fig. 1A). There are 12 vertices, 20 faces, and 30 edges on an icosahedron, when multiplied by the corresponding number of ligands on V, F, or E we obtain the total number of ligands on the nanoparticle. The ligands were distributed with the symmetry of the given location, meaning 5-fold symmetry axis in vertices, 3-fold symmetry axis in the middle of faces, and 2-fold symmetry axis in the middle of edges.In Fig. 2 we plot the lateral dimension of the simulation box versus time for the different nanoparticle patterns. The lateral dimension of the simulation box (either x or y) is a good indicator of the amount of wrapping. This is because as the nanoparticle is wrapped with the membrane, the cross-section of the simulation box must diminish in order to satisfy the zero-tension constrain.
During our simulations we observed three types of uptake behaviors: (a) spontaneous direct uptake without metastable states; (b) uptake with metastable states; (c) no uptake (see Fig. 2).
Nanoparticles with a small (up to 72) number of ligands that cover up to 8% of its surface (V6F0E0, V0F0E2, V2F0E0, and V0F1E0) did not pass through the membrane and remained attached to the membrane within the timescale of our simulation. This means that nanoparticles were attached for more than 50![[thin space (1/6-em)]](https://www.rsc.org/images/entities/char_2009.gif) 000τ and ended with different levels of wrapping. Namely, the distributions V6F0E0, V0F0E2, V2F0E0, and V0F1E0 lead to about 50%, 50%, 25%, and 10% respectively nanoparticle wrapping at the end of the simulation (degree of wrapping was estimated visually from the surface area in contact with the membrane and from the ligand–receptor interaction energy).
000τ and ended with different levels of wrapping. Namely, the distributions V6F0E0, V0F0E2, V2F0E0, and V0F1E0 lead to about 50%, 50%, 25%, and 10% respectively nanoparticle wrapping at the end of the simulation (degree of wrapping was estimated visually from the surface area in contact with the membrane and from the ligand–receptor interaction energy).
Nanoparticles with more than 100 ligands, which is roughly one seventh of the nanoparticle surface, typically were uptaken fast without any metastable states (green points in Fig. 1B). This holds for distributions named V6F0E7, V6F7E0, V0F10E0, V16F0E0, V1F7E0, V0F0E4, and V4F3E0. The time needed for the uptake ranged from 1000τ to 5500τ with distributions V6F0E7 and V6F7E0 being the fastest. The estimated uptake time error is about 500–2000τ (see ESI†). The larger error (2000τ) is for simulations with metastable states due to their stochastic behavior. The error could be decreased by the repetition of simulations, which has not been carried out due to computational expenses.
The most interesting case was those nanoparticles with a medium number of ligands, for which the effect of ligand distribution was the most significant (red points in Fig. 1B). The effect was so dramatic that even though all the nanoparticles had roughly 80 ligands, the uptake behaviour could vary from fast uptake (below 10![[thin space (1/6-em)]](https://www.rsc.org/images/entities/char_2009.gif) 000τ) to no uptake at all within the whole range of our simulation (50
000τ) to no uptake at all within the whole range of our simulation (50![[thin space (1/6-em)]](https://www.rsc.org/images/entities/char_2009.gif) 000τ).
000τ).
The ligand distributions were more efficient when located at edges than at faces and the least efficient were distributions at vertices. This correlates well with the increasing number of position symmetry (2, 3, and 5) or the decreasing number of places (icosahedron has 30 edges, 20 faces, and 12 vertices). This clearly suggests that the most homogeneous distributions with ligands evenly spread are the most efficient. Indeed, the distributions V1F7E0 and V4F3E0 with 152 and 108 ligands had smaller uptake time (by 2000τ) than distributions V0F10E0 and V16F0E0 with 200 and 192 ligands, respectively (see the inset in Fig. 1B). Thus, it is demonstrated that on certain circumstances ligand distribution can be more critical than the number of ligands in determining the rate of uptake. The effect of ligand distribution is expected to be enhanced for larger particles and/or lower receptor concentrations.
To rationalize why a homogenous ligand distribution has a faster rate of uptake, we need to remember that the uptake process is a compromise between the energy increase due to bending of the membrane and the energy decrease due to ligand–receptor interactions.4 Once the first ligand–receptor contacts are formed, further wrapping is driven by the energy gain associated with further ligand–receptor contacts. However, if ligands are not distributed homogenously on the nanoparticle surface (i.e., they are highly concentrated on a few localized points which are far apart from each other) the wrapping process must incur a high penalty in bending energy before it can be rewarded by achieving new ligand–receptor contacts. Therefore, in this case, the wrapping process has a high activation energy, which consequently hinders the uptake process. However, wrapping can still occur via thermal fluctuations. We have observed two types of such fluctuations, particularly visible in longed lived metastable states: (1) fluctuations of the membrane shape and (2) nanoparticle rotations (see Fig. S2†). Naturally, larger fluctuations have higher activation energy and are therefore less likely to happen. As a result, heterogeneous distributions have a slower uptake rate via receptor-mediated endocytosis. As an example of homogeneous and heterogeneous distributions with about the same number of ligands see distributions V0F1E2 and V6F0E0, respectively in Fig. 1C.
In many applications, ligands may not be fixed on the nanoparticle surface as employed above, but instead they are mobile. Diffusion of ligands on the nanoparticle surface can dynamically change ligand distributions. We tested the effect of ligand mobility by replacing the nanoparticle with a small vesicle, where half of the lipid headgroups were modified as ligands, which remained free to diffuse as lipids. It has been shown that such vesicles can interact with a membrane in various ways.5 For our purpose we focused on a path where the membrane wraps around the vesicle as it was a hard nanoparticle (see Fig. 3). Most of the ligands diffused into contact with the membrane (i.e., the vesicle became polarized), creating a part of the vesicle (a patch) that was almost ligand free, seemingly hindering the uptake.
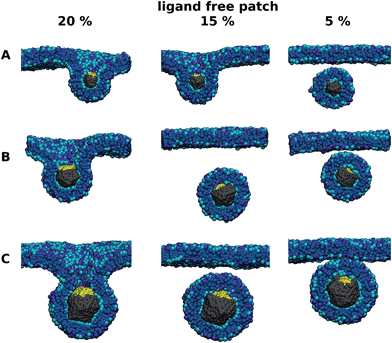
In order to avoid the effects of vesicle flexibility5,25 and further investigate the influence of ligand free patches on uptake efficiency of nanoparticles, we studied particles with three different diameters (5, 8, and 12 nm), where a ligand-free-area with 5-fold symmetry was constructed. Within the timescale of our simulations nanoparticles with a ligand-free area larger than 20% of the surface did not undergo the uptake. In the case of the nanoparticle with a diameter of only about 5 nm, already 10% of the ligand-free-area prevented the uptake (see Fig. 4). Note that the nanoparticles always rotated in such a way that the patch was wrapped last, if at all. This rotation is in line with the reported change of nanoparticle orientation during the membrane wrapping, which was shown to finish with the least energetically favorable part.4,18,20,26,27 This part can be calculated from the difference between the local membrane bending and receptor–ligand binding energy.
Therefore, nanoparticles where ligands can diffuse on the particle surface might be inefficient for the uptake unless almost the whole (more than 80%) of the surface is covered with ligands. As shown above the ligand-free patch on the nanoparticle can inhibit or significantly slow down the uptake. Note that in practice the polarization, i.e. accumulation of ligands on one side, can be hindered via slower diffusion (kinetically) or repulsion between the ligands (thermodynamically).
Our results suggest that nanoparticles where the ligands are all distributed on one side can be inefficient for the uptake unless almost the whole (more than 80%) of the surface is covered with ligands. This is in sharp contrast with only 10% ligands needed when the distribution is homogeneous.
4 Conclusions
To summarize, we investigated the effect of ligand distribution on the passive uptake of receptor-mediated endocytosis. In agreement with previous studies4 we found that nanoparticles with high coverage (number of ligands) can be spontaneously wrapped and uptaken, while nanoparticles with low coverage were not uptaken. Moreover, the nanoparticles with mid-range coverage (about 10% of the surface) could be uptaken, but the uptake time depended dramatically upon ligand distribution. The fastest nanoparticles had the most homogeneous ligand distribution, which can be understood in terms of low activation energy needed to wrap the nanoparticle.We also found that ligand-free patches slow down the uptake, which can be completely prevented if the ligand-free area is large enough. Within the nanometer size of our nanoparticles and the timescale of our simulations, the threshold area for preventing uptake was only weakly dependent on the radius, and was about 20% of the surface. It means that nanoparticles where the ligands are all distributed on one side can be inefficient for the uptake unless more than 80% of the surface is covered with ligands. This is in sharp contrast with only 10% ligands needed when the distribution is homogeneous demonstrating the importance of ligand distribution. This has important consequences also for nanoparticles with ligands that can diffuse on the surface, as ligand-free patches can spontaneously occur upon interactions with membrane receptors.
Acknowledgements
This work was supported by the Czech Science Foundation (grant 14-12598S), the EU 7th Framework (contract no. 286154 – SYLICA) and the European Regional Development Fund (CZ.1.05/1.1.00/02.0068 CEITEC). Computational resources were provided by the MetaCentrum under the program LM2010005 and the CERIT-SC under the program Centre CERIT Scientific Cloud, part of the Operational Program Research and Development for Innovations, Reg. no. CZ.1.05/3.2.00/08.0144.References
- B. J. Reynwar, G. Illya, V. a. Harmandaris, M. M. Muller, K. Kremer and M. Deserno, Nature, 2007, 447, 461–464 CrossRef CAS PubMed.
- K. Yang and Y.-Q. Ma, Nat. Nanotechnol., 2010, 5, 579–583 CrossRef CAS PubMed.
- O. Le Bihan, P. Bonnafous, L. Marak, T. Bickel, S. Trépout, S. Mornet, F. De Haas, H. Talbot, J.-C. Taveau and O. Lambert, J. Struct. Biol., 2009, 168, 419–425 CrossRef CAS PubMed.
- R. Vácha, F. J. Martinez-Veracoechea and D. Frenkel, Nano Lett., 2011, 11, 5391–5395 CrossRef PubMed.
- T. Yue and X. Zhang, Soft Matter, 2013, 9, 559–569 RSC.
- H. Yuan, J. Li, G. Bao and S. Zhang, Phys. Rev. Lett., 2010, 105, 138101 CrossRef.
- X. Yi, X. Shi and H. Gao, Phys. Rev. Lett., 2011, 107, 098101 CrossRef.
- H.-M. Ding and Y.-Q. Ma, Small, 2014, 1–17 Search PubMed.
- R. Vácha, F. J. Martinez-Veracoechea and D. Frenkel, ACS Nano, 2012, 6, 10598–10605 Search PubMed.
- H.-m. Ding and Y.-q. Ma, Biomaterials, 2012, 33, 5798–5802 CrossRef CAS PubMed.
- Y. Li, T. Yue, K. Yang and X. Zhang, Biomaterials, 2012, 33, 4965–4973 CrossRef CAS PubMed.
- S. Nangia and R. Sureshkumar, Langmuir, 2012, 28, 17666–17671 CrossRef CAS PubMed.
- K. Niikura, T. Matsunaga, T. Suzuki, S. Kobayashi, H. Yamaguchi, Y. Orba, A. Kawaguchi, H. Hasegawa, K. Kajino, T. Ninomiya, K. Ijiro and H. Sawa, ACS Nano, 2013, 7, 3926–3938 CrossRef CAS PubMed.
- M. Joglekar, R. A. Roggers, Y. Zhao and B. G. Trewyn, RSC Adv., 2013, 3, 2454–2461 RSC.
- S. Bhattacharjee, I. M. C. M. Rietjens, M. P. Singh, T. M. Atkins, T. K. Purkait, Z. Xu, S. Regli, A. Shukaliak, R. J. Clark, B. S. Mitchell, G. M. Alink, A. T. M. Marcelis, M. J. Fink, J. G. C. Veinot, S. M. Kauzlarich and H. Zuilhof, Nanoscale, 2013, 5, 4870–4883 RSC.
- M. G. Rossmann, Y. He and R. J. Kuhn, Trends Microbiol., 2002, 10, 324–331 CrossRef CAS.
- S. Hafenstein, L. M. Palermo, V. a. Kostyuchenko, C. Xiao, M. C. Morais, C. D. S. Nelson, V. D. Bowman, A. J. Battisti, P. R. Chipman, C. R. Parrish and M. G. Rossmann, Proc. Natl. Acad. Sci. U. S. A., 2007, 104, 6585–6589 CrossRef CAS PubMed.
- C. Huang, Y. Zhang, H. Yuan, H. Gao and S. Zhang, Nano Lett., 2013, 4546–4550 CrossRef CAS PubMed.
- R. Guo, J. Mao and L.-T. Yan, ACS Nano, 2013, 7, 10646–10653 CrossRef CAS PubMed.
- S. Dasgupta, T. Auth and G. Gompper, Nano Lett., 2014, 14, 687–693 CrossRef CAS PubMed.
- I. R. Cooke and M. Deserno, J. Chem. Phys., 2005, 123, 224710 CrossRef PubMed.
- Y. Mosesson, G. B. Mills and Y. Yarden, Nat. Rev. Cancer, 2008, 8, 835–850 CrossRef CAS PubMed.
- C. Morris and U. Homann, J. Membr. Biol., 2001, 179, 79–102 CAS.
- M. Deserno, Phys. Rev. E: Stat. Phys., Plasmas, Fluids, Relat. Interdiscip. Top., 2004, 69, 031903 CrossRef.
- X. Yi, X. Shi and H. Gao, Phys. Rev. Lett., 2011, 107, 098101 CrossRef.
- X. Shi, A. von dem Bussche, R. H. Hurt, A. B. Kane and H. Gao, Nat. Nanotechnol., 2011, 6, 714–719 CrossRef CAS PubMed.
- K. Yang, B. Yuan and Y.-q. Ma, Nanoscale, 2013, 5, 7998–8006 RSC.
Footnote |
| † Electronic supplementary information (ESI) available. See DOI: 10.1039/c4sm02815e |
| This journal is © The Royal Society of Chemistry 2015 |


