
 Open Access Article
 This Open Access Article is licensed under a
 Creative Commons Attribution 3.0 Unported Licence
On the formation of dendrimer/nucleolipids surface films for directed self-assembly†
Marianna Yanez
Arteta
*a,
Debora
Berti
b,
Costanza
Montis
b,
Richard A.
Campbell
c,
Caroline
Eriksson
a,
Luke A.
Clifton
d,
Maximilian W. A.
Skoda
d,
Olaf
Soltwedel
e,
Alexandros
Koutsioubas
f,
Piero
Baglioni
b and
Tommy
Nylander
*a
aPhysical Chemistry, Department of Chemistry, Lund University, P. O. Box 124, S-221 00 Lund, Sweden. E-mail: Marianna.Yanez@fkem1.lu.se; Tommy.Nylander@fkem1.lu.se
bCSGI and Department of Chemistry Ugo Schiff, University of Florence, Florence, Italy
cInstitut Laue-Langevin, 71 avenue des Martyrs, CS 20156, 38042 Grenoble Cedex 9, France
dISIS Pulsed Neutron and Muon Source, Science and Technology Facilities Council, Rutherford Appleton Laboratory, Harwell, Oxfordshire OX11 OQX, UK
eMax-Planck-Institute for Solid State Research, Outstation at MLZ, Lichtenbergstr. 1, 85747 Garching, Germany
fJülich Centre for Neutron Science, Outstation at MLZ, Lichtenbergstr. 1, 85747 Garching, Germany
First published on 9th January 2015
Abstract
We describe the formation and structure of nucleolipid/dendrimer multilayer films controlled by non-covalent interactions to obtain biomaterials that exhibit molecular recognition of nucleic acids. Layers of cationic poly(amidoamine) (PAMAM) dendrimers of generation 4 and the anionic nucleolipids 1,2-dilauroyl-sn-glycero-3-phosphatidylnucleosides (DLPNs) based on uridine (DLPU) and adenosine (DLPA) were first formed at the silica–water interface. The PAMAM/DLPN layers were then exposed to short oligonucleotides, polynucleotides and single stranded DNA (ssDNA). The interfacial properties were characterized using quartz crystal microbalance with dissipation monitoring, attenuated total reflection Fourier transform infrared spectroscopy and neutron reflectometry. Both types of DLPN were found to adsorb as aggregates to preadsorbed PAMAM monolayers with a similar interfacial structure and composition before rinsing with pure aqueous solution. Nucleic acids were found to interact with PAMAM/DLPA layers due to base pairing interactions, while the PAMAM/DLPU layers did not have the same capability. This was attributed to the structure of the DLPA layer, which is formed by aggregates that extend from the interface towards the bulk after rinsing with pure solvent, while the DLPU layer forms compact structures. In complementary experiments using a different protocol, premixed PAMAM/DLPN samples adsorbed to hydrophilic silica only when the mixtures contained positively charged aggregates, which is rationalized in terms of electrostatic forces. The PAMAM/DLPA layers formed from the adsorption of these mixtures also bind ssDNA although in this case the adsorption is mediated by the opposite charges of the film and the nucleic acid rather than specific base pairing. The observed molecular recognition of nucleic acids by dendrimers functionalized via non-covalent interactions with nucleolipids is discussed in terms of biomedical applications such as gene vectors and biosensors.
Introduction
Poly(amidoamine) (PAMAM) dendrimers have, with their well-defined hyperbranched architecture, high potential to be employed in biomedical applications such as the encapsulation of drugs, gene delivery vehicles and bioanalysis.1–4 Dendrimers are monodisperse and symmetric as they are synthesized in a controlled sequence to produce different “generations” (G) depending on their size, molecular weight and level of branching. The chemical structure of PAMAM dendrimers, as reported in 1985 by Tomalia et al.,5 is based on an ethylenediamine or amine core and repeating units of amidoamine as branches with amine surface groups. The primary amine groups at the periphery of the dendrimer have a pKa between 8.0 and 9.2 and therefore they are positively charged at neutral pH.6 These surface groups allow the dendrimers to interact with other charged molecules and interfaces. The electrostatic attraction between PAMAM dendrimers and oppositely charged nucleic acids, such as DNA and RNA, leads to compaction and condensation. The formed PAMAM/DNA complexes protect DNA from enzymatic degradation and they show high transfection to cells compared to other polymeric alternatives.2 Such delivery vehicles for gene therapy have been shown to have potential for disease prevention7 and medical treatments.8,9 However, ordinary PAMAM dendrimers lack chemical affinity towards nucleic acids and thus they can interact also with cell membranes and other negatively charged biomolecules. Functionalization of the dendrimer surface groups through, for example, covalent coupling of DNA strands,10 has potential to provide the necessary specificity.Alternatively, molecules with capability for molecular recognition, like nucleolipids, have been shown to interact selectively with nucleic acids,11 which may also be useful for the formulation of gene transfection vectors.12 Nucleolipids are derivatives of phospholipids where the choline in the head group has been exchanged for a nucleoside by enzyme catalyzed transphosphatidylation to form phosphatidylnucleosides.13,14 Such lipids, with the combination of the nucleoside and the negatively charged phosphate group, contain the key elements of the monomer unit of nucleic acids. Consequently, their head group gives them the ability to exhibit molecular recognition of DNA and RNA through base pairing interactions. This specific base pairing has been investigated previously by many groups. For example, Ahlers et al.15 showed that amphiphiles that have head groups functionalized with nucleobases form stable monolayers at the air–water interface to which monomeric and polymeric nucleotides from the bulk solution can attach through specific base pair interactions. Later, monolayers of dioleoylphosphatidylnucleosides (DOPNs) based in adenosine, uridine and cytidine at the air–water interface were also studied. The results showed preferential interaction within complementary DOPNs, which indicated that Watson–Crick pairing had occurred at the interface.16 It was suggested that the orientation of the nucleolipids imposed by the interface provided a suitable environment for base pairing. In addition, the corresponding specific interactions between the nucleolipid bases and other nucleolipids as well as short and long polynucleotides have also been found in the bulk solution.11,17–20
Similar to other amphiphiles, nucleolipids self-assemble in aqueous media into different type of aggregates, e.g. spherical micelles, threadlike micelles or bilayers, depending on the structure of the hydrophobic tail and the interactions between the head groups of the nucleoside.17,21,22 An understanding of the self-assembly behavior is important to rationalize the interactions of these molecules with RNA and DNA. For example, palmitoyl-oleoylphosphatidylnucleosides (POPNS) form a bilayer-type structure in aqueous dispersions, and at low water content a lamellar phase is formed. Fourier transform infrared (FT-IR) linear dichroism measurements of these samples showed that the head group of the POPNs based in uridine (POPU) had a different orientation at the bilayer interface compared to the ones based in adenosine (POPA).22 Consequently, it was found that short and long polynucleotides bind selectively to POPA bilayers, but POPU bilayers showed weaker attractive interactions with such nucleic acids.20 Shorter chain nucleolipids, e.g. 1,2-dilauroyl-sn-glycero-3-phosphatidylnucleoside (DLPNs) based in uridine (DLPU) and adenosine (DLPA), show different types of aggregates in aqueous solutions. DLPU forms threadlike micelles in solution that grow in length depending on the solvent ionic strength23 and the nucleolipid concentration.18 However, DLPA self-assembles initially into the same type of threadlike micelles, but they aggregate with time into giant helicoidal superstructures.18 These differences have been attributed to a stronger enthalpic contribution from the purine–purine base stacking interactions for DLPA compared with pyrimidine–pyrimidine for DLPU.18
The aims of the present work are to reveal the factors controlling the interactions between PAMAM dendrimers of generation 4 (PAMAM-G4, 64 surface groups) and the nucleolipids DLPA and DLPU at the silica–water interface as well as to determine the ability of the formed interfacial structures to bind selectively short and long nucleic acids. The size and structure of PAMAM-G4 are usually compared with biological molecules such as globular proteins24 or the histone octamer25,26 and therefore it is interesting for applications such as DNA condensation. The study was performed using a solid support since structural information can be obtained conveniently with high precision through the combination of complementary surface-sensitive techniques. The measurements were performed in two different aqueous solvents, 10 mM NaCl and 10 mM Tris–HCl pH 7.6 buffer. The first buffer allows the comparison of the present results with our previous measurements on the interactions between dendrimers and oppositely charged surfactants at the solid–liquid interface.27 The second buffer was chosen since it is more commonly used in studies relating to biomedical applications.
The layers were formed using two different protocols to evaluate the structure of the films in the absence and presence of dendrimer/nucleolipid bulk interactions: (1) addition of DLPNs to preadsorbed PAMAM-G4 monolayers on silica and (2) adsorption from premixed dendrimer/nucleolipid solutions. The reversibility of the adsorption was evaluated by rinsing with pure solvent (free of dendrimer and nucleolipid) after the addition of the different components or mixtures. Following the structural characterization of the PAMAM/DLPN interfacial layers formed, the selectivity of their interactions with nucleic acids was examined through the addition of (i) two different 20-mers short oligonucleotides based in purine (adenosine, 20dA) or pyrimidine (thymidine, 20dT) nucleotides, (ii) a longer RNA derivative (polyuridylic acid, PolyU), and (iii) single stranded DNA (ssDNA).
The interfacial properties were characterized using a combination of measurements: quartz crystal microbalance with dissipation monitoring (QCM-D) to obtain the total interfacial wet mass and the viscosity properties of the films, attenuated total reflectance (ATR) FT-IR spectroscopy to identify the chemical bonds of the molecules at the surface and the interactions of the nucleobases, and neutron reflectometry (NR) to determine the structure and composition of the adsorbed layers in the direction normal to the interface. The binding of the nucleolipid to the dendrimer in the bulk solution was also analyzed by electrophoretic mobility measurements.
We discuss the results in the context of the potential benefits of non-covalent functionalization of dendrimers by direct self-assembly as well as their possible applications such as gene therapy and bioanalysis sensors.
Experimental section
Materials and sample preparation
The samples were prepared in deionized water, which had been passed through a purification system (Milli-Q, resistivity = 18.2 mΩ cm, organic content = 4 ppb), and/or D2O (Sigma-Aldrich). The samples of PAMAM dendrimers with an ethylenediamine core, generation 4 (G4, 10 wt% in methanol, Sigma-Aldrich) were dried in a vacuum oven for 1 day before dissolution in the solvent. 1,2-Dilauroyl-sn-glycero-3-phosphoadenosine (DLPA) and 1,2-dilauroyl-sn-glycero-3-phosphouridine (DLPU) were synthesized from 1,2-dilauroyl-sn-glycero-3-phosphocholine (DLPC, Avanti Polar Lipids). The synthesis was carried out with standard fully hydrogenous DLPC or with DLPC with deuterated lauroyl chains to form hydrogenous (hDLPNs) and deuterated (dDLPNs) nucleolipids, respectively. DLPNs were obtained as ammonium salts according to the synthetic procedure described previously.18 The other reagents used in the synthesis were adenine, uridine, hydrochloric acid, chloroform, ammonia (33% aqueous solution) and methanol (all from Fluka), and phospholipase D from Streptomyces sp AA586 (a generous gift from Asahi Chemical Industry Co., Ltd, Tokyo, Japan). The samples of DLPNs were prepared immediately before the measurements to avoid the effects of time-dependent aggregation processes in the bulk.18 The solvent was 10 mM NaCl (Suprapure 99.99%, Merck), adjusted to pH 7.2–7.4 by adding small volumes of concentrated hydrochloric acid (Merck, for analysis 37%) or sodium hydroxide (Sigma-Aldrich), or 10 mM Tris–HCl buffer (Trizma Base, 99.9% titration, Sigma-Aldrich) with a pH of 7.6.Short oligonucleotides with 20-mers based in adenosine (20dA) or thymidine (20dT) were custom made (ATDbio Ltd). The long polynucleotide, PolyU (Sigma-Aldrich), had a molecular weight between 800 to 1000 kDa. The DNA sample was obtained from Luciferase T7 plasmid DNA of 4331 base pairs (Promega) and it was amplified and purified as described previously elsewhere.28 Double stranded DNA (dsDNA) was diluted to approximately half of the final intended concentration of ssDNA in 10 mM Tris–HCl buffer and the concentration was checked by UV-Vis spectroscopy. The purity of the samples was also checked by the same method since the ratio between the absorbance at 260 nm and at 280 nm must be higher than 1.8 to show that the DNA sample has negligible protein contamination. The procedure to form ssDNA has been described by Yang et al.29 The separation of the strands was confirmed by an increase of approximately 30% in the absorbance at 260 nm compared to dsDNA. The ssDNA samples were prepared immediately before the measurements to avoid renaturation.
In the case of the mixtures investigated, the samples of dendrimers and nucleolipids were prepared with double concentration of the intended final concentration of the mixture. Equal volumes of each of them were poured simultaneously in a beaker to minimize the formation of kinetically trapped aggregates caused by concentration gradients during mixing, which would be greater if one component were diluted with the other.30 All the mixtures were prepared immediately before the measurements in order to ensure that the samples were not depleted of material as it has been observed previously for other dendrimer/surfactant mixtures.31
Electrophoretic mobility measurements
The electrophoretic mobility was recorded using a zetasizer Nano ZS (Malvern Instruments, Worshestershire, UK)32 and analyzed using the M3-PALS technique (Phase Analysis Light Scattering).33 The values shown were determined from the velocity and the direction by which the PAMAM-G4/DLPN complexes formed at different bulk composition moved under an applied electric field. This method allowed an estimation of the charge of the complexes as well as the bulk composition where they are neutral. The data correspond to the average of 3–5 measurements recorded at 23 °C.Quartz crystal microbalance with dissipation monitoring measurements
QCM-D measurements were performed using a setup with four flow cell modules that can be measured simultaneously (E4, Q-Sense, Gothenburg, Sweden). The principles of the QCM-D technique have been described previously elsewhere.34 The cells have a sample volume of 0.25 mL, including the inlet, and the different solutions were flowed at a flow rate of 0.7 mL min−1 for approximately 2–5 min with a peristaltic pump (Ismatec IPC-N 4, Zürich, Switzerland). Each module contains one quartz sensor with a fundamental frequency of 4.95 MHz and a coating of SiO2 (QSX 303, Q-Sense). The sensors were immersed in 2% solution of sodium dodecyl sulfate for a minimum of 30 min before use. The sensors were then cleaned by rinsing them with Milli-Q water (both before and after their use) and ethanol, blow-drying them with nitrogen and plasma cleaning them for 5–10 min (Harrick Scientific Corp, model PDC-3XG, New York, USA). After plasma cleaning, the quartz crystals were placed in the flow modules and buffer solution was flowed through the cells. The fundamental frequencies (f) and corresponding energy dissipation factors (D) of the crystal for the odd overtones 1 to 13 were measured before each experiment and a stable baseline was ensured before the addition of any sample. The temperature was set to 23 °C for all the measurements.QCM-D data evaluation
The interfacial wet mass including the coupled solvent (Δm) is related to the shift of frequency of the quartz crystal (Δf) and it can be easily calculated for a rigid layer that is evenly distributed and small compared to the weight of the crystal (Δf/f ≪ 1) with the Sauerbrey equation:34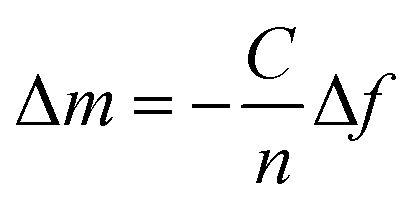 | (1) |
| G = G′ + iG′′ = μf + i2πηff = μf(1 + i2πτff) | (2) |
 | (3) |
 | (4) |
The modeling was carried out using the software QTools (Q-Sense, Gothenburg, Sweden) with the Sauerbrey equation and the Voigt-based representation using experimental data from the 3rd, 5th, 7th and 9th overtone. On higher overtones the side bands interfere with the main resonance and on the fundamental overtone the energy trapping is insufficient.37 The reported values of the interfacial wet mass correspond to the Sauerbrey expression when ΔD was lower than 1 × 10⁻⁶ (in agreement with literature38) but this relation became insufficient for higher dissipation values and when the frequency shift is dependent on the overtone.
Attenuated total reflection Fourier transform infrared spectroscopy measurements
ATR FT-IR spectra were recorded using a Nicolet iS50 FT-IR Spectrometer (Thermo Scientific, United States) equipped with a multireflection ATR accessory (Specac Gateway, Kent, UK). The employed cell allowed the flow of liquid across the largest face of a trapezoidal polished silicon crystal with a SiO2 layer. The beam was focused on one of the short sides of the crystal at a fixed angle that allowed the radiation to be total internally reflected multiple times at the crystal-solution interface. Upon reflection, the IR beam penetrates a short distance in solution (∼1 μm) known as the evanescent wave. Hence, the molecules close to the surface absorb some of the radiation and therefore the beam is not totally reflected at certain wavenumbers. This allows the determination of the vibration/stretching absorption for specific chemical bonds of the molecules close to the silica–water interface. The data were recorded in a wavenumber range between 4000 cm−1 to 1500 cm−1 with a resolution of 4 cm−1. Unfortunately, it was not possible to access data at lower wavenumbers because the signal was dominated by the absorption resulting from bonds in the Si substrate. The solutions were flowed through the cell using a peristaltic pump and spectra were taken continuously until the data showed a steady state. The measurements were performed in D2O and corrected for complete removal of water vapor by subtraction with the scaled water vapor spectra as described by Clifton et al.39 The analysis of the absorption peaks was carried out with the instrument software (Omnic).Neutron reflectometry measurements
NR measurements were performed on the angle-dispersive fixed-wavelength reflectometers MARIA operated by Jülich Centre for Neutron Science (JCNS) and NREX operated by Max Planck Institut at Forschungs-Neutronenquelle Heinz Maier-Leibnitz (Garching, Germany) and on the time-of-flight reflectometers INTER at ISIS (Didcot, U.K.) and FIGARO at the Institut Laue-Langevin (ILL, Grenoble, France).40 MARIA was operated at two wavelengths, 6 Å and 12 Å, NREX at a default wavelength of 4.3 Å and INTER and FIGARO in wavelength bands ranging 1.5–17 Å and 2–30 Å, respectively. The neutron reflectivity profiles correspond to the intensity of the reflected beam in the specular direction normalized by the intensity of the direct beam as a function of the momentum transfer vector, QZ: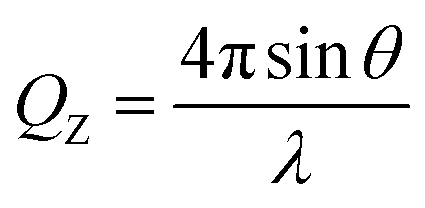 | (5) |
![[thin space (1/6-em)]](https://www.rsc.org/images/entities/char_2009.gif) :4:1 volume ratio for 20 min at 80 °C. Approximately 20 mL of sample was injected through the cell for every change of solution to ensure the efficient exchange of the bulk solution.
:4:1 volume ratio for 20 min at 80 °C. Approximately 20 mL of sample was injected through the cell for every change of solution to ensure the efficient exchange of the bulk solution.
NR data evaluation
The fitting of a layer model to the NR data was carried out using the software Motofit42 using the Abeles matrix method.43 The model is based on stratified layers and the parameters to fit for each layer were the thickness (di), the roughness (δi) and the SLD (ρi) (or the solvent volume fraction (vsolvent)). The number of layers employed to model the experimental data was always kept to a minimum in order to obtain the best fit to the experimental data in multiple isotopic contrasts with the minimum number of fitting parameters. The SiO2 layer was characterized in three solvent isotopic contrasts only for one of the crystals in each neutron experiment and it was modeled as one layer. From experience, it is then sufficient to check for any surface contamination on the other crystals by characterizing them only in D2O as this contrast is the most sensitive to contamination. The parameters obtained from the characterization of the silica layer can be found in the ESI.† PAMAM-G4 was adsorbed and characterized in D2O as one layer on top of the silica layer and compared with data from previous work.27 The adsorption of the DLPNs onto preadsorbed PAMAM-G4 monolayers on silica before dilution of the bulk solution with pure solvent (rinsing) was modeled as four layers: SiO2 − PAMAM + DLPN heads − DLPN heads + DLPN tails − DLPN heads. The PAMAM/DLPA layers, formed by pre-adsorption of the dendrimer and sequential addition of DLPA, after rinsing with solvent were model as 7 layers in agreement with our previous work:44 SiO2 − PAMAM − (DLPA) × 5. The layer formed after attachment of nucleic acids to these PAMAM/DLPA layers was best described by a model consisting of SiO2 − PAMAM + nucleic acid − (nucleic acid − DLPA) × 5 − nucleic acid. The film formed by adsorption from PAMAM/DLPN mixtures was modeled as one mixed layer of dendrimer and nucleolipid on top of the silica layer.In the case of mixed layers, the individual volume fraction of each component was calculated from the SLD of the layer (ρlayer) in different isotopic contrasts:
 | (6) |
The fitting of multiple equivalent isotopic contrasts was carried out using the Global Motofit Algorithm. The errors from fitting the parameters were minimized by a Levenberg–Marquardt optimization.48 The SLD of the different species in any given layer is listed in Table 1.
| Molecular volume (Å3) | ρ (10−6 Å−2) | |
|---|---|---|
| a The molecular volume of the dendrimer was calculated from the density reported by Betley et al.45 and the SLD in D2O corresponds to a proton/deuterium exchange from the surface amine groups.46 b The molecular volume was calculated from the data of Armen et al.47 c The molecular volumes were obtained from Milani et al.22 and the SLD in D2O corresponds to 4 exchangeable hydrogens of adenosine or uridine at pH 7. d The SLDs were calculated using the biomolecular scattering length density calculator provided by ISIS. The SLD in D2O corresponds to 100% exchange of the labile hydrogens at pH 7. | ||
| PAMAM-G4 in H2O/D2Oa | 19290 |
1.2/2.2 |
| Lauroyl chain (C22H46/C22D46)b | 666 | −0.39/6.8 |
| PA head in H2O/D2O (C15H17N5O11P)c | 448 | 3.4/4.3 |
| PU head in H2O/D2O (C14H16N2O13P)c | 414 | 3.2/4.2 |
| 20dT in H2O/D2Od | 6204 | 2.8/3.1 |
| 20dA in H2O/D2Od | 6310 | 3.4/4.1 |
| PolyU in H2O/D2Od | — | 3.3/4.0 |
Results
Formation of dendrimer/nucleolipid films by addition of DLPNs to preadsorbed layers of PAMAM on hydrophilic silica
In recent work, we explored the ability of layers formed by the interactions between DLPA and preadsorbed PAMAM monolayers to exhibit molecular recognition of DNA.44 The more complete understanding of PAMAM/DLPN films formation will be developed in the following subsections as we discuss the effects of the type of headgroup of the nucleolipid (adenosine or uridine based) and the type of buffer on the interactions of the formed layers with DNA and RNA. The molecular structures of the components used in the present study are shown in Fig. 1.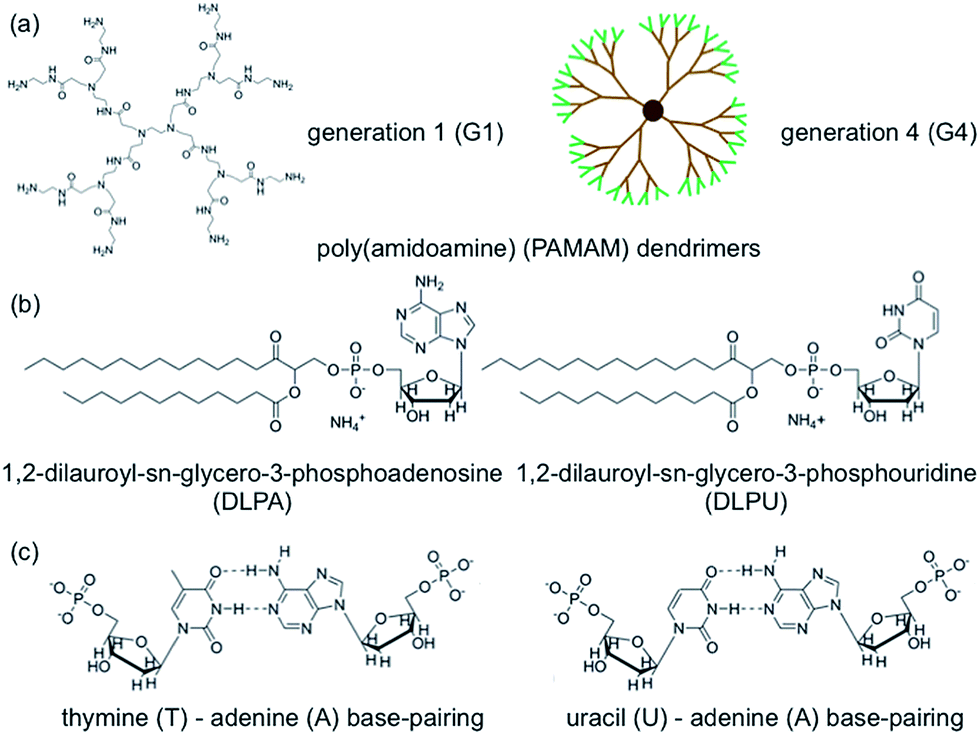 | ||
| Fig. 1 The molecular structures of poly(amidoamine) (PAMAM) dendrimers are shown in (a), where the left panel shows the molecular structure of generation 1 (G1), while the right panel shows a 2D projection of generation 4 (G4) where the surface groups are marked in green. The used nucleolipids (DLPNs), 1,2-dilauroyl-sn-glycero-3-phosphoadenosine (DLPA) and 1,2-dilauroyl-sn-glycero-3-phosphouridine (DLPU) are shown in (b). Possible base-pairing interactions involving the used DLPNs are shown in (c). | ||
QCM-D measurements. The adsorption kinetics of PAMAM-G4 are fast on silica and the dendrimers do not desorb significantly upon rinsing with pure solvent, as shown in previous studies.27 The determined interfacial wet mass of the dendrimer layer is 1.4 ± 0.2 mg m−2 in 10 mM NaCl. Fig. 2 shows QCM-D data for the adsorption of nucleolipids onto dendrimer monolayers preadsorbed on silica. The addition of DLPA or DLPU results in a further decrease in the frequency, which indicates adsorption onto the dendrimer. Since these nucleolipids are negatively charged, they do not adsorb on the bare silica substrate but they do adsorb onto the dendrimer layer. This is due to the electrostatic attraction between the amine surface groups of PAMAM and the phosphate head group of the DLPNs. The adsorption of both types of nucleolipids is also fast and rigid layers are formed as revealed by the very small changes in dissipation. The interfacial wet mass immediately after the dendrimer addition is effectively independent of the concentration of DLPN in the investigated range, 0.060 to 0.52 mM. Moreover, the values are very similar for both types of oligonucleotides (Fig. 2c). On average, the interfacial wet mass resulting from the interaction of DLPA with PAMAM-G4 monolayers was 4.3 ± 0.2 mg m−2 while for DLPU it was 4.6 ± 0.2 mg m−2.
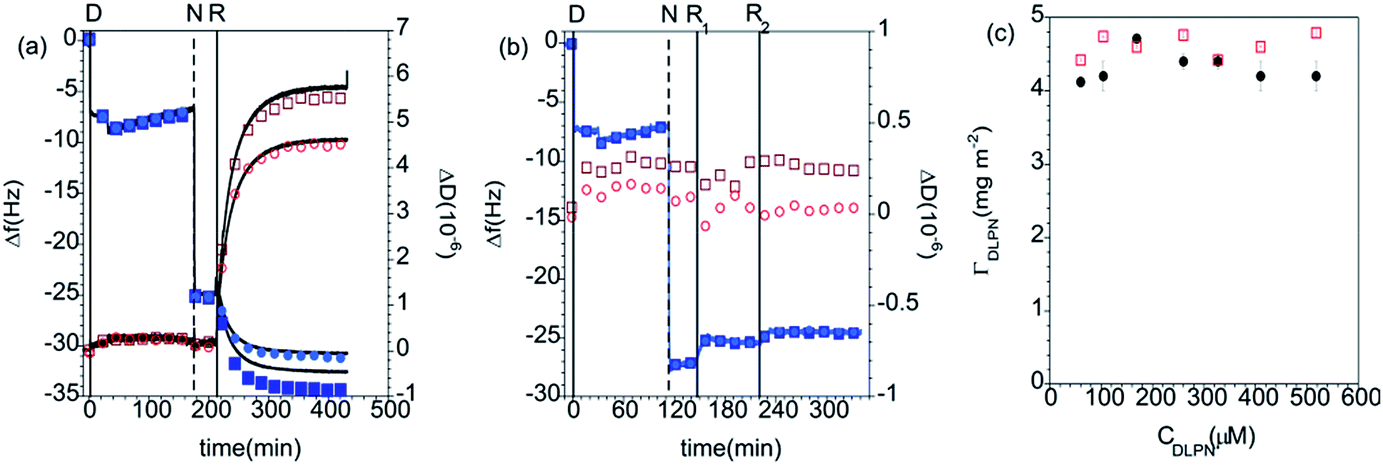 | ||
| Fig. 2 Changes in frequency (Δf, closed blue symbols) and dissipation (ΔD, open red symbols) as a function of time for the addition of (a) DLPA and (b) DLPU to preadsorbed PAMAM-G4 monolayers on silica. The solvent was 10 mM NaCl. The data correspond to the overtones 3 (squares) and 5 (circles) and the corresponding fit to the Voigt model (black curves). The vertical lines correspond to: (i) injection of dendrimer (D), (ii) rinsing with solvent (R), (iii) injection of nucleolipid (N) and (iv) final rinse with solvent (R); the PAMAM/DLPU layers were rinsed twice (R1 and R2) to examine the effect of the rinsing volume. (c) Interfacial wet mass (Δm) obtained from the modeling of the QCM-D data for the addition of DLPA (closed black circles) and DLPU (open red squares) to preadsorbed PAMAM-G4 monolayers on silica as a function of the DLPN concentration before the final rinse with solvent. | ||
Subsequently, the cells were flushed with pure solvent (free of dendrimer or surfactant). This step was done to evaluate if the adsorption of the nucleolipids is reversible, i.e. if they desorb from the surface when the bulk concentration is diluted. PAMAM/DLPA layers showed a decrease in frequency, an increase in dissipation and splitting of the frequency and dissipation signal from the different overtones after rinsing with solvent. According to the Voigt model, the average interfacial wet mass of the PAMAM/DLPA layers after rinsing with solvent was 25 ± 12 mg m−2. On the assumption that a large amount of additional DLPA did not adsorb upon dilution of the solvent, these data indicate the coupling of a significant amount of solvent upon rinsing as well as an increase in viscosity of the interfacial structure. Such changes in conformation could be attributed to (i) swelling of the layer and/or (ii) adsorption of large particles with a high degree of acoustic coupling.49 Since the structural information that QCM-D can provide is limited, neither of these cases can be excluded and therefore measurements with complementary techniques, such as NR, are needed. On the other hand, the interfacial wet mass of the PAMAM/DLPU layers decreased by just ∼4%, so the DLPU adsorption on the preadsorbed PAMAM monolayer was shown to be effectively irreversible.
Analogous to the experiment in 10 mM NaCl, the measurements were also performed in 10 mM Tris–HCl pH 7.6 buffer. The data can be found in the ESI.† The QCM-D data show that although the adsorbed amount of PAMAM-G4 is ∼15% (1.2 ± 0.1 mg m−2) lower in the Tris-based buffer, the addition of both types of DLPNs results in a similar adsorption before rinsing with pure solvent (4.6 ± 0.1 mg m−2). Additionally, and in agreement with the data recorded in 10 mM NaCl, the interfacial wet mass in the PAMAM/DLPA film shows an increase in dissipation and splitting of the overtones when it was rinsed with pure solvent. This indicates formation of viscous layers after rinsing with Tris–HCl buffer, while the corresponding data for the adsorption of DLPU onto PAMAM-G4 monolayers show that the mass decreases by just ∼4% (4.4 ± 0.1 mg m−2). It should be noted that, in comparison with the data recorded in 10 mM NaCl, the frequency overtone-dependent changes and the dissipation increase for PAMAM/DLPA are lower, which shows that the solvent conditions have an effect on the swelling of the formed layers. The average interfacial wet mass of the PAMAM/DLPA layers after rinsing with Tris–HCl buffer is 13 ± 5 mg m−2. Since both buffers have the same salt concentration (10 mM) and fairly similar pH (7.6 in Tris-buffer and 7.2–7.4 in NaCl), such differences in the interfacial behavior indicate that the buffer composition, i.e. type of the simple ions in the added salt, results in changes in the structure of the layers. Interestingly, Stellwagen and co-workers found that DNA hairpins bound more Tris+ than Na+ ions,50 and also that the binding of Tris+ ions onto oligonucleotides with sequences of adenosine were stronger than Na+.51 It follows that these observations are consistent with the reduced swelling of the PAMAM/DLPA layers in Tris-buffer mediated by the screening of DLPA charges bound to Tris+ ions.
NR measurements. NR was employed to determine the structure and composition of the films formed by the addition of the 0.1 mM DLPNs to PAMAM-G4 monolayers before and after rinsing with pure solvent. Fig. 3 shows the NR profiles with the models that fit the experimental data best and the corresponding SLD profiles as a function of the distance to the silicon–water interface for hDLPNs in 10 mM NaCl. The volume fraction profiles of each component calculated from the modelling of the reflectivity are also shown in Fig. 3 and the parameters from the fittings are listed in Table 2 and 3. The data in other isotopic contrasts and solvent conditions can be found in the ESI.†
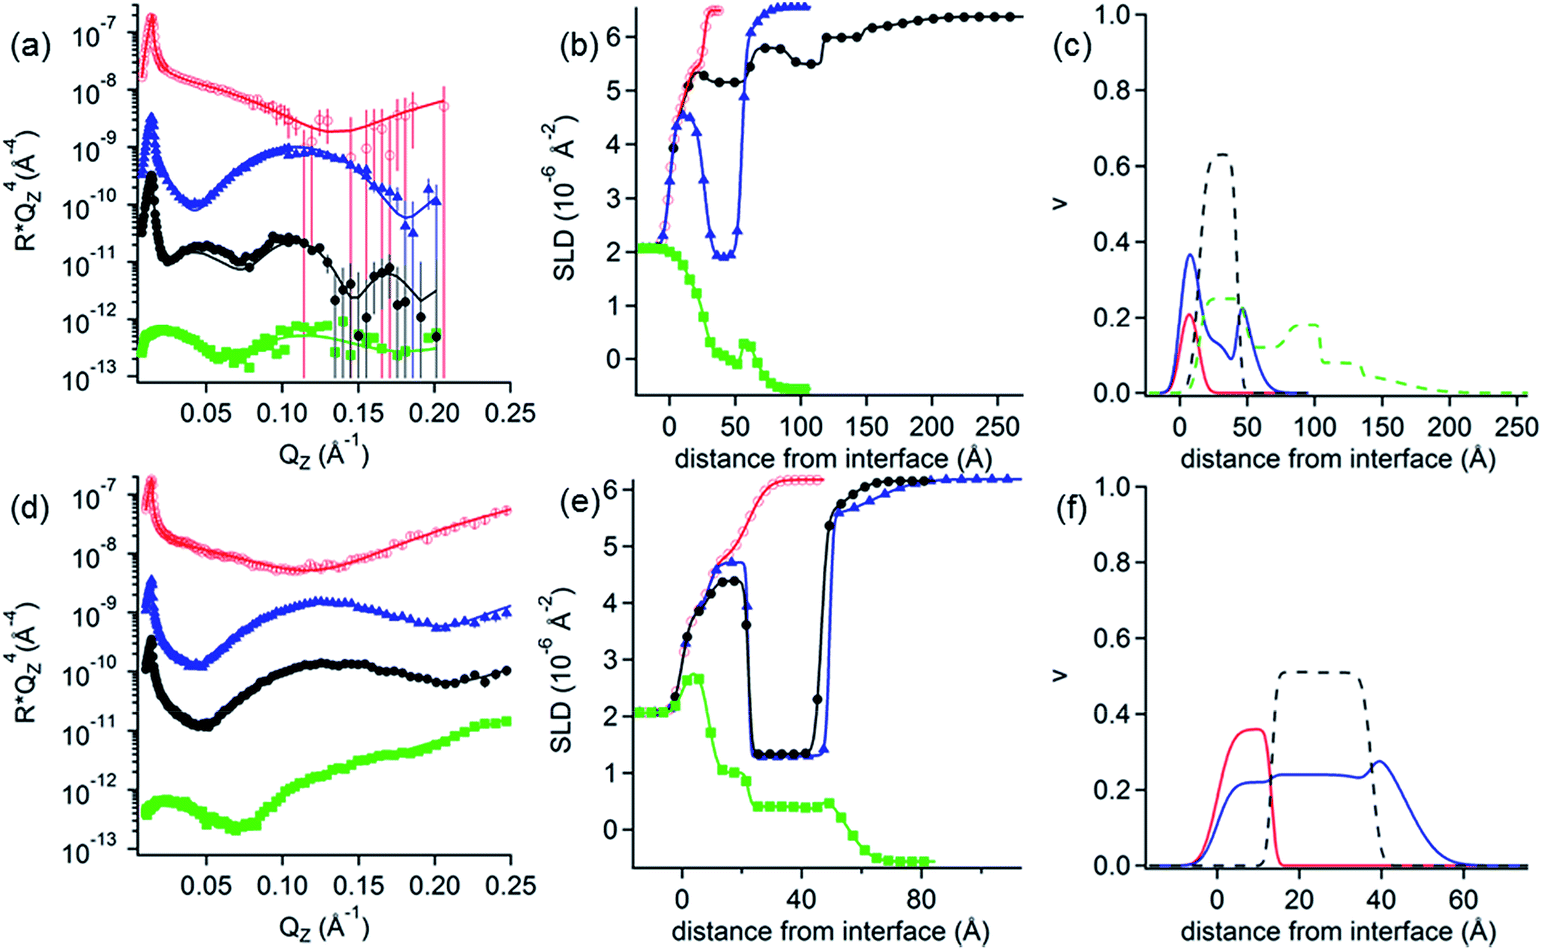 | ||
| Fig. 3 (a and d) Neutron reflectivity profiles and (b and e) SLD profiles as a function of the distance from the Si interface for the adsorption of (a and b) DLPA and (d and e) DLPU to PAMAM-G4 monolayers on silica. The PAMAM-G4 monolayer (red open circles) in D2O is also plotted for reference. The isotopic contrasts were hDLPN/D2O (blue triangles) and hDLPN/H2O (green squares) and subsequent rinse with D2O (black circles). The lines correspond to the calculated reflectivity profiles from the fitted models. The data in (a and d) are offset in the y-axis for clarity. (c and f) Volume fraction (v) profiles as a function of the distance from the Si interface of PAMAM-G4 (red –), DLPN heads (blue - -) and DLPN tails (black - -) for the adsorption of (c) DLPA and (f) DLPU before rinsing with solvent. In (c) the volume fraction profile of DLPA after rinsing with solvent (green - -) is also shown. The volume profiles were calculated from the corresponding data in (a and d). The concentration of DLPNs was 0.1 mM. The solvent was 10 mM NaCl. The data in (a) are reproduced from previous work.44 The data in (a) were recorded using NREX and (d) using INTER. | ||
| DLPN Type | Layer | d i (Å) | δ (Å) | v PAMAM-G4 | v DLPN heads | v DLPN tails |
|---|---|---|---|---|---|---|
| a Layer 1 is the SiO2 layer. di represents the thickness of the layer i, δ is the roughness between the layer i and the layer i + 1 (or the bulk) and v the volume fraction of the different components. | ||||||
| DLPA | 2 | 13.9 ± 0.5 | 4.7 ± 0.4 | 0.24 ± 0.01 | 0.41 ± 0.04 | 0 |
| 3 | 28.6 ± 0.3 | 2.7 ± 0.7 | 0 | 0.14 ± 0.01 | 0.63 ± 0.01 | |
| 4 | 6.2 ± 0.4 | 10.4 ± 0.6 | 0 | 0.42 ± 0.02 | 0 | |
| DLPU | 2 | 13.2 ± 0.3 | 1 ± 1 | 0.36 ± 0.01 | 0.22 ± 0.04 | 0 |
| 3 | 24.4 ± 0.1 | 1.7 ± 0.5 | 0 | 0.24 ± 0.01 | 0.51 ± 0.01 | |
| 4 | 8.3 ± 0.2 | 6.2 ± 0.5 | 0 | 0.34 ± 0.02 | 0 | |
PAMAM-G4 adsorbs as a very compact monolayer (14 ± 3 Å) that covers approximately 30% of the surface area (by volume), in agreement with previous work.27 The addition of each type of DLPN results in clear changes in the reflectivity profiles, especially in D2O where the occurrence of a fringe around a momentum transfer of 0.05 Å−1 indicates the formation of thicker layers compared to the dendrimer alone. In both cases, the best fitting model for the data obtained before rinsing with solvent comprised a mixed dendrimer layer and DLPN head groups close to the SiO2 substrate, followed by a layer of DLPN heads and DLPN tails, and finally by a layer of solvated DLPN heads. The adsorption of DLPNs does not change the structure or surface excess of the preadsorbed PAMAM-G4 monolayer, in contrast to previous work that showed that the addition of the single chain anionic surfactant sodium dodecyl sulfate (SDS) produced swelling of the dendrimer layers at low bulk surfactant concentrations.27 The total thickness of the layer of DLPN tails (24–29 Å) is larger than the maximum length of an extended hydrocarbon chain of 12 carbons (≈17 Å)52 and, together with the model employed (DLPN heads − tails + heads − tails), the data suggest that the DLPNs do not adsorb as monomers but most likely as aggregates and therefore the process is cooperative. Specular neutron reflectivity measurements do not allow us to identify the structure of the aggregates formed, since the structural information is limited to the direction normal to the interface. However, the values obtained for the parameters in the model are consistent with a layer of long threadlike aggregates like those formed in the bulk solution since the total thickness of the DLPN layers (35–40 Å) almost matches the cross-section diameter of these aggregates (∼42–60 Å).18,53 It is interesting to note that although the layer models for the two types of DLPN layers are rather similar, the distribution of the head groups is slightly higher towards the edge of the aggregates for PAMAM/DLPA, while it seems to be more evenly distributed for PAMAM/DLPU. This could indicate that the structure of the DLPU layer is more similar to a cylindrical micelle or a twisted rod. In both cases, the surface coverage of the DLPN layer is ∼70% by volume (including the head groups and the tails), which demonstrates that the ratio of the amine groups of the dendrimer to the phosphate groups of the DLPNs is 0.5 ± 0.1 and thus the net charge of the interfacial layer is negative.
The data from the following rinses with pure solvent indicate structural changes only for the PAMAM/DLPA layers in agreement with the QCM-D data. For the PAMAM/DLPA interaction (Fig. 3a), the reflectivity profiles were modeled as a dendrimer monolayer on the silica surface with bound layers of DLPA aggregates: the first with a thickness of ∼35 Å and a volume fraction of ∼25%, and 4 more layers with a thickness of ∼30 Å and a volume fraction of ∼10%. These layers were stable after multiple rinses with pure solvent. As the DLPNs vary only in the type of nitrogenous base in the head group, the difference in the structure of the PAMAM/DLPN layers after rinsing with pure solvent may be attributed to the base–base stacking interactions. Previous studies showed that although hydrophobic interactions and hydrogen bonding were observed between the nucleosides of both types of nucleolipids, the base stacking interactions between purine–purine bases (e.g. adenine–adenine) were stronger than between pyrimidine–pyrimidine (e.g. uracil–uracil).18 Additionally, cryogenic transmission electron microscopy measurements performed in the bulk solution also showed that such favorable interactions between the head groups in DLPA aggregates could promote the formation of twisted helical structures with a saddle-like curvature.18 This means that the density of matter varies orthogonally with the axis of the helix. On the contrary, such structures were not found in the bulk solution of DLPU. This difference might explain the differences in the interfacial structure upon rinsing between PAMAM/DLPA and PAMAM/DLPU layers. If one takes a closer look at the volume fraction profile of DLPA after rinsing it also shows that some of the layers in the film are slightly denser than others. This is perhaps an indication that those layers contain the elongated helical superstructures found in the bulk solution,18 which might allow denser packing at the interface.
QCM-D Measurements. The ability of short oligonucleotides (20dA and 20dT), polynucleotides (PolyU) and ssDNA to bind to the films formed by the adsorption of DLPNs onto preadsorbed PAMAM monolayers was initially assessed through QCM-D measurements. Although nucleic acids are negatively charged and the NR measurements showed that the dendrimer/nucleolipid films are also negative, nucleosides are partly hydrophobic and thus allow for base-pair stacking in addition to the capability of adenine to form hydrogen bonds with thymine in DNA and with uracil in RNA.
Fig. 4 shows QCM-D data corresponding to the addition of different nucleic acids to the PAMAM/DLPU layers, and Table 4 lists the calculated values of the interfacial wet mass. Since 20dA and DLPU have complementary bases, one may expect selective binding of 20dA. However, the experiments showed that the interfacial wet mass did not change significantly upon addition of any of the nucleic acids.
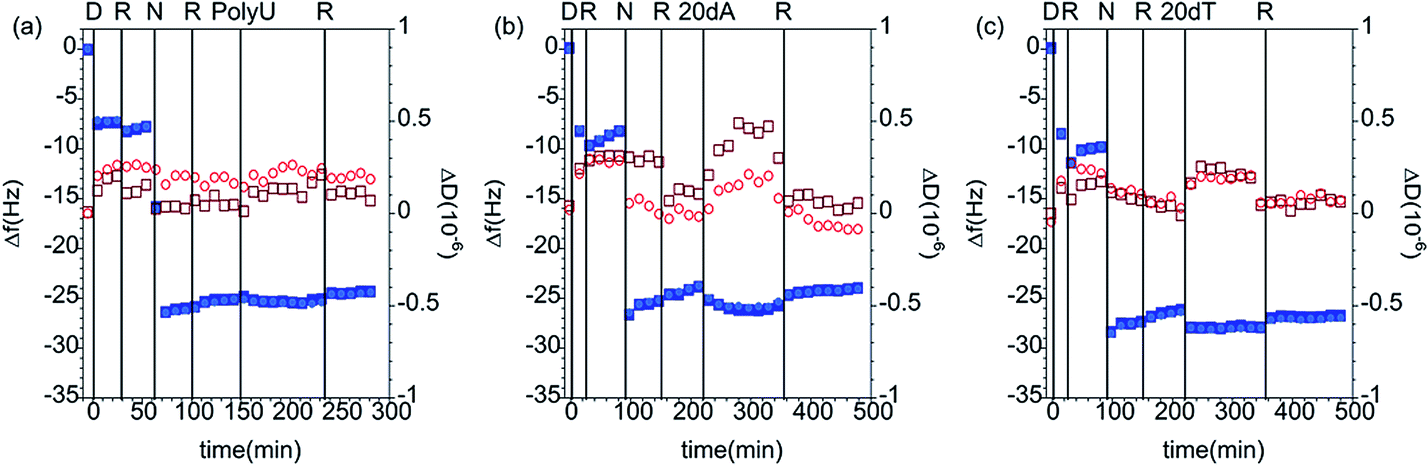 | ||
| Fig. 4 Changes in frequency (Δf, closed blue symbols) and dissipation (ΔD, open red symbols) as a function of time for the addition of (a) 50 ppm PolyU, (b) 200 ppm 20dA and (c) 200 ppm 20dT to DLPU adsorbed on PAMAM-G4 monolayers. The data correspond to the overtones 3 (squares) and 5 (circles). The vertical lines correspond to: (i) injection of dendrimer (D), (ii) rinsing with solvent (R), (iii) injection of nucleolipid (N), (iv) rinse again with solvent (R), (v) addition of the nucleic acid and (vi) final rinse with pure buffer (R). The solvent was 10 mM NaCl. | ||
| Process | Δm (mg m−2) ± 0.1 mg m−2 | ||
|---|---|---|---|
| PolyU | 20dA | 20dT | |
| a The interfacial wet mass values were calculated using the Sauerbrey equation. | |||
| PAMAM-G4 100 ppm | 1.3 | 1.4 | 1.5 |
| NaCl 10 mM | 1.4 | 1.4 | 1.7 |
| DLPA 0.1 mM | 4.6 | 4.4 | 4.8 |
| NaCl 10 mM | 4.4 | 4.2 | 4.6 |
| Nucleic acid | 4.5 | 4.6 | 4.9 |
| NaCl 10 mM | 4.3 | 4.2 | 4.7 |
On the other hand, the addition of short and long polynucleotides to the PAMAM/DLPA layers results in further increase in the dissipation parameter and decrease in frequency in the QCM-D data corresponding to the PAMAM/DLPA layers (Fig. 5 and Table 5). These results indicate possible association between the oligonucleotides and the formed films because the interfacial wet mass increases in all cases. Since the films have a net negative charge, electrostatic attraction is unlikely even though some dendrimer could be exposed to the solution. Nevertheless, hydrophobic, hydrogen bonding and base pair stacking interactions are all possible. It should be pointed out that as the layers are formed by stacks of DLPA aggregates with a large amount of coupled solvent (c.f.Fig. 3) such changes are not necessarily an indication of adsorption. Variations in the solvent ionic strength caused by the addition of a charged molecule could induce rearrangement of the layers. Previous studies from Sethaphong et al. showed that cations, e.g. the ammonium counterion of the oligonucleotides, tend to localize in the purine-rich domains of HIV-1 TAR RNA core helix,54 which may indicate why there is a preferential swelling for PAMAM/DLPA layers compared to PAMAM/DLPU. It is clear that these QCM-D data need to be complemented with results from other techniques such as ATR FT-IR spectroscopy and NR to distinguish between molecular recognition, non-specific adsorption and restructuring of the layers.
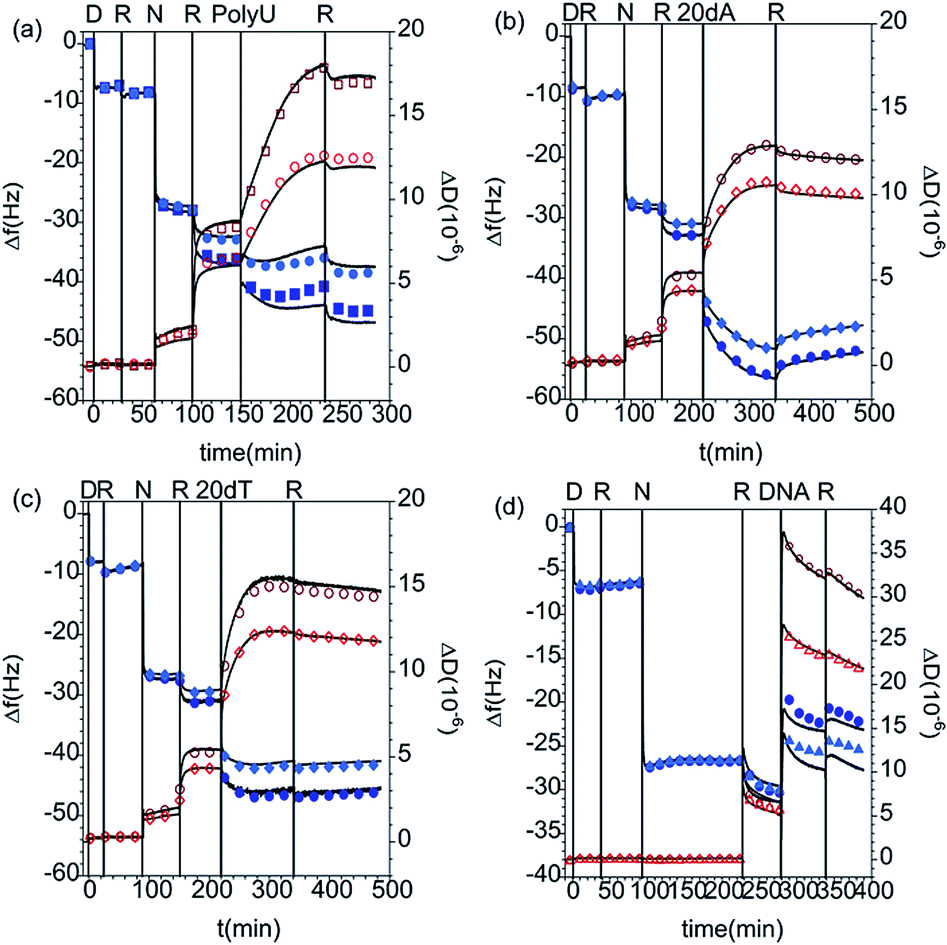 | ||
| Fig. 5 Changes in frequency (Δf, closed blue symbols) and dissipation (ΔD, open red symbols) as a function of time for the addition of (a) 50 ppm PolyU, (b) 200 ppm 20dA, (c) 200 ppm 20dT and (d) 100 ppm ssDNA to DLPA adsorbed on PAMAM-G4 monolayers. The data correspond to the overtones 3 (squares), 5 (circles) and 7 (triangles) and the Voigt model (black curves). The vertical lines correspond to: (i) injection of dendrimer (D), (ii) rinsing with solvent (R), (iii) injection of nucleolipid (N), (iv) rinse again with solvent (R), (v) addition of the nucleic acid and (vi) final rinse with pure buffer (R). The measurements were performed in 10 mM NaCl except for the case of ssDNA, which was done in Tris–HCl buffer. | ||
| Process | Δm (mg m−2) | |||
|---|---|---|---|---|
| PolyU | 20dA | 20dT | ssDNA | |
| a The interfacial wet mass values were calculated using the Sauerbrey equation when ΔD < 1 × 10⁻⁶; otherwise the data from the Voigt representation are reported. The measurements were performed in 10 mM NaCl except for the case of ssDNA, which was done in Tris–HCl buffer. | ||||
| PAMAM-G4 100 ppm | 1.3 ± 0.1 | 1.5 ± 0.1 | 1.4 ± 0.1 | 1.2 ± 0.1 |
| NaCl 10 mM | 1.5 ± 0.1 | 1.7 ± 0.1 | 1.5 ± 0.1 | 1.1 ± 0.1 |
| DLPA 0.1 mM | 4.5 ± 0.1 | 4.9 ± 0.1 | 4.7 ± 0.1 | 4.7 ± 0.1 |
| NaCl 10 mM | 13.9 ± 0.1 | 13.4 ± 0.2 | 13.4 ± 0.5 | 17.8 ± 0.1 |
| Nucleic acids | 17.9 ± 0.1 | 25.1 ± 0.2 | 32 ± 1 | 76.1 ± 0.6 |
| NaCl 10 mM | 18.5 ± 0.1 | 24.0 ± 0.1 | 30.1 ± 0.7 | 68.8 ± 0.6 |
To summarize these QCM-D results, the addition of short and long nucleic acid strands results in different interfacial layer structure if the nucleolipid in the film has adenosine or uridine as part of the head group. Only the purine based nucleolipid shows changes upon interaction with the different nucleic acids, but the technique does not allow identification of the type of association due to the high hydration of the layers. The specific base-pair interactions upon the addition of the nucleic acids to DLPA adsorbed on PAMAM monolayers will be further evaluated in the following sections.
ATR FT-IR spectroscopy measurements. ATR FT-IR spectroscopy measurements are particularly useful in the case of nucleic acids to prove specific base pairing. Experiments were performed for the addition of selected nucleic acids to DLPA adsorbed on PAMAM-G4 monolayers since the QCM-D data did not allow us to separate between molecular recognition, non-specific adsorption and restructuring of the layers. Fig. 6 shows the spectra for the interactions of PolyU, 20dA and 20dT with the dendrimer/nucleolipid film and Table 6 lists the assignment of the absorption bands.
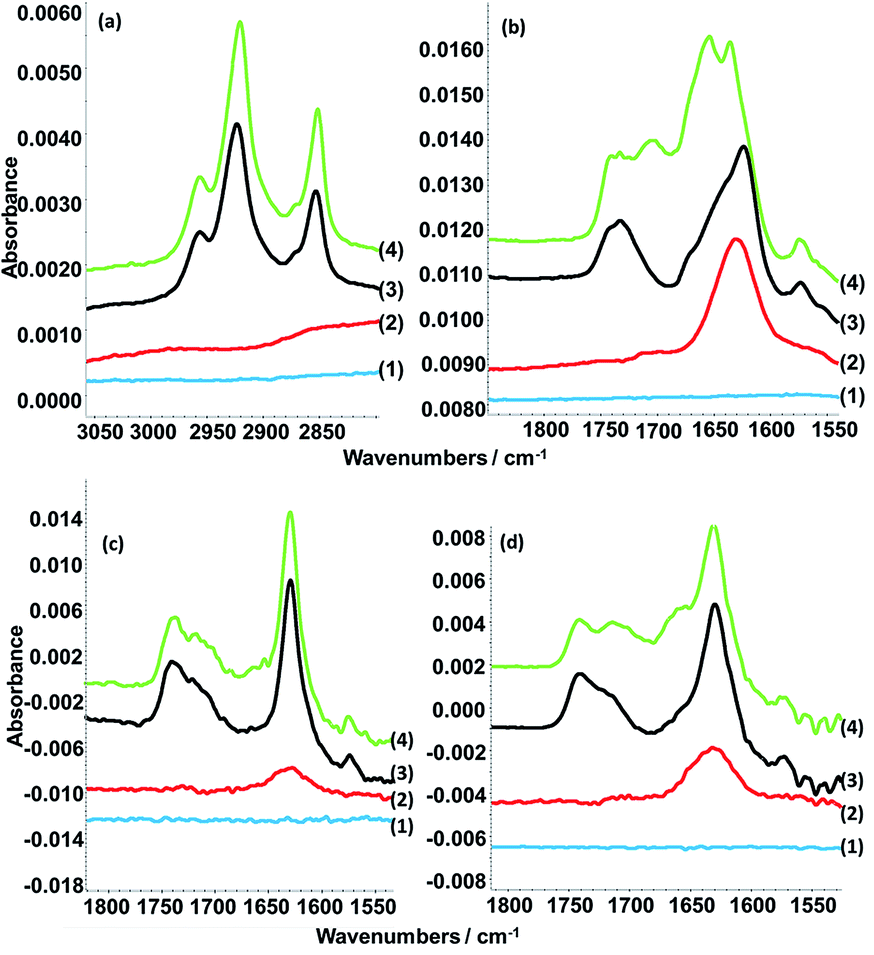 | ||
Fig. 6 ATR-FTIR spectra showing (a) C–H stretching region and (b) C![[double bond, length as m-dash]](https://www.rsc.org/images/entities/char_e001.gif) O stretching and nucleic base vibration regions of the spectra arising from the clean silicon crystal surface (1) with sequential additions of 100 ppm PAMAM-G4 (2), 0.1 mM DLPA (3) and 50 ppm PolyU (4a and b) or 200 ppm dA (4c) or 200 ppm dT (4d). The measurements were done in D2O with 10 mM NaCl. Note that the y-axes of the spectra have been offset for clarity. The data in (c and d) are reproduced from previous work.44 O stretching and nucleic base vibration regions of the spectra arising from the clean silicon crystal surface (1) with sequential additions of 100 ppm PAMAM-G4 (2), 0.1 mM DLPA (3) and 50 ppm PolyU (4a and b) or 200 ppm dA (4c) or 200 ppm dT (4d). The measurements were done in D2O with 10 mM NaCl. Note that the y-axes of the spectra have been offset for clarity. The data in (c and d) are reproduced from previous work.44 | ||
| Figure | Spectrum | Wavenumber (cm−1) | Assignment |
|---|---|---|---|
| 6a | 3, 4 | 2956 | CH3 asymmetric stretch from the DLPA tail |
| 6a | 3, 4 | 2920 | CH2 asymmetric stretch from the DLPA tail |
| 6a | 3, 4 | 2871 | CH3 symmetric stretch from the DLPA tail |
| 6a | 3, 4 | 2850 | CH2 symmetric stretch from the DLPA tail |
| 6b | 2 | 1630 | CO stretch from amides of PAMAM-G4 |
| 6b–d | 3, 4 | 1732 | CO stretch from the DLPA |
| 6b–d | 3, 4 | 1623 | CN and CC ring vibration of the adenine ring from the DLPA head |
| 6b–d | 3, 4 | 1573 | In-plane ring vibration of the adenine ring from the DLPA head |
| 6b | 4 | 1704 | C2O2 stretch from PolyU |
| 6b | 4 | 1653 | C4O4 stretch from PolyU |
| 6d | 4 | 1712 | H-bonded to the C2O stretch of thymines of the third strand for T*A–T base triplets |
| 6d | 4 | 1671–1655 | CO stretch of single stranded thymidine from 20dT |
We showed in our previous work that the PAMAM-G4 monolayer is identified by the CO stretching of the amides around 1645 cm−1 and that the DLPA adsorption is noted by the C–H stretching peaks from the hydrophobic tail between 3000 and 2850 cm−1 and the stretching of the bond from the nucleobase between 1800 to 1550 cm−1.44 The addition of PolyU shows the occurrence of two more absorption bands at 1704 and 1653 cm−1. Both bands are characteristic of CO stretching from uridine.55 As a result it can be inferred that PolyU has associated to the PAMAM/DLPA surface structure.
It was also found that the spectra resulting from the addition of 20dT indicated that the oligonucleotide interacted with the nucleolipid head group, which can be attributed to Hoogsteen base pairing, while the addition of 20dA did not produce any changes in the spectra.44 Therefore, ATR FT-IR spectroscopy measurements indicate that the layers formed by the adsorption of DLPA to PAMAM-G4 can selectively interact with nucleic acids by means of base-pairing as a consequence of hydrophobic interactions between bases in combination with formation of hydrogen bonds.
At a first glance, this result may seem to be in contradiction to the results from the QCM-D measurements above, which suggested possible non-specific interactions of 20dA with the PAMAM/DLPA films. However, the changes in frequency and dissipation were slightly lower after the addition of 20dA compared to 20dT for the same oligonucleotide concentrations and solution conditions. Two possible explanations for these observations are (i) the amount bound of 20dA is below the ATR FT-IR spectroscopy sensitivity or (ii) the interactions between 20dA and PAMAM/DLPA layers are of a different type and this results in interfacial layers with a different structure. It should be noted that previous work reported by Milani et al. on the addition of oligonucleotides to POPA vesicles showed much more significant structural changes in the presence of dT compared to dA.20 However the addition of short and long adenosine based nucleic acid strands seemed to affect as well the structure of the POPA vesicles. Based on their data, they discussed the possibility of further aggregation of the sample mediated by the long polynucleotide, which might result in a different aggregate morphology compared to the vesicles in the absence of the nucleic acid.20 Thus, although 20dA cannot base-pair with the DLPA resulting in the smaller changes in QCM-D data compared to 20dT, we may infer that the addition of 20dA can induce a conformational change of the nucleolipid layer caused by purine–purine base stacking interactions.56
NR measurements. The structure and composition of the layers formed by the interaction of PolyU with PAMAM/DLPA films were obtained using NR (Fig. 7 and Table 7). Note that we have reported the structure and composition of the addition of oligonucleotides (20dA and 20dT, Fig. 8) and ssDNA to the same type of films in our recent Communication.44 Several structural models were tested following the addition of PolyU, 20dT and ssDNA but the only one that fitted all the reflectivity profiles in multiple isotopic contrasts consistently was the adsorption of the nucleic acid onto the PAMAM-G4 monolayer and in between the DLPA stacks of aggregates. This result strongly indicates that nucleic acids, which base-pair selectively, interact with the nucleolipid and with the dendrimer. Additionally, the layers did not change after multiple rinses with pure solvent which shows that the binding of these nucleic acids in the interfacial structure is irreversible. In contrast, the reflectivity profile after addition of 20dA remains almost identical to that of the DLPA aggregate layers after rinsing, which verifies that there is insignificant adsorption of 20dA.44 The SLD profiles before and after the addition of 20dA are similar although the structure is more extended from the interface towards the bulk solution in the latter case (Fig. 8).
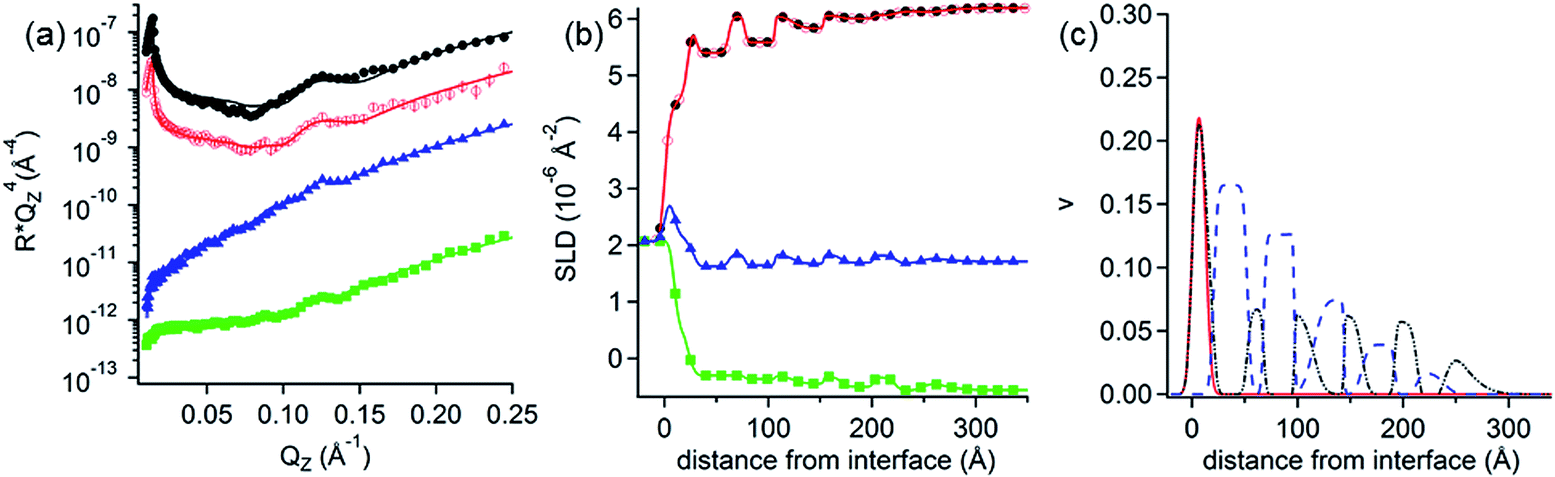 | ||
| Fig. 7 (a) Neutron reflectivity profiles and (b) SLD profiles as a function of the distance from the Si interface for the addition of 50 ppm PolyU onto DLPA adsorbed on PAMAM-G4 monolayers on silica. The isotopic contrasts were hDLPN after rinsing with D2O (red circles), cmSi (blue triangles) and H2O (green squares) and the data before rinsing in D2O (black circles). The lines correspond to the calculated reflectivity profiles from the fitted model. (c) The data in (a) are offset in the y-axis for clarity. Volume fraction (v) profiles as a function of the distance from the Si interface of PAMAM-G4 (continuous red), DLPA (dashed blue) and PolyU (continuous black). The volume profiles were calculated from the data in (a). The concentration of DLPA was 0.1 mM. The solvent was 10 mM NaCl. The data were recorded using INTER. | ||
 | ||
| Fig. 8 (a) Neutron reflectivity profiles and (b) SLD profiles as a function of the distance from the Si interface for the addition of 200 ppm dA (green open squares) or 200 ppm dT (red closed circles) onto DLPA adsorbed on PAMAM-G4 monolayers on silica and the PAMAM/DLPA film before the addition of the oligonucleotides (black closed circles). The isotopic contrast was hDLPN in D2O. The lines correspond to the calculated reflectivity profiles from the fitted model. The data in (a) are offset in the y-axis for clarity. The solvent was 10 mM NaCl. The data were recorded using INTER. Data are reproduced from previous work.44 | ||
| Layer | d i (Å) | δ (Å) | v PAMAM-G4 | v polyU | v DLPA (±0.01) |
|---|---|---|---|---|---|
| a The parameters are described in the footnote of Table 2. | |||||
| 2 | 13.2 ± 0.5 | 4 ± 2 | 0.24 ± 0.01 | 0.23 ± 0.02 | 0 |
| 3 | 7.2 ± 0.8 | 3 ± 3 | 0 | 0.08 ± 0.02 | 0 |
| 4 | 32 ± 1 | 3 ± 4 | 0 | 0 | 0.16 |
| 5 | 15.5 ± 0.8 | 2 ± 7 | 0 | 0.07 ± 0.01 | 0 |
| 6 | 29 ± 1 | 1 ± 1 | 0 | 0 | 0.13 |
| 7 | 18 ± 1 | 8 ± 4 | 0 | 0.06 ± 0.01 | 0 |
| 8 | 29 ± 2 | 1 ± 1 | 0 | 0 | 0.07 |
| 9 | 17 ± 2 | 5 ± 7 | 0 | 0.06 ± 0.01 | 0 |
| 10 | 31 ± 2 | 2 ± 1 | 0 | 0 | 0.04 |
| 11 | 21 ± 2 | 4 ± 9 | 0 | 0.06 ± 0.01 | 0 |
| 12 | 26 ± 3 | 8 ± 4 | 0 | 0 | 0.02 |
| 13 | 9 ± 2 | 22 ± 3 | 0 | 0.07 ± 0.01 | 0 |
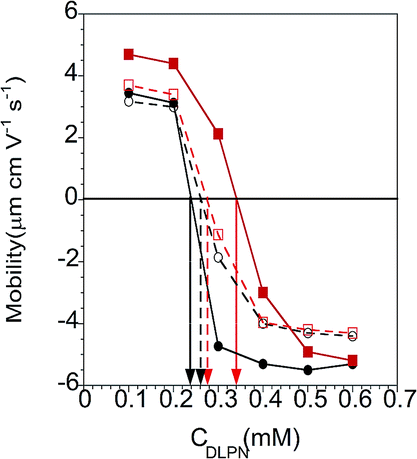 | ||
| Fig. 9 Electrophoretic mobility of mixtures of PAMAM/DLPA (red squares) and PAMAM/DLPU (black circles) for 50 ppm PAMAM-G4 as a function of the bulk DLPN concentration in 10 mM NaCl (closed symbols and continuous line) and 10 mM Tris–HCl pH 7.6 buffer (open symbols and dashed line). The vertical arrows correspond to the concentration of charge neutrality of the bulk complexes. Lines connecting the data are only to guide the eye. | ||
The main difference between the interactions of PolyU, 20dT and ssDNA is the change in adsorbed amount of the nucleic acid to the dendrimer layer (layer 2), which is higher for the larger molecules; the surface coverage by volume is 23% for PolyU and 32% for ssDNA compared with 17% for 20dT.44 However, our results show that this type of extended interfacial structure forms independently of the size of the nucleic acid and whether it is based on RNA or DNA as long as the nucleobases have affinity towards DLPA. The interactions with the dendrimer layer are mainly electrostatic but the binding to the nucleolipid is strongly promoted by base stacking and base pairing interactions and these interactions together compensate for the loss in configurational entropy of the nucleic acid upon adsorption to the film.52
To summarize, NR measurements have demonstrated that nucleic acids bind to nucleolipid/dendrimer surface complexes formed by the addition of DLPA to preadsorbed PAMAM monolayers. These layers show different conformations depending if the nucleic acids could base pair specifically with DLPA, and thus they are a tool for molecular recognition of DNA and RNA.
Formation of dendrimer/nucleolipid films by addition of premixed PAMAM/DLPN samples to hydrophilic silica
The exposure of DLPNs to preadsorbed PAMAM monolayers above was carried out in the absence of dendrimer in the bulk solution to avoid modification of the interfacial properties from the formation of bulk non-equilibrium aggregates. Another approach is to harness potential non-equilibrium effects by changing the experimental protocol employed to mix both components prior to their exposure to the solid substrate. The following subsections deal with how non-equilibrium effects in the bulk influence the ability of PAMAM/DLPN interfacial layers to interact with nucleic acids.Electrophoretic mobility measurements. Electrophoretic mobility measurements were performed in order to estimate the charge of the complexes formed by the interactions of 50 ppm PAMAM-G4 and the two different DLPNs in the two different aqueous solvents. Fig. 9 shows that the mobility data go from positive to negative as the nucleolipid concentration increases. An important parameter obtained from these measurements is the composition relating to complexes with neutral charge. For 50 ppm PAMAM-G4 there is a primary amine concentration on the dendrimers of 0.23 mM, and the complexes are charge neutral for DLPA concentrations of 0.34 mM and 0.28 mM and DLPU concentrations of 0.24 mM and 0.26 mM, each in 10 mM NaCl and 10 mM Tris–HCl, respectively.
It is clear that electrostatic attraction drives the association for both DLPNs studies since the complexes are charge neutral at compositions which correspond approximately to only a small excess of free surfactant with respect to the bulk composition of stoichiometric mixing of opposite charges on the two components. Similar behavior has been found in mixtures consisting of PAMAM and the anionic surfactant SDS.31 A slight excess of DLPNs is needed, especially for the mixtures containing DLPA, to form neutral complexes which is a result of the equilibrium between the bound surfactant and the free surfactant, which itself is affected by the solvent conditions. Additionally, the shift of the PAMAM/DLPA mobility towards higher bulk DLPN concentrations compared to PAMAM/DLPU indicates that the association in the bulk solution with the dendrimers depends also on the type of nucleoside head group. We also note that the presence of the buffer reduces the difference between the nucleolipids with respect to association in the bulk. As discussed above, this difference can be rationalized in terms of the interactions of the buffer ions with the nucleotides but also to the fact that the pH is more stable in presence of the buffer.
QCM-D measurements. The QCM-D data corresponding to the adsorption from PAMAM/DLPN mixtures on silica for both types of nucleolipids and two different bulk compositions in 10 mM NaCl are shown in Fig. 10; the corresponding data recorded in Tris–HCl buffer can be found in the ESI.† From the electrophoretic mobility data it was found that for solutions with 50 ppm PAMAM-G4, the dendrimer/nucleolipid complexes are charge neutral with DLPN concentrations in the range 0.24–0.34 mM. For these bulk compositions the samples are turbid and it is expected that macroscopic phase separation occurs since the aggregates lack charge stabilization. This has been observed for other oppositely charged polyelectrolyte/surfactant mixtures.52 Therefore, we did not study the adsorption of samples where the QCM-D signal might be influenced by sedimentation of aggregates onto the surface. The concentrations of DLPNs chosen were therefore 0.1 mM and 0.5 mM where the samples do not precipitate and have complexes that are charge stabilized with positive and negative charges, respectively.
 | ||
| Fig. 10 Changes of frequency (Δf, blue symbols) and dissipation (ΔD, red symbols) as a function of time for the adsorption of (a) PAMAM/DLPA and (b) PAMAM/DLPU mixtures on silica. The mixtures had a bulk composition of 50 ppm PAMAM-G4 with 0.1 mM DLPN (closed squares and circles) and 0.5 mM DLPN (open diamonds and triangles) in 10 mM NaCl. The data correspond to the overtones 3 (squares and diamonds) and 5 (circles and triangles). The vertical lines correspond to: (i) injection of dendrimer/nucleolipid mixture (Mix) and (ii) rinsing with solvent (R). | ||
Adsorption to hydrophilic silica is fast from the mixtures with positively charged complexes, which can be attributed to the electrostatic attraction under the given solution conditions. Compared to the interactions of DLPNs with preadsorbed PAMAM-G4 monolayers, the interfacial wet mass was much lower: on average 1.8 ± 0.1 mg m−2 for the adsorption of both PAMAM/DLPN mixtures before rinsing with solvent. However, the values are still higher than those corresponding to the adsorption of PAMAM-G4 alone and therefore it is inferred that the adsorbed layer contains DLPNs. After diluting the bulk solution, the interfacial wet mass and viscoelasticity of the films were almost the same as before the rinse (approximately 1.9 ± 0.2 mg m−2). Thus, we may infer that the adsorption is irreversible and the rigidity of the layers is independent of the type of nucleolipid.
No adsorption to hydrophilic silica was observed for PAMAM/DLPN mixtures with negatively charged complexes. In this case, the complexes possess the same charge as the substrate. However, we previously observed that adsorption occurs on silica from mixtures of PAMAM-G4 and SDS that contain negatively charged complexes.27 This was attributed to a competition between the dendrimer-surface and complex-surface electrostatic interactions. The reduced interaction in the case of negatively charged PAMAM/DLPN complexes may be related to the slower dynamics of rearrangement of the dendrimer and the nucleolipid in the complexes and/or a more rigid structure compared to the complexes formed in PAMAM/SDS mixtures. The interfacial behavior is very similar with respect to the solvent conditions used (10 mM NaCl or Tris–HCl buffer). However, it should be noted that the interfacial wet mass of the PAMAM/DLPA layers in Tris–HCl buffer is ∼15% higher than in 10 mM NaCl. This observation may be explained if there is indeed a difference in the binding of Tris+ ions to DLPA compared to Na+, which can result in a slight increase of the adsorbed amount.
NR measurements. Since only PAMAM/DLPN mixtures with positively charged complexes showed adsorption onto hydrophilic silica according to the QCM-D measurements, analogous experiments for this system only were also carried out using NR. Fig. 11 shows the obtained reflectivity profiles with the fits as well as the SLD and the volume fraction profiles. The used fitting parameters are listed in Table 8. NR data for other nucleolipid isotopic contrasts are presented in the ESI.† It may be noted that due to beam time limitations, the PAMAM/DLPA mixtures were measured only in 10 mM Tris–HCl buffer although we showed from the QCM-D data that the interfacial behavior is very similar in both solvent conditions.
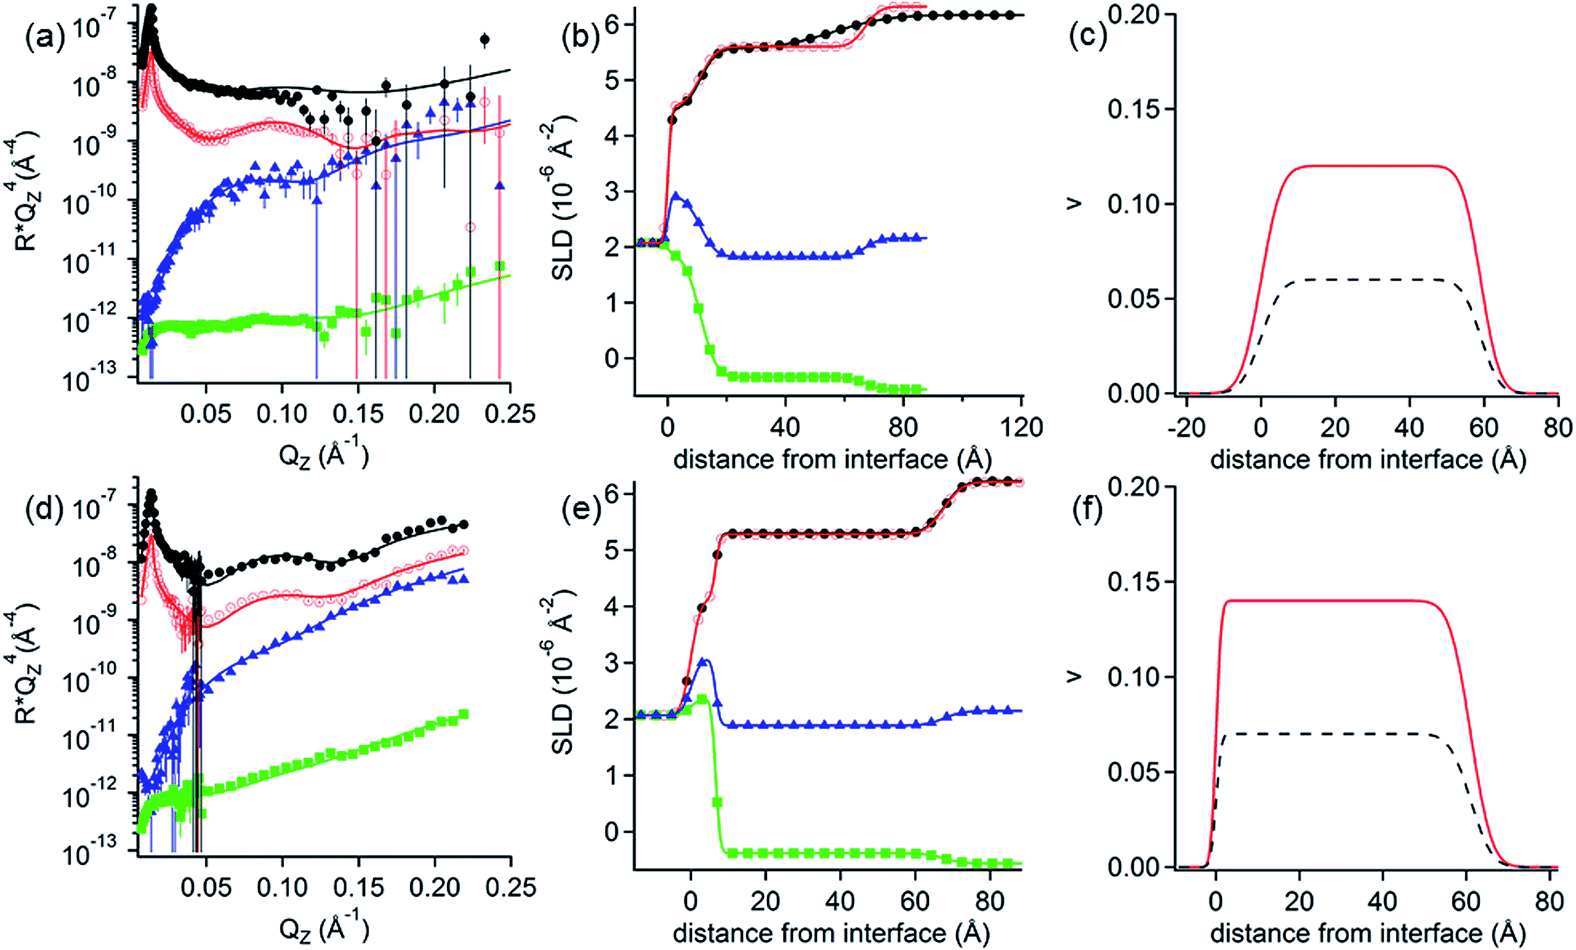 | ||
| Fig. 11 (a and d) Neutron reflectivity profiles and (b and e) SLD profiles as a function of the distance from the Si interface for the adsorption of (a and b) PAMAM/DLPA and (d and e) PAMAM/DLPU mixtures on silica. The concentration of DLPNs was 0.1 mM. The solvent in (a and b) was 10 mM Tris–HCl pH 7.6 buffer and in (d and e) 10 mM NaCl. The isotopic contrasts were hDLPN after rinsing with D2O (red circles), cmSi (blue triangles) and H2O (green squares) and the data before rinsing in D2O (black circles). The lines correspond to the calculated reflectivity profiles from the model. The data in (a and d) are offset in the y-axis for clarity. (c and f) Volume fraction (v) profiles as a function of the distance from the Si interface of PAMAM-G4 (red –) and DLPNs (black - -) for the adsorption of (c) PAMAM/DLPA and (f) PAMAM/DLPU mixtures. The volume profiles were calculated from the corresponding data in (a and d). The data in (a) were recorded using FIGARO and in (d) using MARIA. | ||
| DLPN type | Layer | d i (Å) | δ (Å) | v PAMAM-G4 | v DLPN |
|---|---|---|---|---|---|
| a The parameters are described in the footnote of Table 2. The PAMAM/DLPA mixture was prepared in 10 mM Tris–HCl pH 7.6 buffer while the PAMAM/DLPU mixture was prepared in 10 mM NaCl. | |||||
| DLPA | 2 | 56.0 ± 0.9 | 4 ± 4 | 0.12 ± 0.02 | 0.06 ± 0.02 |
| DLPU | 2 | 61 ± 1 | 3 ± 1 | 0.14 ± 0.06 | 0.07 ± 0.03 |
The adsorption of dendrimer/nucleolipid complexes was modelled as one layer containing a homogenous mixture of both components. The reflectivity profiles show almost no difference after rinsing with solvent, in agreement with the QCM-D experiments. The thickness of the layers is very similar for both mixtures, 56 Å for PAMAM/DLPA and 61 Å for PAMAM/DLPU, but the total surface coverage is very low (∼20% by volume). The composition of the adsorbed components was calculated as 2:1 dendrimer to nucleolipid in each case, which is qualitatively consistent with the expected adsorption of positively charged complexes from the bulk. Thus, the layers formed by the adsorption from dendrimer/nucleolipid mixtures onto silica have an opposite charge compared to the ones formed by the addition of the nucleolipid to the preadsorbed dendrimer monolayer in these solvent conditions. As a consequence, we have demonstrated that the order of addition can be a way to control the charge and structure of the film in these types of systems.
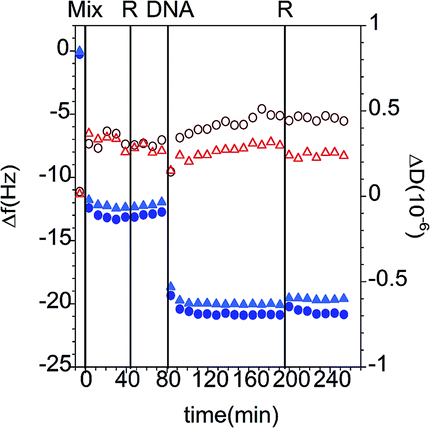 | ||
| Fig. 12 Changes in frequency (Δf, closed blue symbols) and dissipation (ΔD, open red symbols) as a function of time for the addition of 100 ppm ssDNA to PAMAM/DLPA mixtures adsorbed on silica. The data correspond to the overtones 5 (circles) and 7 (triangles) and the Voigt model (black curves). The vertical lines correspond to the sequential injections of dendrimer/nucleolipid mixture (Mix), the rinses with solvent (R) and the addition of DNA. The solvent was 10 mM Tris–HCl. | ||
| Process | Δm (mg m−2) |
|---|---|
| a The interfacial wet mass values were calculated using the Sauerbrey equation. | |
| PAMAM-G4/DLPA mixture | 2.2 ± 0.1 |
| Tris–HCl buffer | 2.1 ± 0.1 |
| ssDNA | 3.5 ± 0.1 |
| Tris–HCl buffer | 3.4 ± 0.2 |
Here we remind the reader that in the case of the binding of DLPNs to preadsorbed PAMAM monolayers the self-assembled DLPA-on-PAMAM surface structure has an overall negative charge while the adsorbed PAMAM/DLPA complexes are positively charged. It can be seen from the data that in the case of the layers formed from PAMAM/DLPA mixtures, the addition of ssDNA gives further adsorption and the layers remain rigid. The attachment of nucleic acids in this case is favored by the net positive charge of the dendrimer/nucleolipid film formed by the mixture. Thus, PAMAM/DLPA films formed from their mixtures associate with DNA but, due to the net positive charge of the layers, it is not possible to explain such results based on selectivity only.
Discussion
The interaction of nucleolipids DLPA and DLPU with PAMAM dendrimers of generation 4 is driven primarily by electrostatic attraction. By examining the interaction on a solid support using different surface-sensitive techniques, we have shown that the adsorption protocol, solution conditions and the type of nucleolipid have a major impact on the structure, composition and indeed the functionality of the formed layers. While DLPNs interact with preadsorbed PAMAM monolayers to form a surface structure which is negatively charged, adsorption on hydrophilic silica from PAMAM/DLPN mixtures is possible only if the complexes are positively charged. The layers formed by the adsorption of the nucleolipid onto the dendrimer monolayer could provide molecular recognition of nucleic acids. In contrast, for the films formed by the adsorption from the mixtures, the interactions with nucleic acids are primarily driven by electrostatic attraction. In the following subsections we discuss various key aspects of the interactions.Interactions of DLPNs with preadsorbed layers of PAMAM
When nucleolipids are exposed to preadsorbed dendrimer monolayers, they bind as aggregates with interfacial structures that are consistent with the threadlike micelles formed in the bulk. A comparison of the adsorption of nucleolipids to PAMAM-G4 monolayers with other anionic amphiphiles such as SDS shows significant differences. It was previously found that at low bulk SDS concentrations (<2.1 mM) in 10 mM NaCl the surfactant adsorbed as monomers and caused dendrimer layer to swell. On the other hand, at higher bulk surfactant concentrations aggregates attached and the thickness of the PAMAM monolayer decreased, which was attributed to a reduction in the osmotic pressure within the dendrimer.27 It was also proposed that besides the electrostatic attraction between the amine groups of the dendrimer and the sulfate head group of the surfactant, the hydrophobic tails of SDS could penetrate the interior of the dendrimer. In contrast, DLPA and DLPU adsorb as aggregates even at very low concentration (0.1 mM) under both solvent conditions studied and they do not produce swelling of the dendrimer layer. The critical micellar concentration of the DLPNs is below 0.01 mM,57 which explains why the adsorption takes place in the form of aggregates even at such low bulk concentrations. Thus, the DLPN adsorption observed in the present work is comparable with the adsorption of SDS at high concentrations where the PAMAM-G4 layers are not swollen. From the NR structural model, the hydrophobic portion of the nucleolipid was not found to be associated with the dendrimer layer. This could be either due to the nucleolipid aggregation at the dendrimer surface or steric constraints of the double chain nucleolipids to penetrate the dendrimer interior. However, Smith et al.58 have shown that the hydrophobic tail of zwitterionic phospholipids (1,2-dimyristoyl-sn-glycero-3-phosphocholine, DMPC) can interact with the interior of the dendrimer and therefore this possibility is not excluded for the dendrimer/nucleolipid complexes formed in the bulk solution.An interesting difference between the layers formed by the addition of nucleolipids to preadsorbed dendrimer monolayers is the change in the interfacial conformation of the DLPA aggregates upon rinsing with solvent. We attribute the difference to the stronger base stacking interactions of purines compared to that of pyrimidines.56 Therefore, the present work demonstrates that these stacking interactions are responsible for both aggregation behavior in the bulk18 and at the interfaces. Other nucleolipids such as dioctanoylphosphatidylnucleosides (DiC8PNs)57 and POPNs22 have also shown that the stacking interactions of the nucleobase control packing and arrangement and consequently the ability of those bases to interact with nucleic acids.
Effects of the type of buffer on the PAMAM/DLPN films
Another variable in the interfacial interactions that was examined was the type of buffer. In general, the interfacial behavior of layers formed by DLPNs adsorbed on PAMAM is similar in both investigated solvents (10 mM NaCl or 10 mM Tris–HCl). However, the PAMAM/DLPA layers are less viscous after rinsing with Tris–HCl buffer which demonstrates that the type of cation in the background electrolyte affects the interfacial structure. The results agree with previous work that showed stronger binding of ions such as Tris+ to the phosphate groups of the backbone in the DNA molecules compared to Na+.50,51 The different buffer effects on the structure of the dendrimer/nucleolipid layers also indicate that the binding of monovalent cations is stronger for the phosphate of the adenosine nucleotides compared to uridine, since no significant changes are observed for the rinses to PAMAM/DLPU films. Such an effect was also observed by Sethaphong et al.54 Nakano et al. showed recently, using molecular dynamic simulations, that Van der Waals interactions and solvent accessible surface areas were more important than the electrostatic attraction for the affinity of the molecular cation to bind to DNA.59 Additionally, they calculated that the free energy gain due to a cation that fits optimally in a DNA groove compensated for the energy loss of dehydration. Also, Stellwagen et al. have suggested that larger cations with sizes that match better the phosphate group will shield better and hence result in the stronger binding.60 Our data support the work from other groups indicating that Tris+ ions bound stronger than Na+ and preferentially to adenosine compared to uridine, which could be the result of a preferential fit due to the orientation of the head group in the layer structure.Interactions of nucleic acids with DLPNs bound non-covalently to preadsorbed layers of PAMAM
An important consequence of the difference in the structure of DLPA and DLPU bound to preadsorbed PAMAM monolayers on hydrophilic silica is the ability of the nucleolipid to interact with nucleic acids. It was found that DLPU shows no sign of attractive interactions, hydrophobic or base-pairing, with any of the added nucleic acids. However, DNA and RNA interact with DLPA layers, depending on the type of nucleobases. Thus, it may be inferred that the adenosine head group is oriented in a more favorable conformation to attach DNA and RNA through a combination of hydrophobic and hydrogen bonding interactions. The nucleic acids bound to the nucleolipid are also able to adsorb onto the dendrimer layer due to their electrostatic attraction.For nucleic acids with nucleotides that can form selective base-pairing with DLPA, such as 20dT, PolyU and ssDNA, the association is strong. However, some changes are observed in QCM-D for the addition of 20dA to DLPA adsorbed to PAMAM monolayers, which we attribute to the well-known strong π-stacking interactions between the purine bases.56 This effect can induce modifications in the conformation of DLPA in the interfacial layer. Nevertheless, it was found that 20dA does not attach to the PAMAM/DLPA layers, which we attribute to the lack of hydrogen bonding interactions between the bases, as confirmed by ATR FT-IR spectroscopy and NR measurements in previous work.44
Dendrimer/nucleolipid interactions in bulk solution
As mentioned previously, mixtures of PAMAM and DLPNs adsorb onto hydrophilic silica only if the mixtures have complexes with positive charge. The experiments performed with dendrimer/nucleolipid mixtures are important since they revealed that non-equilibrium effects in the bulk have great impact on the interfacial behavior of the mixtures. The measurements showed as well that the dynamic of re-arrangement of the dendrimer/nucleolipid complexes is very slow. Fant et al. have shown previously the non-equilibrium states of DNA during condensation of PAMAM dendrimers, which is fundamental for gene transfection.61 The slow non-equilibrium aggregation process of dendrimer/nucleolipid mixtures might be favorable behavior if it could be exploited in the development of formulations that encapsulate efficiently DNA and RNA, which can then be triggered to release the nucleic acids inside cells.Potential for dendrimer/nucleolipid surface complexes as gene delivery vehicles and biosensors
The main purpose of investigating the interactions of dendrimers and nucleolipids was to improve the understanding of potential gene delivery vehicles with selectivity towards specific nucleic acids. Cationic dendrimers have advantages as non-viral vectors compared to viral vectors such as non-immunogenic response.62 However, there are concerns about the toxicity of the dendrimers which is related to their cationic charge.1 Covalent modification of the surface groups of the dendrimer is the current method to reduce the toxicity and increase the gene transfection efficiency.10,63,64 Complementary to this approach, the present work showed that non-covalent interactions between DLPA and dendrimers can also be used to form dendrimer/nucleolipid complexes that exhibit molecular recognition of nucleic acids. In practice, non-covalent functionalization is easier, faster and more cost effective than the other approach. This study may therefore be broadened in the future to the bulk solution properties to investigate the viability of use of the complexes as delivery vehicles. Further work is undergoing to evaluate the structure and composition of PAMAM/DLPN complexes in the bulk solution, which are more closely related to their possible applications as delivery vehicles. The information obtained from the surface studies, however, indicates that complexation of dendrimers with nucleolipids based on adenosine shows promising selective molecular recognition properties for such purposes.Alternatively, the dendrimer/nucleolipid films formed could be employed in bioanalytical sensing devices for detection of nucleic acids. There is great interest in the development of biosensors65 for e.g. diseases diagnosis,66 forensic applications67 and environmental contamination monitoring.68 Dendrimers have also been investigated previously as DNA biosensors by attaching them covalently to the surfaces.69–71 Our approach does not require any type of covalent attachment of any of the molecules and it senses nucleic acids only with matching bases. Apart from the ability to prepare films for selective attachment of DNA or RNA for analysis, we have shown that the structure of the layers is equivalent with respect to the type and length of the nucleic acid. Such mixed layers also reduce the adsorption of other molecules onto the dendrimer driven by the electrostatic attraction, as it has been observed with the current polymer-based alternatives.72 These results show the advantages of using the films formed by dendrimers and nucleolipid as potential gene biosensors with a high degree of chemical affinity to probe–target binding.
Conclusions
Cationic PAMAM dendrimers of generation 4 form films with the anionic nucleolipids DLPNs that can be used to bind selectively nucleic acids depending on the type of nucleolipid nucleoside head group and the protocol used for the formation of the layers. This is schematically illustrated in Fig. 13. Both DLPA and DLPU attach to preadsorbed PAMAM-G4 monolayers on silica and produce layers with similar structures and composition before dilution of the bulk solution with solvent. The layers have a net negative charge and involve DLPN aggregates bound to the dendrimer monolayer. After rinsing with pure solvent, only the PAMAM/DLPA layers undergo a structural change as they become more swollen, most likely by forming surface attached elongated micelles that protrude towards the bulk solution. This conformation results in the selective interaction with nucleic acids through hydrophobic interaction, base stacking and specific base pairing. However, the PAMAM/DLPU interfacial structure is more compact than for PAMAM/DLPA and such films show no indication of binding any of the nucleic acids examined. Thus, we may conclude that the orientation of the nucleolipid in the layer, which is a result of the base stacking interactions between the headgroups of the nucleolipids, determines the ability of the layer to interact selectively with nucleic acids. Additionally, our results suggest specific binding of buffer cations for the PAMAM/DLPA layers.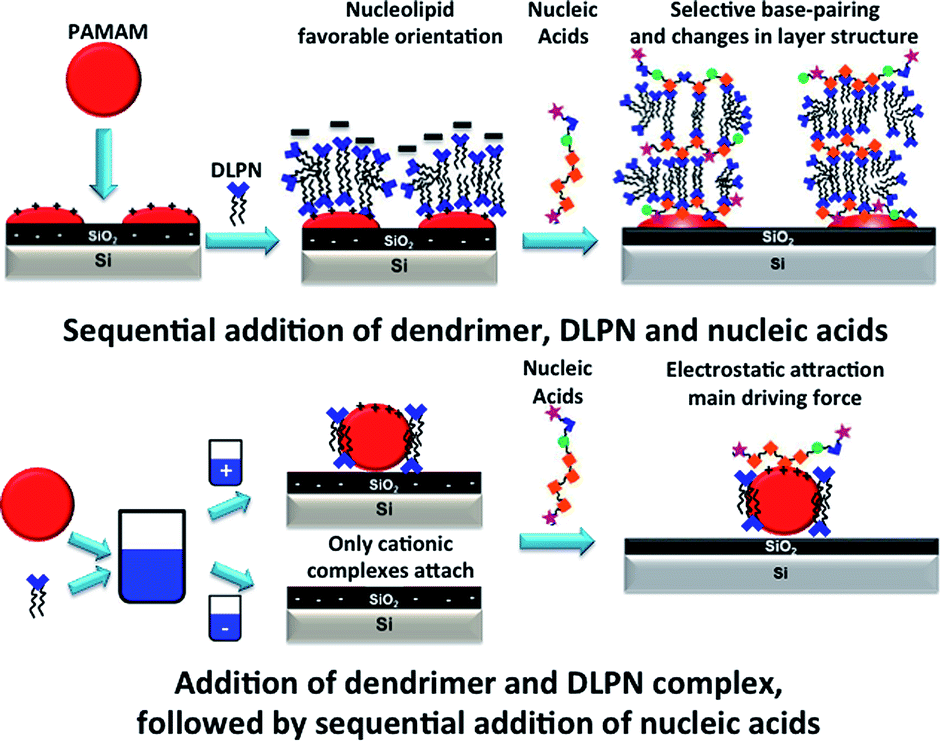 | ||
| Fig. 13 Schematic illustration of the formation of layered structures for the sequential addition of dendrimer, DLPN and nucleic acids compared to the addition of dendrimer and DLPN complex, followed by sequential addition of nucleic acids. | ||
We also showed that PAMAM/DLPN complexes preformed in the bulk adsorb on hydrophilic silica only if they are positively charged. These results indicate that the dynamics of rearrangement is slow for anionic dendrimer/nucleolipid complexes from mixtures with excess of the nucleolipid. Such mixtures efficiently sequester the dendrimers to form rigid structures thus preventing them from adsorbing to anionic surfaces. The PAMAM/DLPN layers formed by the mixtures with positively charged complexes promote the adsorption of DNA with the electrostatic attraction rather than specific base pairing as the main driving force. These results show unambiguously that the outcome of the interactions of PAMAM/DLPN surface complexes with nucleic acids in future applications may be tuned by non-equilibrium effects by optimization of the experimental protocol used.
We have shown in the present work that the complexes formed by dendrimers and nucleolipids have promising characteristics for the development of soluble gene therapy vehicles with a high affinity towards nucleic acids. Equally, the interfacial structures studied may be developed as a new approach to construct biosensors for the detection DNA or RNA. As neither method requires covalent functionalization, they may be considered as relatively easy and cost effective future alternatives.
Acknowledgements
M.Y.A. and T.N. acknowledge the financial support from the Swedish Research Council (VR) through the Linnaeus grant Organizing Molecular Matter (OMM) center of excellence (239-2009-6794) and D.B., C.M. and P.B the support from Italian MIUR (PRIN 2010–2011 grant 2010BJ23 MN) and Ente Cassa di Risparmio di Firenze. The Knut and Alice Wallenberg foundation funded the acquisition of the QCM-D instrument. We thank ISIS for beam time allocation on INTER and for access to the ATR FT-IR spectrometer, the ILL for beam time allocations on FIGARO, JCNS for beam time allocation on MARIA and Max Planck Society at the Heinz Maier-Leibnitz Zentrum (MLZ) for beam time allocation on NREX. We also thank Stefan Mattauch for support during the MARIA NR experiment, James Holdaway and Christopher Hirst for assistance during the NREX NR experiment and Jonas Carlstedt and Dan Lundberg for providing the DNA sample.Notes and references
- J. C. Roberts, M. K. Bhalgat and R. T. Zera, J. Biomed. Mater. Res., 1996, 30, 53–65 CrossRef CAS.
- J. D. Eichman, A. U. Bielinska, J. F. Kukowska-Latallo and J. R. Baker Jr, Pharm. Sci. Technol. Today, 2000, 3, 232–245 CrossRef CAS.
- C. S. Braun, J. A. Vetro, D. A. Tomalia, G. S. Koe, J. G. Koe and C. Russell Middaugh, J. Pharm. Sci., 2005, 94, 423–436 CrossRef CAS PubMed.
- C. Dufès, I. F. Uchegbu and A. G. Schätzlein, Adv. Drug Delivery Rev., 2005, 57, 2177–2202 CrossRef PubMed.
- D. A. Tomalia, H. Baker, J. Dewald, M. Hall, G. Kallos, S. Martin, J. Roeck, J. Ryder and P. Smith, Polym. J., 1985, 17, 117–132 CrossRef CAS.
- D. Cakara, J. Kleimann and M. Borkovec, Macromolecules, 2003, 36, 4201–4207 CrossRef CAS.
- A. Bolhassani, S. Safaiyan and S. Rafati, Mol. Cancer, 2011, 10, 20 CrossRef PubMed.
- J. R. Baker, ASH Education Program Book, 2009, vol. 2009, pp. 708–719 Search PubMed.
- M. J. Kwon, S. An, S. Choi, K. Nam, H. S. Jung, C. S. Yoon, J. H. Ko, H. J. Jun, T. K. Kim, S. J. Jung, J. H. Park, Y. Lee and J.-S. Park, J. Gene Med., 2012, 14, 272–278 CrossRef CAS PubMed.
- H. Liu, T. Tørring, M. Dong, C. B. Rosen, F. Besenbacher and K. V. Gothelf, J. Am. Chem. Soc., 2010, 132, 18054–18056 CrossRef CAS PubMed.
- S. Milani, F. Baldelli Bombelli, D. Berti and P. Baglioni, J. Am. Chem. Soc., 2007, 129, 11664–11665 CrossRef CAS PubMed.
- V. Allain, C. Bourgaux and P. Couvreur, Nucleic Acids Res., 2012, 40, 1891–1903 CrossRef CAS PubMed.
- S. Shuto, S. Ueda, S. Imamura, K. Fukukawa, A. Matsuda and T. Ueda, Tetrahedron Lett., 1987, 28, 199–202 CrossRef CAS.
- S. Shuto, H. Itoh, S. Ueda, S. Imamura, K. Fukukawa, M. Tsujino, A. Matsuda and T. Ueda, Chem. Pharm. Bull., 1988, 36, 209–217 CrossRef CAS.
- M. Ahlers, H. Ringsdorf, H. Rosemeyer and F. Seela, Colloid Polym. Sci., 1990, 268, 132–142 CAS.
- D. Berti, L. Franchi, P. Baglioni and P. L. Luisi, Langmuir, 1997, 13, 3438–3444 CrossRef CAS.
- D. Berti, P. Barbaro, I. Bucci and P. Baglioni, J. Phys. Chem. B, 1999, 103, 4916–4922 CrossRef CAS.
- F. B. Bombelli, D. Berti, M. Almgren, G. Karlsson and P. Baglioni, J. Phys. Chem. B, 2006, 110, 17627–17637 CrossRef CAS PubMed.
- S. Milani, D. Berti, S. Dante, T. Hauss and P. Baglioni, Langmuir, 2009, 25, 4084–4092 CrossRef CAS.
- S. Milani, G. Karlsson, K. Edwards, P. Baglioni and D. Berti, J. Colloid Interface Sci., 2011, 363, 232–240 CrossRef CAS PubMed.
- P. Baglioni and D. Berti, Curr. Opin. Colloid Interface Sci., 2003, 8, 55–61 CrossRef CAS.
- S. Milani, F. B. Bombelli, D. Berti, T. Hauss, S. Dante and P. Baglioni, Biophys. J., 2006, 90, 1260–1269 CrossRef CAS PubMed.
- F. B. Bombelli, F. Betti, D. Berti, F. Pini, M. Heinrich and P. Baglioni, J. Phys.: Condens. Matter, 2008, 20, 104213 CrossRef.
- R. Esfand and D. A. Tomalia, Drug Discovery Today, 2001, 6, 427–436 CrossRef CAS.
- C. N. Likos, S. Rosenfeldt, N. Dingenouts, M. Ballauff, P. Lindner, N. Werner and F. Vögtle, J. Chem. Phys., 2002, 117, 1869–1877 CrossRef CAS PubMed.
- M.-L. Ainalem, A. Bartles, J. Muck, R. S. Dias, A. M. Carnerup, D. Zink and T. Nylander, PLoS One, 2014, 9, e92692 Search PubMed.
- M. Yanez Arteta, F. Eltes, R. A. Campbell and T. Nylander, Langmuir, 2013, 29, 5817–5831 CrossRef CAS PubMed.
- M.-L. Ainalem, A. M. Carnerup, J. Janiak, V. Alfredsson, T. Nylander and K. Schillen, Soft Matter, 2009, 5, 2310–2320 RSC.
- A. Y. Yang, R. J. Rawle, C. R. D. Selassie and M. S. Johal, Biomacromolecules, 2008, 9, 3416–3421 CrossRef CAS PubMed.
- A. Mezei, R. Mészáros, I. Varga and T. Gilányi, Langmuir, 2007, 23, 4237–4247 CrossRef CAS PubMed.
- M. Yanez Arteta, R. A. Campbell and T. Nylander, Langmuir, 2014, 30, 5817–5828 CrossRef CAS PubMed.
- J. Janiak, S. Bayati, L. Galantini, N. V. Pavel and K. Schillén, Langmuir, 2012, 28, 16536–16546 CrossRef CAS PubMed.
- J. F. Miller, K. Schätzel and B. Vincent, J. Colloid Interface Sci., 1991, 143, 532–554 CrossRef CAS.
- M. Rodahl, F. Hook, A. Krozer, P. Brzezinski and B. Kasemo, Rev. Sci. Instrum., 1995, 66, 3924–3930 CrossRef CAS PubMed.
- M. V. Voinova, M. Rodahl, M. Jonson and B. Kasemo, Phys. Scr., 1999, 59, 391 CrossRef CAS.
- F. Höök, B. Kasemo, T. Nylander, C. Fant, K. Sott and H. Elwing, Anal. Chem., 2001, 73, 5796–5804 CrossRef.
- D. Johannsmann, in Springer Series on Chemical Sensors and Biosensors: Piezoelectric Sensors, ed. C. Steinem and A. Janshoff, 2007, vol. 5, pp. 49–109 Search PubMed.
- S. Paul, D. Paul, T. Basova and A. K. Ray, J. Phys. Chem. C, 2008, 112, 11822–11830 CAS.
- L. A. Clifton, M. D. Lad, R. J. Green and R. A. Frazier, Biochemistry, 2007, 46, 2260–2266 CrossRef CAS PubMed.
- R. A. Campbell, H. P. Wacklin, I. Sutton, R. Cubitt and G. Fragneto, Eur. Phys. J. Plus, 2011, 126, 107 CrossRef.
- D. C. McDermott, J. R. Lu, E. M. Lee, R. K. Thomas and A. R. Rennie, Langmuir, 1992, 8, 1204–1210 CrossRef CAS.
- A. Nelson, J. Appl. Crystallogr., 2006, 39, 273–276 CrossRef CAS.
- F. Abeles, Ann. Phys., 1948, 3, 504–520 Search PubMed.
- M. Yanez Arteta, D. Berti, C. Montis, R. A. Campbell, L. A. Clifton, M. W. A. Skoda, O. Soltwedel, P. Baglioni and T. Nylander, Soft Matter, 2014, 10, 8401–8405 RSC.
- T. A. Betley, M. M. Banaszak Holl, B. G. Orr, D. R. Swanson, D. A. Tomalia and J. R. Baker, Langmuir, 2001, 17, 2768–2773 CrossRef CAS.
- M.-L. Ainalem, R. A. Campbell and T. Nylander, Langmuir, 2010, 26, 8625–8635 CrossRef CAS PubMed.
- R. S. Armen, O. D. Uitto and S. E. Feller, Biophys. J., 1998, 75, 734 CrossRef CAS.
- D. Marquardt, J. Soc. Ind. Appl. Math., 1963, 11, 431–441 CrossRef.
- I. Reviakine, D. Johannsmann and R. P. Richter, Anal. Chem., 2011, 83, 8838–8848 CrossRef CAS PubMed.
- E. Stellwagen, A. Abdulla, Q. Dong and N. C. Stellwagen, Biochemistry, 2007, 46, 10931–10941 CrossRef CAS PubMed.
- Q. Dong, E. Stellwagen and N. C. Stellwagen, Biochemistry, 2009, 48, 1047–1055 CrossRef CAS PubMed.
- D. F. Evans and H. Wennerström, The colloidal domain: where physics, chemistry, biology, and technology meet, VCH Publishers, New York, 1994 Search PubMed.
- F. Baldelli Bombelli, D. Berti, U. Keiderling and P. Baglioni, J. Phys. Chem. B, 2002, 106, 11613–11621 CrossRef.
- L. Sethaphong, A. Singh, A. E. Marlowe and Y. G. Yingling, J. Phys. Chem. C, 2010, 114, 5506–5512 CAS.
- M. Banyay, M. Sarkar and A. Gräslund, Biophys. Chem., 2003, 104, 477–488 CrossRef CAS.
- W. Saenger, Angew. Chem., 1973, 12, 591–601 CAS.
- D. Berti, F. Baldelli Bombelli, M. Fortini and P. Baglioni, J. Phys. Chem. B, 2007, 111, 11734–11744 CrossRef CAS PubMed.
- P. E. S. Smith, J. R. Brender, U. H. N. Dürr, J. Xu, D. G. Mullen, M. M. Banaszak Holl and A. Ramamoorthy, J. Am. Chem. Soc., 2010, 132, 8087–8097 CrossRef CAS PubMed.
- M. Nakano, H. Tateishi-Karimata, S. Tanaka and N. Sugimoto, J. Phys. Chem. B, 2014, 118, 9583–9594 CrossRef CAS PubMed.
- E. Stellwagen, J. M. Muse and N. C. Stellwagen, Biochemistry, 2011, 50, 3084–3094 CrossRef CAS PubMed.
- K. Fant, B. Nordén and P. Lincoln, Biochemistry, 2011, 50, 1125–1127 CrossRef CAS PubMed.
- T. Niidome and L. Huang, Gene Ther., 2002, 9, 1647 CrossRef CAS PubMed.
- J. S. Choi, K. Nam, J.-y. Park, J.-B. Kim, J.-K. Lee and J.-s. Park, J. Controlled Release, 2004, 99, 445–456 CrossRef CAS PubMed.
- J. L. Santos, D. Pandita, J. Rodrigues, A. P. Pêgo, P. L. Granja, G. Balian and H. Tomás, Mol. Pharmaceutics, 2010, 7, 763–774 CrossRef CAS PubMed.
- V. Tjong, L. Tang, S. Zauscher and A. Chilkoti, Chem. Soc. Rev., 2014, 43, 1612–1626 RSC.
- R. Singh, M. D. Mukherjee, G. Sumana, R. K. Gupta, S. Sood and B. D. Malhotra, Sens. Actuators, B, 2014, 197, 385–404 CrossRef CAS PubMed.
- P. Yáñez-Sedeño, L. Agüí, R. Villalonga and J. M. Pingarrón, Anal. Chim. Acta, 2014, 823, 1–19 CrossRef PubMed.
- A. Hayat and J. L. Marty, Front. Chem., 2014, 2, 41 Search PubMed.
- J. Wang, M. Jiang, T. W. Nilsen and R. C. Getts, J. Am. Chem. Soc., 1998, 120, 8281–8282 CrossRef CAS.
- R. Benters, C. M. Niemeyer and D. Wöhrle, ChemBioChem, 2001, 2, 686–694 CrossRef CAS.
- N. Zhu, H. Gao, Q. Xu, Y. Lin, L. Su and L. Mao, Biosens. Bioelectron., 2010, 25, 1498–1503 CrossRef CAS PubMed.
- M. Yang, M. E. McGovern and M. Thompson, Anal. Chim. Acta, 1997, 346, 259–275 CAS.
Footnote |
| † Electronic supplementary information (ESI) available: Definition of the β-expression, characterization of the SiO2 layers from the NR experiments, complementary QCM-D data in other solvents and tables with the calculated interfacial wet mass, complementary neutron reflectivity profiles in other isotopic contrasts and solvent conditions, and additional tables with the parameters obtained from the NR fittings. See DOI: 10.1039/c4sm02712d |
| This journal is © The Royal Society of Chemistry 2015 |