
 Open Access Article
 This Open Access Article is licensed under a Creative Commons Attribution-Non Commercial 3.0 Unported Licence
Classifying dynamic contact line modes in drying drops†
Kyle Anthony
Baldwin‡
*a and
David John
Fairhurst‡
b
aSchool of Physics and Astronomy, University of Nottingham, Nottingham NG7 2RD, UK. E-mail: kyle.baldwin@nottingham.ac.uk
bSchool of Science and Technology, Nottingham Trent University, Nottingham NG11 8NS, UK
First published on 6th January 2015
Abstract
Although the evaporation mode of sessile droplets is almost universally characterized as either constant contact radius (CCR) or constant contact angle (CCA), here we investigate two alternatives where the contact line speed is either constant or inversely proportional to the droplet radius. We present supporting evidence from our experiments on poly(ethylene oxide) (PEO) polymer solutions and blood, and from literature on pure and binary liquids, colloidal suspensions, soft substrates, reactive dewetting and hole nucleation. We introduce the use of novel “clock-drop” images to visualize droplet evolution and dimensionless height–radius plots to characterize the evaporative pathways. Combining these with a simple scaling argument, we show that receding speed is inversely proportional to the three-phase contact radius R, with a constant of proportionality A, which is dependent on the drying conditions and drop shape, but independent of drop volume. We have shown that this is equivalent to a linear decrease in contact area with time. By varying only A, which we achieved experimentally by choosing solutions whose precipitate constricts after deposition, the evaporation mode can be altered continuously to include the two established modes CCR and CCA, and two new modes which we term “slowly receding” and “rapidly receding”, which are characterised by fully dried “doughnut” and “pillar” deposits respectively.
1 Introduction
In 1805 Thomas Young published his famous equation relating the contact angle a static sessile droplet makes with a substrate, and the interfacial tensions at the three phase boundaries; droplet–air, droplet–substrate and substrate–air.1 While there remain some caveats (e.g. the lotus leaf effect, where microscopic structures create a larger than apparent wetting area, and thus, a larger than expected contact angle2) this relationship remains unchallenged for droplets at equilibrium. However, the complex dynamic situation of an evaporating droplet wetting a surface remains a topic of active research today, partly due to its various industrial applications such as ink-jet printing,3–8 aerosol spray cooling,9 thin films,10 molecular combing11 and self-assembly technologies.12–14One of the complexities of an evaporating droplet comes from the interplay between capillary and dissipative forces; while the spatially and temporally varying surface tension drives the liquid phase towards its evolving equilibrium shape, the droplet viscosity and contact line friction hinder motion of the contact line. Picknett and Bexon15 investigated droplet evaporation in the two limiting cases by solving the analogous problem of the electric field around one half of a charged biconvex conductor. They considered a spherical cap droplet of contact radius R, height h, contact angle θ and volume  where X = h/R = tan(θ/2). They showed that the evaporation rate
 ![[V with combining dot above]](https://www.rsc.org/images/entities/i_char_0056_0307.gif) is proportional to R multiplied by a term dependent on θ, which is often written as:16
is proportional to R multiplied by a term dependent on θ, which is often written as:16
 | (1) |
![[thin space (1/6-em)]](https://www.rsc.org/images/entities/char_2009.gif) θ is the angle-dependent term, which depends only moderately on the contact angle; varying from 0.64 at θ = 0° to 1.0 at θ = 90°.16 They used the analytical expressions to investigate two simple cases: constant contact angle (CCA) mode, in which dissipative forces are unimportant compared to those of surface tension so the droplet shape remains constant as the volume decreases due to evaporation; and constant contact radius (CCR) mode, where the pinning forces between drop and substrate maintain a stationary contact line with constant R, resulting in monotonic decrease in V and h. Deegan (1997) demonstrated that the latter case induces capillary flows that sweep suspended particles to the contact line, resulting in the often observed ring-stain17 which has been put to good use creating conducting loops for use in touch-screen displays.18 However in other applications, such as ink-jet printing of homogenous functional materials3–6 the deposition of suspended or dissolved material at the contact line is unwanted, and for this reason significant research has targeted methods of eliminating these stains.19–21
θ is the angle-dependent term, which depends only moderately on the contact angle; varying from 0.64 at θ = 0° to 1.0 at θ = 90°.16 They used the analytical expressions to investigate two simple cases: constant contact angle (CCA) mode, in which dissipative forces are unimportant compared to those of surface tension so the droplet shape remains constant as the volume decreases due to evaporation; and constant contact radius (CCR) mode, where the pinning forces between drop and substrate maintain a stationary contact line with constant R, resulting in monotonic decrease in V and h. Deegan (1997) demonstrated that the latter case induces capillary flows that sweep suspended particles to the contact line, resulting in the often observed ring-stain17 which has been put to good use creating conducting loops for use in touch-screen displays.18 However in other applications, such as ink-jet printing of homogenous functional materials3–6 the deposition of suspended or dissolved material at the contact line is unwanted, and for this reason significant research has targeted methods of eliminating these stains.19–21
If the evaporating droplet is a complex fluid, any phase changes which occur as the concentration increases will also affect the behaviour of the droplet. For example, in evaporating droplets of both dextran22 and bitumen23 the contact line becomes pinned and a flexible skin forms which means that the droplet no longer has the shape of a spherical cap. In previous work we have suggested that PEO droplets are squeezed inwards by a constricting ring of solid polymer which eventually lifts the remaining liquid from the surface.24,25 An aesthetically similar observation is seen in freezing water droplets as the water expands as it solidifies, leading to cusped solid deposits.26
Despite the simplicity of the CCA and CCR modes of evaporation, there are numerous documented cases which do not fit into either description. The simplest of these is a mixed mode in which the contact line undergoes successive jumps between pinning sites, commonly known as stick-slip motion:31 solute deposition at the contact line occurs during the CCR stage (stick), followed by sudden depinning (slip) during which R decreases and θ increases before the process repeats in a series of discontinuous steps depositing concentric rings as seen recently in droplets of colloidal32 or DNA33 solutions. Interestingly, while Shanahan provided a detailed explanation of stick-slip behavior in terms of Gibbs free energy barriers,31 the dynamics of the rapid slip stage have yet to be properly investigated. Further examples of deviations from CCR and CCA behaviours include: non-azeotropic solvent mixtures in which the equilibrium contact angle changes as the composition evolves with time,27,28,34 which can even include a period of spreading; and aqueous droplet suspensions on soft substrates, which after a period of pinning, deviate from both CCR and CCA when the contact angle reduces.29 Data from these observations are collated in h–R plots of droplet height against base radius in Fig. 1 which allow easy comparison of different evaporation trajectories: CCR mode is a vertical line and CCA follows a line with gradient X = h/R. Dynamics can be indicated by plotting data points spaced equally in time. Also included in the bottom-right plot are our own measurements of a distinct type of behaviour found in blood at low pressures and polymeric solutions, which display an increase in both contact angle and height with time as an advancing solidifying collar35 at the contact line squeezes the remaining liquid inwards. At later stages the collar even lifts the droplet above the surface so h > Rtan(θ/2). There are other documented examples not illustrated here, such as droplets of pure solvents evaporating on hydrophobic surfaces, which decrease in both contact angle and radius with time36–38 and droplets of anti-creeping salt solutions39 in which the liquid retreats from the precipitate. These various examples highlight the existence of evaporation modes other than CCA and CCR and indicate the need for generic tools with which to analyse droplet evaporation.
 | ||
| Fig. 1 Literature data from evaporating droplet experiments showing height and radius values, normalised by initial contact radius R0, that do not fit the standard CCR (vertical line) or CCA (diagonal lines) modes. Top-left: pure and mixed solvent solutions.27,28 Top-right: suspensions on soft PDMS substrates, where E labeled is the substrate elastic modulus.29 Bottom-left: stick-slip behavior of TiO2 colloidal solutions on hydrophobic substrates.30 Bottom-right: our experimental observations of PEO solutions and low-pressure blood droplets. Data are made dimensionless by normalising with R0, the initial contact radius. This normalises for the initial size of the droplet while preserving information about the droplet shape. Faint gray solid lines are trajectories for CCA mode with θ = 30, 60, 80, 96, 110 and 135°. Faint gray dotted lines are the trajectories of droplet following CCR for the entirety of the evaporation. Arrows indicate the direction of time in each case. | ||
In this manuscript we examine the superficially similar evaporatively-driven droplet dewetting mode illustrated in the bottom-right sub-plot of Fig. 1 for two very different systems: the model water-soluble polymer, poly(ethylene oxide) PEO and the multi-component system of blood under low pressure. We explore two possibilities for this drying mode: (i) constant dewetting speed, Ṙ = −cst as observed in rupture of thin-films40 and self-propulsion of reactive droplets;41,42 (ii) dewetting speed inversely proportional to the base radius, Ṙ = −A/R where A is a constant dependent on drying conditions (e.g. substrate temperature and thermal conductivity, atmospheric conditions, solvent volatility, etc.). This mode can alternatively be described by R2 = R02 − 2At indicating a linear decrease in wetted area with time. We also present useful graphical tools for visualizing and analyzing droplet evaporation.
2 Methods
PEO solutions (average molecular weight Mw = 100 kg mol−1, Sigma Aldrich 181986) were prepared with initial mass concentration c0 = 10% using distilled, deionized water and left to equilibrate for at least 24 hours. Solutions were inverted several times prior to use to ensure uniformity. Defibrinated sheep blood with a red blood cell volume fraction between 32% and 52% was obtained from TCS Biosciences and stored in a refrigerator at 5 °C until an hour before use when it was removed and allowed to reach room temperature. At atmospheric pressure, blood droplets form flat dried deposits,43 however for this investigation the droplets were evaporated in a chamber at 2% atmospheric pressure.44 Pressure was reduced to increase the Péclet number,45 and thus, the solute concentration gradient at the contact line, in order to induce precipitation at higher contact angles than would be observed at ambient conditions, without altering the hydrophobicity of the substrate. At atmospheric pressure blood dries to a flat deposit, as PEO does at low concentrations, slow drying rates or low initial contact angles. To see pillars in blood we increased the drying rate, and hence the Péclet number, by using a low pressure chamber.45Droplets of initial volume V0 from 0.34 to 20 μl were slowly pipetted onto a clean glass microscope cover slip. Digital cameras from Imaging Source were positioned parallel and perpendicular to the substrate plane to simultaneously record profile and top-view images of the droplets as they evaporated with frame rates between 0.1 and 30 fps. From the images, we define the instantaneous liquid radius R from the position of the three-phase contact line: for PEO droplets this is easiest using the overhead camera which shows very clear contrast between the liquid and birefringent solid, whereas for blood the profile view allows measurement of where the spherical cap of the liquid terminates. R0 is the radius during the pinned stage. The droplet height h is defined as the distance between the top of the droplet and the substrate, even if the liquid is no longer in contact with the substrate.
3 Results and discussion
Fig. 2 is a representative set of results from a droplet with V0 = 10 μl. For t < 3000 s the drop remains pinned to the substrate (CCR mode) with an almost linear decrease in both height and contact angle with time. At t ≈ 3000 s, precipitation of solid PEO begins at the contact line45 which pushes the liquid inwards. During this stage, R decreases while θ increases which is neither classical CCR nor CCA mode. Initially, h continues to decrease during the receding stage, until, at t ≈ 3500 s, the droplet height begins to increase. At t ≈ 4500 s, the liquid phase becomes entirely encased by precipitate, and thus R = 0. The average drying rate constant K from eqn (1) was determined for 13 droplets with different volumes and 19 droplets with different contact angles to be K = 1720 ± 190 μm2 s−1 with no noticeable dependency on either. Blood droplets under low pressure show similar behavior, although the receding stage starts almost immediately as a solid film forms at the edge of the droplet and pushes the remaining liquid blood inwards. The entire evaporation process takes less than 100 s. | ||
| Fig. 2 Left: time-lapse images of a drying droplet with V0 = 10 μl and dashed lines (red online) illustrating the value of θ. Scale bar represents 1 mm. Right: contact angle, normalized radius (R/R0) and normalized height (h/h0) plotted against time. Images and data points are taken from the same experiment. The plot is split into two regions: pinned, where the contact line is fixed, CCR; receding, where the contact line retreats. This latter stage is further split into regions in which the height decreases and increases respectively. Dashed line (red online) is a Ṙ = −A/R fit to the receding stage. Solid lines are Ṙ = −cst fits to the shrinking and growing height regions of the receding stage. | ||
Fig. 3 is a time-lapse representation of the latter stages of evaporation of a PEO droplet taken under crossed polarisers. On the left is a standard image sequence with time increasing from top to bottom. On the right is a novel composite clock-drop image with time increasing in a clockwise direction. Due to the circular symmetry of the droplet, this single image summarizes the receding behaviour. The solid line (red online) indicates initial CCR mode, dashed (blue) shows Ṙ = −cst and dotted (red) is Ṙ = −A/R. The two fits agree reasonably well for the majority of the dewetting phase, until late times which is better fit by Ṙ = −A/R. However, in individual experiments it can be difficult to distinguish between the two proposed receding modes. As illustrated in Fig. 2, while the receding stages of individual experiments are reasonably well fit with a 1/R dependency, distinct linear regions can also be discerned from the data.
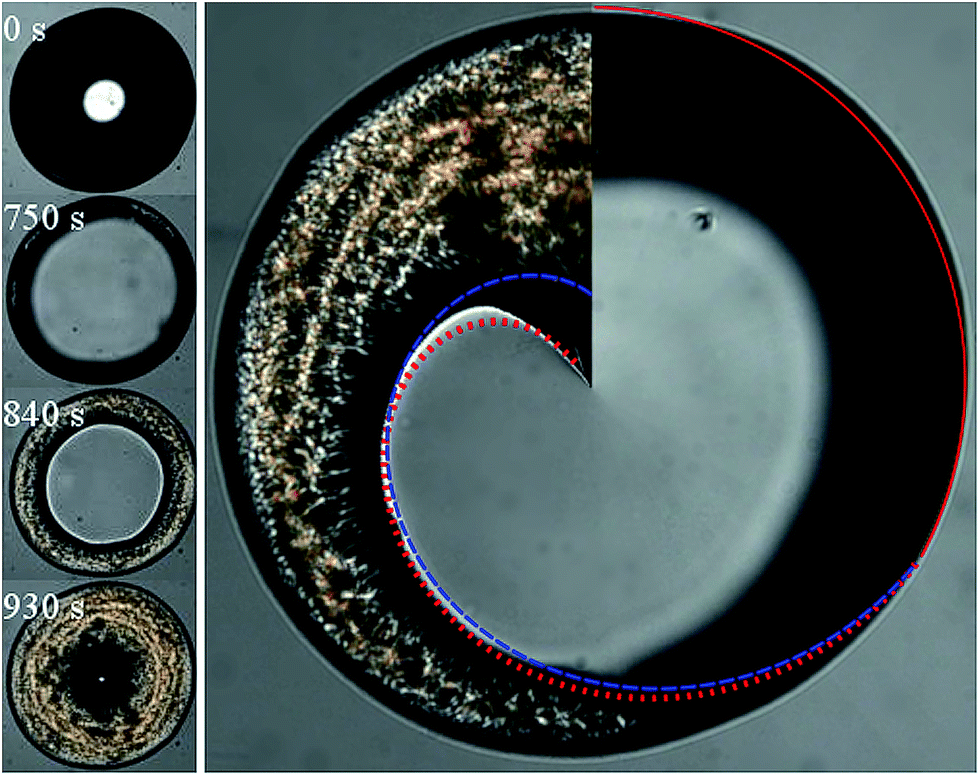 | ||
| Fig. 3 Left: time-lapse images of a PEO droplet with c0 = 10% and V0 = 1 μl evaporating for almost 2000 seconds at atmospheric conditions, viewed through crossed polarisers. Right: composite time-lapse image of the final 360 seconds of the same droplet. Images are recorded every second, and adjacent 1° sectors of consecutive images are combined to make this composite in which time increases from the top of the image in a clockwise direction. The solid (red online) curve shows the final 130 seconds of CCR mode evaporation, the dotted red line shows dewetting with Ṙ ∝ −1/R, and the dashed blue line shows dewetting with Ṙ = −cst. The image manipulation was performed by an ImageJ plugin which is available in the ESI.† Image width is 1.8 mm. | ||
To help distinguish these two modes, Fig. 4a is a plot of h against R made dimensionless by normalizing by R0 for both PEO and blood droplets with initial volumes ranging over almost 2 orders of magnitude. For each liquid, these data collapse well onto a single curve. For comparison, we numerically calculated the evolution of the drop parameters (V, R, h and θ) using the same θ0, and varying V0 and the exponent α in the receding velocity Ṙ ∝ −Rα, between −2 and 2 and assuming f(θ)/sin(θ) = 1. These trajectories collapsed onto a single dimensionless curve only when α = −1 offering more support for the Ṙ = −A/R mode. We found little difference when using the full θ-dependent evaporation rate given in eqn (1).
 | ||
| Fig. 4 (a) Drying trajectories of five PEO droplets (c0 = 10%) with volumes ranging from 0.34 μl to 10 μl and six blood droplets with volumes between 0.5 μl to 10 μl. Droplet radius and height values are made dimensionless by scaling with R0 and show similar behavior. The solid line is a numerical prediction for a droplet with similar shape to the PEO droplets, which begins receding when the volume reduces to 35% and with Ṙ = −A/R. (b) Drying trajectories of six PEO droplets with the same initial volume (V0 = 10 μl) and mass concentrations ranging from 2 to 25%. All concentrations at and above 5% show an increase in contact angle during the receding phase and result in a tall central “pillar” deposit. At 2% the height (and volume) reduces to zero during the receding stage, θ decreases continuously and the final deposit is a wide, flat band, or “doughnut” shaped deposit. These two behaviours are separated by the constant contact angle (CCA) evaporation line, indicated here with an angle θ ≈ 18°. The faint gray lines are isochors with dimensionless volumes of V/R03 = 1.8, 1, 0.5 0.2 and 0.05. | ||
A scaling argument can also be used to explain the data collapse. For the normalized trajectories to be independent of V0, all parameters must scale consistently with droplet radius: we know that V ∝ R3 and, ignoring the weak dependency on θ, ∝ R1. We find Δt = ΔV/ ∝ R2 and use this to scale the contact line speed consistently. In agreement with previous results, we again find that Ṙ = ΔR/Δt ∝ R−1.
Having presented various observational evidence to support the 1/R mode, we now suggest a physical mechanism to explain why the evaporating droplets behave this way. The contact line is known to be pushed inwards by a solidifying collar which we assume to grow at a rate controlled by evaporation of water from a narrow band close to the contact line, and the accompanying arrival of either polymer or red blood cells. The width of this band w is determined by the solidification process and is independent of other drop parameters, and thus remains constant while the fraction of droplet surface (assumed hemispherical) covered by the band is ≈2πRw/2πR2 = w/R. Although decreases with reducing R, the fraction of evaporation taking place through the band will increase, resulting in a constant solidification rate. As the deposited solid layer is measured to have uniform thickness (see ESI† for profilometry data) the area covered by the solid deposit will grow linearly with time, leading to the observed 1/R contact line motion. We speculate that this behaviour will be seen in other systems in which the solid precipitates from the liquid droplet on the liquid–air interface but subsequently binds more strongly to the substrate than the liquid does, creating a constricting collar. Similar mechanisms of drying induced constriction and solidification induced vertical growth have been observed in other systems, such as drying bitumen droplets,23 and freezing water droplets.26 Preliminary observations of substrate bending induced by precipitation in drying PEO droplets is highly suggestive that this constricting collar effect is at least partially responsible for the vertical growth of these droplets at late times (see ESI†). A more systematic approach to measuring the force induced by this solid phase constriction should be carried out in future work.
For CCA mode, where θ and X are constant, setting the time derivative of the expression for V equal to −KR leads to Ṙ = −ACCA/R with a specific constant of proportionality ACCA = 2K/(π(Xdp3 + 3Xdp)) dependent on both the droplet's drying rate (K) and shape at depinning (Xdp and hence θdp). If the contact line recedes with A > ACCA then the contact angle will increase, and vice versa. To test this prediction we performed a further range of experiments in which A was approximately constant (with a measured average over all droplets of Ā = 1980 ± 290 μm2 s−1) and ACCA was controlled by altering the initial PEO concentration between 2% and 25%: higher concentration droplets precipitate earlier when θdp and Xdp are both larger so ACCA will be smaller. Fig. 4b shows the trajectories for these droplets, with the 2% droplet having a continually decreasing contact angle and “slow” moving contact line so that V = 0 before R = 0, leading to the usually narrow coffee ring being smeared out into a wide circular band by the moving contact line. All other droplets exhibited increasing θ and “fast” contact line motion, with R approaching 0 while V > 0 and so depositing tall central pillars. A dashed line has been added to divide the two types of behavior corresponding to θdp ≈ 18°. Using the value of K = 1720 ± 190 μm2 s−1 and setting ACCA equal to Ā the predicted value was calculated to be θdp = 21 ± 5°, in good agreement with the data. Of course, CCR mode, which typically results in a narrow coffee stain deposit at the very edge of the droplet, can also be considered part of the Ṙ = −A/R family simply by setting A = 0.
4 Conclusions
In summary, most droplets undergoing evaporation are considered to have constant contact angle (CCA) or constant contact radius (CCR), yet there are numerous examples in the literature, many listed above, that do not fall into these categories. Here we have paid particular attention to a specific alternative mode in which the dewetting is driven by a contracting solidification collar and presented results from two very different systems: crystallisation of PEO polymer droplets44 and gelation in droplets of blood.43 We have shown that in a single experimental run, measurement uncertainties mean it can be difficult to distinguish between Ṙ = −cst, a dewetting type behaviour observed in both thin film rupture zones40 and reactive dewetting,41,42 and a family of dewetting behaviours described by Ṙ = −A/R. However, when observing over a range of droplet volumes, only the latter behaviour collapses onto a single dimensionless h–R curve. We propose that the solidification collar should be observed for other liquids where the solid phase, formed at the liquid–air boundary near the contact line, binds strongly to the substrate. By controlling A through drying conditions and the solidification rate, the evaporation dynamics change continuously from CCR (A = 0) to “slow receding” (0 < A < ACCA) to CCA (A = ACCA) and finally to “fast receding” (A > ACCA), with corresponding variations in dried deposit from narrow ring, to broad band “doughnut” and tall central “pillars”. In addition, we offer analytical tools which will be useful in the characterization of evaporating droplets in general: dimensionless h–R plots to visualize the changing parameters; volume-independent data collapse to distinguish between subtly different dewetting modes; and composite clock-drop images as a new means of visualizing droplet evolution. We encourage others to be open to the possibility of alternative modes of droplet evaporation with practical implications for problems such as controlling heat transfer in spray-cooling systems and the dry-out patterns of multi-component droplets.Acknowledgements
K.A.B. acknowledges support from the Vice Chancellor's Bursary scheme from Nottingham Trent University. We also acknowledge useful discussions initiated through COST Action MP1106.References
- T. Young, Philos. Trans. R. Soc. London, 1805, 95, 65–87 CrossRef
.
- Y.-T. Cheng and D. E. Rodak, Appl. Phys. Lett., 2005, 86, 144101 CrossRef PubMed
- P. Calvert, Chem. Mater., 2001, 13, 3299–3305 CrossRef CAS
- B.-J. de Gans, P. C. Duineveld and U. S. Schubert, Adv. Mater., 2004, 16, 203–213 CrossRef CAS
- D. Kim, S. Jeong, B. K. Park and J. Moon, Appl. Phys. Lett., 2006, 89, 264101 CrossRef PubMed
- S. Jeong, D. Kim and J. Moon, J. Phys. Chem. C, 2008, 112, 5245–5249 CAS
- J. Park and J. Moon, Langmuir, 2006, 22, 3506–3513 CrossRef CAS PubMed
- J. A. Lim, W. H. Lee, H. S. Lee, Y. D. Park and K. Cho, Adv. Funct. Mater., 2008, 18, 229–234 CrossRef CAS
- M. Di Marzo, P. Tartarini, Y. Liao, D. Evans and H. Baum, Int. J. Heat Mass Transfer, 1993, 36, 4133–4139 CrossRef CAS
- U. Thiele, M. Mertig and W. Pompe, Phys. Rev. Lett., 1998, 80, 2869 CrossRef CAS
- J. Herrick and A. Bensimon, Biochimie, 1999, 81, 859–871 CrossRef CAS
- C. J. Brinker, Y. Lu, A. Sellinger and H. Fan, Adv. Mater., 1999, 11, 579–585 CrossRef CAS
- T. P. Bigioni, X.-M. Lin, T. T. Nguyen, E. I. Corwin, T. A. Witten and H. M. Jaeger, Nat. Mater., 2006, 5, 265–270 CrossRef CAS PubMed
- J. Xu, J. Xia and Z. Lin, Angew. Chem., 2007, 119, 1892–1895 CrossRef
- R. G. Picknett and R. Bexon, J. Colloid Interface Sci., 1977, 61, 336–350 CrossRef CAS
- F. Schönfeld, K.-H. Graf, S. Hardt and H.-J. Butt, Int. J. Heat Mass Transfer, 2008, 51, 3696–3699 CrossRef PubMed
- R. D. Deegan, O. Bakajin, T. F. Dupont, G. Huber, S. R. Nagel and T. A. Witten, Nature, 1997, 389, 827–829 CrossRef CAS PubMed
- M. Layani, A. Kamyshny and S. Magdassi, Nanoscale, 2014, 6, 5581–5591 RSC
- H. Hu and R. G. Larson, J. Phys. Chem. B, 2006, 110, 7090–7094 CrossRef CAS PubMed
- P. J. Yunker, T. Still, M. A. Lohr and A. G. Yodh, Nature, 2011, 476, 308–311 CrossRef CAS PubMed
- H. B. Eral, D. M. Augustine, M. H. Duits and F. Mugele, Soft Matter, 2011, 7, 4954–4958 RSC
- L. Pauchard and C. Allain, Europhys. Lett., 2003, 62, 897 CrossRef CAS
- M. A. Rodríguez-Valverde, P. Ramón-Torregrosa, A. Páez-Dueñas, M. A. Cabrerizo-Vílchez and R. Hidalgo-Álvarez, Adv. Colloid Interface Sci., 2008, 136, 93–108 CrossRef PubMed
- K. A. Baldwin, S. Roest, D. J. Fairhurst, K. Sefiane and M. E. Shanahan, J. Fluid Mech., 2012, 695, 321–329 CrossRef CAS
-
K. A. Baldwin, PhD thesis, Nottingham Trent University, 2012
- A. G. Marín, O. R. Enríquez, P. Brunet, P. Colinet and J. H. Snoeijer, Phys. Rev. Lett., 2014, 113, 054301 CrossRef
- C. Liu, E. Bonaccurso and H.-J. Butt, Phys. Chem. Chem. Phys., 2008, 10, 7150–7157 RSC
- K. Sefiane, S. David and M. E. R. Shanahan, J. Phys. Chem. B, 2008, 112, 11317–11323 CrossRef CAS PubMed
- M. C. Lopes and E. Bonaccurso, Soft Matter, 2013, 9, 7942–7950 RSC
- D. Orejon, K. Sefiane and M. E. R. Shanahan, Langmuir, 2011, 27, 12834–12843 CrossRef CAS PubMed
- M. E. R. Shanahan, Langmuir, 1995, 11, 1041–1043 CrossRef CAS
- E. Rio, A. Daerr, F. Lequeux and L. Limat, Langmuir, 2006, 22, 3186 CrossRef CAS PubMed
- S. Maheshwari, L. Zhang, Y. Zhu and H.-C. Chang, Phys. Rev. Lett., 2008, 100, 044503 CrossRef
- S. M. Rowan, M. I. Newton, F. W. Driewer and G. McHale, J. Phys. Chem. B, 2000, 104, 8217–8220 CrossRef CAS
- K. A. Baldwin, S. Roest, D. J. Fairhurst, K. Sefiane and M. E. R. Shanahan, J. Fluid Mech., 2012, 695, 321–329 CrossRef CAS
- C.-K. Chiang and Y.-W. Lu, J. Micromech. Microeng., 2011, 21, 075003 CrossRef
- E. L. Talbot, A. Berson, P. S. Brown and C. D. Bain, Phys. Rev. E: Stat., Nonlinear, Soft Matter Phys., 2012, 85, 061604 CrossRef CAS
- B. Sobac and D. Brutin, Langmuir, 2011, 27, 14999–15007 CrossRef CAS PubMed
- W. J. P. van Enckevort and J. H. Los, Cryst. Growth Des., 2013, 13, 1838–1848 CAS
- E. Bertrand, T. D. Blake and J. D. Coninck, Colloids Surf., A, 2010, 369, 141–147 CrossRef CAS PubMed
- P. G. De Gennes, Phys. A, 1998, 249, 196–205 CrossRef CAS
- L. Schmirgeld-Mignot, P. Molinas-Mata, S. Poissonnet and G. Martin, Philos. Mag. Lett., 2000, 80, 33–40 CrossRef CAS
- B. Sobac and D. Brutin, Phys. Rev. E: Stat., Nonlinear, Soft Matter Phys., 2011, 84, 011603 CrossRef CAS
- K. A. Baldwin and D. J. Fairhurst, Colloids Surf., A, 2014, 441, 867–871 CrossRef CAS PubMed
- K. A. Baldwin, M. Granjard, D. I. Willmer, K. Sefiane and D. J. Fairhurst, Soft Matter, 2011, 7, 7819–7826 RSC
Footnotes |
| † Electronic supplementary information (ESI) available. See DOI: 10.1039/c4sm02642j |
| ‡ These authors contributed equally to this work. |
| This journal is © The Royal Society of Chemistry 2015 |