
Rotating crystals of magnetic Janus colloids†
J.
Yan
a,
S. C.
Bae
b and
S.
Granick
*a
aDepartments of Materials Science and Engineering, Chemistry and Physics, University of Illinois at Urbana-Champaign, 1304 W. Green St., Urbana, IL 61801, USA. E-mail: sgranick@illinois.edu
bDepartment of Biomedical Engineering, Ulsan National Institute of Science and Technology, UNIST-gil 50, Ulsan, Ulju-gun 689-798, Korea
First published on 5th November 2014
Abstract
Monodisperse magnetic colloids are found to self-assemble into unusual crystals in the presence of rotating magnetic fields. First, we confirm a predicted phase transition (S. Jäger and S. H. L. Klapp, Soft Matter, 2011, 7, 6606–6616), directly coupled to the dynamic transition of single particle motion, from a disordered state to a hexagonal crystal. Next, going beyond what had been predicted, we report how hydrodynamic coupling produces shear melting, dislocations, and periodically mobile domain boundaries. These uniform magnetic colloids, whose structures are modulated in situ using the protocols described here, demonstrate a strategy of stimulus-response in the colloid domain with potential applications.
1 Introduction
The directed assembly of particulate matter by external fields is of mounting topical interest for potential applications in optics,2 structural materials,3 microfluidic devices,4 sensors,5 and robotics.6 To accomplish this, magnetic control presents unique advantages as not only does its remote application simplify device integration but also, magnetic interaction is easy to model and characterize due to its unscreened nature in electrolyte solutions.7 Static magnetic fields can direct isotropic magnetic particles into periodic lattices,8 but a growing trend is to use time-dependent fields such as alternating,9 biaxial,10 and triaxial fields.11 For example, colloidal membranes have been synthesized using a precessing (triaxial) field at the “magic” precession angle.12 The resulting structures can have anisotropic magnetic, electrical, and thermal properties with potential applications in responsive materials which can be reconfigured upon external triggering.3Most efforts to date involve the induced dipoles of paramagnetic and superparamagnetic spheres,10,13–15 or magnetic holes in a paramagnetic solution.16 Spheres of this kind do not move in space individually when they experience a time-varying magnetic field, because their magnetic moment follows the field instantaneously. The resulting self-assembled structures can then be understood by considering time-averaged interactions and equilibrium arguments only.17 Even more interesting phenomena arise when particles possess permanent dipoles: these are ferromagnetic colloids. Then, time-varying fields act on entire particles, not simply on their magnetic moment. Consequently, such particles undergo physical motion and experience viscous resistance when they are suspended in a liquid.18,19 They are the objects of this study.
For the prototypical case of a circularly rotating field, Kopelman and coworkers studied extensively the dynamics of individual magnetic colloids,20 showing that at low frequency they rotate synchronously with the field, while above a threshold frequency, the viscous drag prevents them from frequency locking. Recently, Klapp and coworkers have shown using computer simulations that the loss of synchronicity of single particle motion can produce a macroscopic phase transition from a layered to a disordered state.1 More recently, the same group investigated the effect of hydrodynamic interactions arising from the rotation–translation coupling of such particles through the viscous medium.21 To the best of our knowledge, these predictions did not see prior experimental tests.
Here, to achieve a homogeneous magnetic response, we use monodisperse spheres with magnetic coating on one side to be “Janus” and study the dynamic self-assembled structures of these magnetic particles in rotating magnetic fields. First, we observe a phase transition from a disordered state to an ordered hexagonal crystal, and conclude that the mechanism is coupled directly to a dynamical transition of the single particle motion. Next, we observe that the hydrodynamic interaction between these particles, which would be absent for paramagnetic particles, results in intriguing phenomena not predicted by prior theory: shear melting at the edge, dislocation formation and rotation, and periodic dynamic patterns of domain boundaries.
2 Methods
2.1 Particle design and synthesis
Magnetic Janus particles were selected as the experimental realization of dipolar spheres, as they are so experimentally convenient: they can be prepared in large quantities with very homogenous magnetic properties.22,23 Meanwhile, the optical contrast of Janus spheres allows the rotation to be visualized, while for isotropic spheres this cannot be done simply. The magnetic Janus particles were synthesized using directional electron beam deposition onto silica particles with a diameter d = 2 μm (Tokuyama) or 1.6 μm (NIST), prepared as a two-dimensional submonolayer on a Piranha-treated glass slide (Fig. 1). We then sequentially coated nickel (typical thickness was 18 nm) and SiO2 (typical thickness was 15 nm) onto one side of these spherical shapes.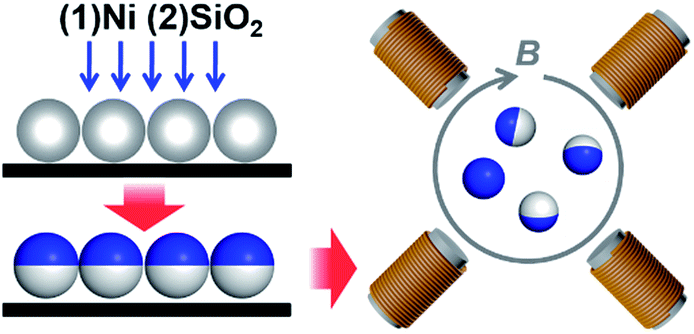 | ||
| Fig. 1 Experimental scheme. Thin coatings of first Ni and then protective SiO2 are sequentially deposited onto the top side of micron-sized silica spheres to produce Janus particles. After release into water, the coated spheres are subjected to a rotating magnetic field provided by two orthogonal pairs of solenoid coils. | ||
The magnetic response of these Janus spheres has been reported in ref. 11. Briefly, the particles possess both ferromagnetic and paramagnetic responses, mainly in the direction parallel to the Janus interface.
2.2 Assembly protocol
After sonication to release the particles into deionized water, we further sonicated the particles for another 30 minutes to remove any residual aggregates. We then introduced the suspension into an optical imaging chamber (Lab-Tek II chambered cover glass). Placed in aqueous suspension, the particles sediment close to the chamber bottom but are levitated by electrostatic repulsion from the charged wall. We then applied a homogenous rotating magnetic field, typically at 20 Hz and strength up to 2 mT (Fig. 1). The rotating magnetic field was generated by applying two sinusoidal signals with a π/2 phase shift to two pairs of iron-core solenoids (Science Source) placed orthogonally, using a function generator (Agilent 33522A) coupled to a dual channel power amplifier (Crown, XLS 202). Movies were recorded in a home-built microscope using an LED light source (Thorlabs MCWHL2), a 50× long-working-distance objective (Mitutoyo, N.A. = 0.55) and a CMOS camera (Edmund Optics 5012M GigE). The liquid–solid transition was mapped at a constant frequency ωB while slowly increasing the field strength B.2.3 Image analysis
Image analysis was performed by a home-written Matlab code. Particle positions were tracked using the circle finding functions in the image analysis toolbox. To track the rotation of the whole crystal, we applied a fast Fourier transform on the image and followed the motion of one of the six diffraction spots. To obtain particle trajectories, we developed a rotational version of correlated image tracking.24 Particles were first assumed to rotate with respect to the crystal center at the same angular speed, and from this their locations in the next time frame were predicted. By comparing the predicted to the actual positions, we mapped the particle identity. Standard Delaunay triangulation was performed to obtain the number of nearest neighbours of a particle and to identify dislocation pairs.2.4 Definition of order parameters
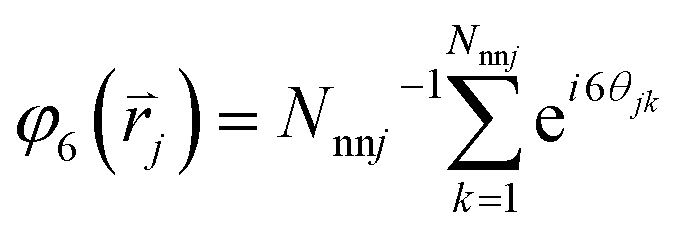
We followed the standard definition of order parameters for hexagonal crystals.25,26 For each particle in a cluster, a local six-fold bond-orientational order parameter φ6 is defined as:in which Nnnj is the number of nearest neighbours of particle j at position
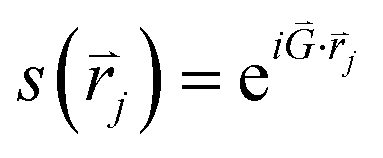
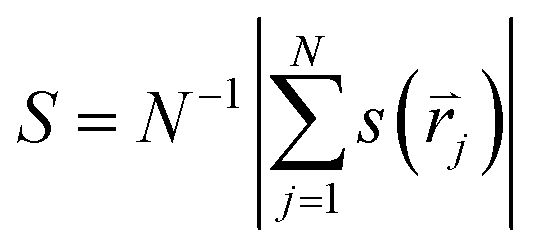
 , and θjk is the angle between an arbitrary axis and the line connecting the centers of particles j and k. The positional order parameter s for particle j is defined as:
in which
 is the reciprocal lattice vector of the hexagonal lattice. After calculating φ6 and s for all particles in the cluster, a global bond-orientational order parameter ψ6 is defined as:
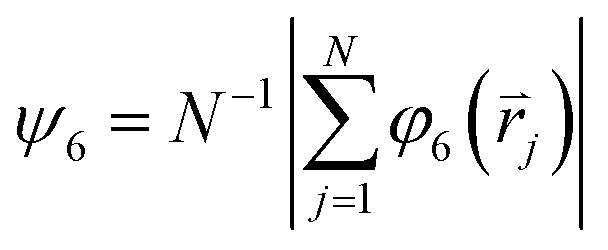
The global positional order parameter S is similarly defined as:
3 Results and discussion
3.1 Liquid-to-crystal transition coupled with dynamic transition of individual spheres
Interparticle attraction causes these particles to assemble into clusters when a rotating magnetic field is applied, and their internal order depends exquisitely on field strength. At low field strength, the cluster is liquid-like: it has no positional order (Fig. 2a). Meanwhile, the Janus director, defined as the unit vector pointing from a particle's uncoated side to the coated side, has random orientation. The rotation of individual particles does not follow the field, but exhibits periodic backward-rocking characteristic of asynchronous rotation.20 | ||
| Fig. 2 Liquid-crystal transition. (a) Image of a disordered cluster formed in an 0.6 mT, 20 Hz rotating magnetic field. (b) Image of a hexagonal crystal formed in a 1.0 mT, 20 Hz rotating magnetic field. (c) Critical frequency ωc (units: rad s−1) plotted against field strength B. The red line is a linear fit. (d) Images showing the kinetic formation of a hexagon. Note the orientation change of the particle being incorporated, indicated by red arrows. Times are t = 0, 0.59, 0.66, and 1.75 s, counterclockwise from the top right. Scale bar is 2 μm. | ||
Above a threshold field strength, the cluster becomes an ordered hexagonal crystal (Fig. 2b, ESI Movie 1†) in which the Janus directors point perpendicular to the image. Experimentally, this shows up as the visual appearance of opaqueness. Close inspection shows that individual particles continue to rotate with the frequency of the magnetic field (ωB) while the self-assembled crystal also rotates but more slowly, suggesting that the liquid-to-crystal transition might stem from a transition in single-particle dynamics. To understand this, consider that a rotating magnetic field exerts a torque on a dipole 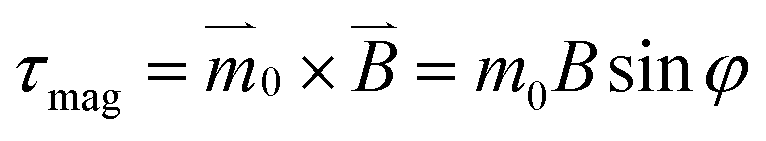 , where m0 is the dipole moment and φ = ωBt − θ is the phase lag of the dipole with the external field.23
 stands for the time-varying magnetic field and θ is the instantaneous phase of the magnetic dipole. The rotating particle also experiences a viscous torque τvis = πηd3dφ/dt, in which η is the solvent viscosity. Neglecting inertia in this low Reynolds number situation, one balances the two torques and concludes that dφ/dt = ωB/ωc − sin
![[thin space (1/6-em)]](https://www.rsc.org/images/entities/char_2009.gif) φ, in which the critical frequency is ωc = m0B/πηd3. For ωB < ωc, the solution to this equation is dφ/dt = 0, signifying that the particle rotates synchronously with the field, with the same speed and a constant phase lag. But for ωB > ωc, no steady solution exists.
φ, in which the critical frequency is ωc = m0B/πηd3. For ωB < ωc, the solution to this equation is dφ/dt = 0, signifying that the particle rotates synchronously with the field, with the same speed and a constant phase lag. But for ωB > ωc, no steady solution exists.
Experimentally, we mapped the relationship between the critical frequency ωc and field strength B (Fig. 2c) by visually detecting the transition from the liquid to the hexagonal state, and observed a clean linear relationship from the slope of which we inferred m0 to be 5.0 × 10⁻¹⁵ A m2, in pleasing agreement with the value estimated independently from the hysteresis curve.11 This provides experimental confirmation that the dynamic transition of individual particles dictates structural change of the assembled cluster – confirming a prediction of simulation.1
Several items merit discussion regarding particle rotation inside this moving crystal. First, in addition to the remnant magnetic moment on which our analysis up to this point was based, it is true that these particles also possess strong paramagnetic responses, visible in the magnetic hysteresis curves.11 Recently, this laboratory worked out the equation of motion of such particles in a precessing magnetic field by modeling them as purely paramagnetic particles.11 A precession angle of 90° is equivalent to a rotating field of concern here. However, solving the equation for this value of precession angle leads to singularity solution, such that individual spheres rotate with their Janus director always pointing perpendicular to the rotating field. This is not what we observed for isolated spheres (see below). Meanwhile, the scaling relationship of ωB ∝ B is also inconsistent with the prediction for paramagnetic particles. It seems that the dynamics of magnetic Janus spheres is governed by the residual dipolar moment, not by the paramagnetic component of the response, in this particular case of a purely rotating magnetic field.
Second, it is intriguing that in a cluster all particles point their magnetic cap perpendicular to the rotating field, as the equation of motion places no restriction on the Janus director's orientation. The most likely cause is the optimization of the interparticle dipole–dipole interaction. In such particles, the location of the dipole is shifted from the geometric center due to the asymmetric coating,27,28 causing the dipole–dipole distance between neighbouring particles to depend not only on the relative position but also on the orientation. The observed configuration equalizes all dipole–dipole separations, thus minimizing the total magnetic energy. Supporting this hypothesis is the change of state when a particle becomes incorporated into a cluster (Fig. 2d, ESI Movie 2†). In this movie, one sees that although particles do possess freedom of orientation when isolated, they adopt a “full moon” configuration once inside a cluster. In contrast, in the liquid state, this orientation locking is lost. Parenthetically, there is no magnetic energy difference between the up and down configurations for a single sphere, but gravitational energy encourages the metal-coated hemisphere to point down due to the extra weight of the coating. For these reasons, we expect all particles in a cluster to point down towards the substrate in principle.
Third, the hexagonal order in the observed rotating crystalline state is more pronounced than in the simulations.1 This is simply because the experiments concern larger particles, hence less thermal motion. There is an essential agreement that an isotropic, time-averaged interaction, balanced here by electrostatic repulsion, creates a potential that leads naturally to hexagonal packing. The detailed form and characterization of the potential are reported in ref. 29.
3.2 Cluster rotation
Next, we consider the rotation of the entire crystalline cluster. The following argument can explain this rotation and predict the scaling between the crystal size R and the rotation speed Ω (Fig. 3a). First, note that a fast-spinning sphere with an angular speed ω creates a flow field and exerts a shear force Fshear on a nearby particle with the same motion Fshear = 0.2πηωd2ln(H/d),30 in which H is the surface-to-surface separation between the particles. This is valid in the limit H ≪ d, which applies here on physical grounds. This force provides the torque to rotate a pair of particles at a frequency Ω = 0.13ln(d/H)ω.31 From image analysis, we estimated H to be 200–400 nm, corresponding to Ω = 0.2–0.3ω for a pair of spheres, close to the experimental observation.
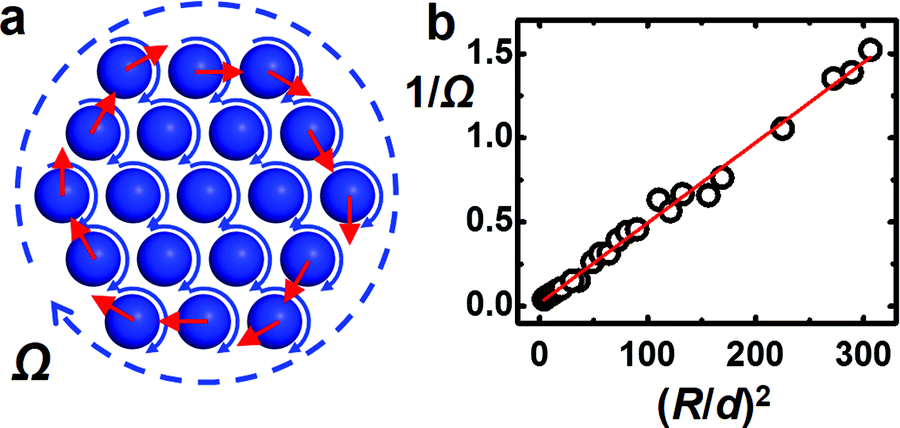 | ||
| Fig. 3 Crystal rotation. (a) Schematic representation of the rotation mechanism. Particles at the edge experience an unbalanced hydrodynamic shear force tangent to the edge (circle of red arrows). (b) Inverse angular velocity 1/Ω plotted as a function of (R/d)2, where R is the size of the crystal piece and d = 1.6 μm is the particle diameter in order to access the large crystal size. Red line is a linear fit. | ||
Now extend this analysis to the entire crystalline cluster, considering just the force from nearest neighbours to the first approximation, which makes sense since the forces are short-ranged. For particles in the interior of a crystal, the total shear force vanishes by symmetry. Only those at the edge experience an unbalanced force tangent to the interface (Fig. 3a). In other words, the cluster experiences an effective shear applied at its edge and hence the cluster rotates.32 Then, in the continuum approximation, the shear torque scales with both the number of particles at the edge (∝2πR) and the cluster diameter, hence scales as R2, while the viscous drag of this rotating disk scales as ΩR4, so that the balance of these two torques gives Ω ∝ R−2. Measurements are consistent with this hypothesis (Fig. 3b).
3.3 Shear melting
Experiments confirm the edge shear melting that can be expected from the edge-shearing mechanism. Fig. 4a shows that in a larger cluster, particles close to the center remain hexagonally ordered and undergo rigid body rotation, while near the edge particles rotate more rapidly (with respect to the cluster center) because of stronger shear. This is a sharp transition: Fig. 4b plots the local angular velocity Δω and number of nearest neighbours (Nnn) as a function of radial distance from the cluster center r. Once the particles at the edge are driven out of their equilibrium lattice position, they experience an unbalanced shear force that causes them to move faster than particles within the intact lattice, which can be clearly seen in ESI Movie 3.† The interfacial width of several particle diameters is an interesting effect not yet modeled to the best of our knowledge. Experimentally, we observed an almost constant boundary layer thickness of about 3d, regardless of the overall cluster size if the magnetic field strength and frequency were kept the same. | ||
| Fig. 4 Shear melting. (a) Image of a crystal with a shear-melted edge. The dotted red circle delineates the boundary between the solid and shear-melted region. Scale bar is 5 μm. (b) Plotted against the distance r from a cluster's center are the average number of nearest neighbours Nnn and the angular velocity Δω around the cluster center in the reference frame of the rotating cluster. (c and d) Positional order parameter S and bond-orientational order parameter ψ6 as a function of the cluster size R (analysed with 1.6 μm spheres). | ||
To quantify the shear melting transition, we tracked the positional order parameter S and the bond-orientational order parameter ψ6 (see the Methods section for definition) as a function of cluster size R (Fig. 4c and d). Indeed, above a critical radius about 6d, both order parameters experience a sharp drop, indicating the formation of the disordered boundary layer. This appears to be the point at which the shear force at the edge dominates over the rigidity of the crystal: the edge is shear-melted.33
3.4 Dislocation dynamics
The disordered boundary at the edge provides a continuous source of defects, the most common ones being dislocations (ESI Movie 4†).34 Dislocations are readily identified as a pair of particles with a number of nearest neighbours Nnn = 5 and 7 (Fig. 5),35 and are initiated by dissociation of dislocation pairs.36 Free dislocations have 5–7 dipole directions preferentially oriented tangent to the edge. Once the dislocations detach from the edge, we observed that they tend to move towards the cluster center in a gliding motion (Fig. 5a and b). Furthermore, after one free dislocation reaches the cluster center, a new free dislocation emerges at the cluster edge, oriented at an angle of 120° (Fig. 5c). The newborn dislocation quickly travels towards the center (Fig. 5d) and merges with the first one, producing a new dislocation with the direction determined by vector addition (Fig. 5e). This mechanism repeats regularly. It gives the central dislocation a discrete, apparent rotation in the reference frame of the rotating crystal (Fig. 5d–f).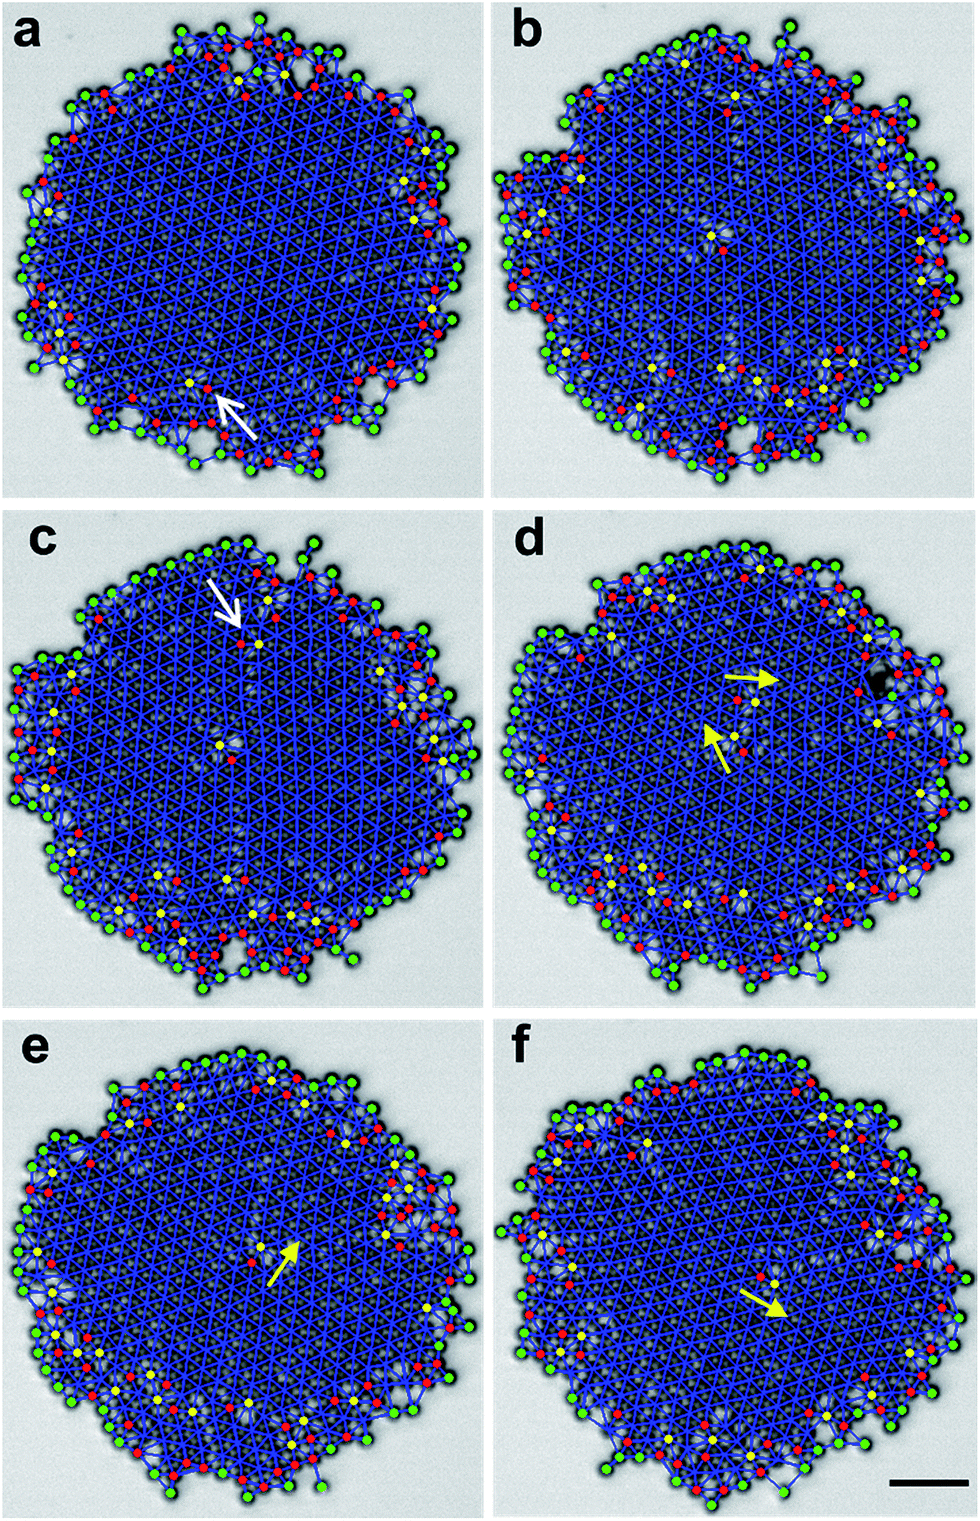 | ||
| Fig. 5 Dislocation dynamics. (a–f) Images at times t = 0, 0.76, 0.81, 0.89, 0.91, and 1.04 s, respectively. Red, yellow, and green dots represent particles with Nnn = 5, 7, and <5, respectively. A red dot and a yellow dot form a dislocation with 5–7 dipole orientations indicated by the yellow arrows. White arrows indicate newborn free dislocations. Scale bar is 10 μm. | ||
Physically, we imagine the mechanism to be that particles at the exterior experience larger viscous drag because of their larger linear velocity, which creates stress in the crystalline core. Formation of dislocations releases this stress to some extent, even though it comes at the cost of additional elastic energy.37 Since the energy associated with stress scales with R more strongly than does the dislocation energy, this explains why crystals above a critical size spontaneously release stress by forming dislocations. Meanwhile, this might explain our observation of a constant boundary layer thickness: the cluster self-regulates the edge shear stress by either causing the boundary spheres to move, or by generating defects in the crystalline core. It will be interesting in the future to build theoretical models for this self-regulation mechanism. Once formed, a dislocation with its Burger's vector in the radial direction experiences a Peach-Kohler force that drives it towards the center, where shear stress vanishes.38
3.5 Grain boundary dynamics
In even larger crystals, dislocations connect to form grain boundaries; this splits the crystal into multiple domains. Again, quasi-periodic behavior is observed (ESI Movie 5†): first a single crystal builds up stress, which is then released by breaking into multiple domains separated by clear domain boundaries (Fig. 6a), but domain boundaries heal over time to reestablish a uniform crystalline core (Fig. 6b), and this pattern repeats. Tracking the time dependence of total number of dislocations N in the solid core (Fig. 6c) reveals occasional bursts and a sudden decrease of N, which quantifies the scenario just described.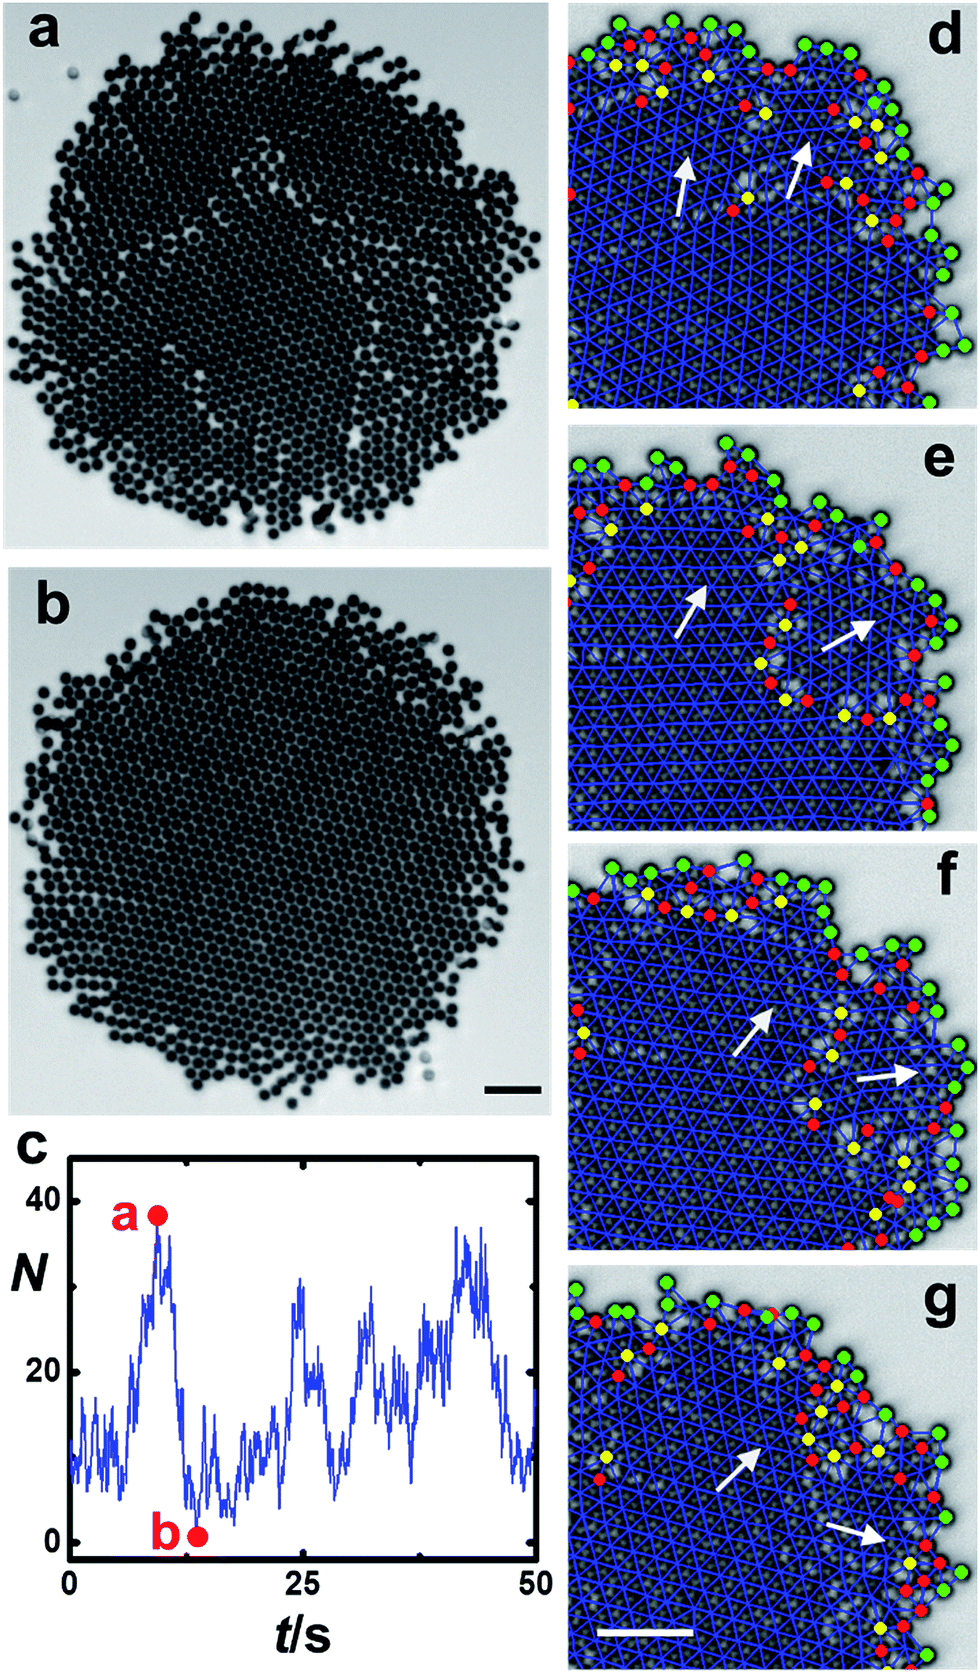 | ||
| Fig. 6 Grain boundary dynamics. (a and b) Images of a large cluster undergoing periodic breakdown into multiple domains followed by reunion into a single crystal at times t = 9.4 and 13.6 s, respectively. (c) The number of dislocation pairs N within the crystalline core is plotted against time for the sample illustrated in panels (a) and (b). (d–g) Images showing a cycle of domain dynamics. White arrows show crystal orientations of the majority and minority domains. The time interval is 0.36 s between (d) and (e) and 0.15 s in (e–g). Scale bar is 10 μm. | ||
Imaging a smaller cluster allows one to see more directly the mechanism of periodic healing with assistance from analysis using Delaunay triangulation (Fig. 6d–g and ESI Movie 6†). One sees that the grain boundary is easily identified as a string of dislocations. Starting from a strained single crystal, a small part of the crystal begins to adopt a crystal orientation different from the bulk, assisted by its dislocations. With time, the mismatch grows and develops into a separate microdomain that rotates not only around the center of the entire cluster but also around its own center. But when the phase of the small domain exceeds that of the large domain by the angular period of a hexagonal lattice (60°), the two domains regain registry. Hence, we attribute the observed pattern of bursts in N to the periodic release of strain into grain boundaries and the subsequent, differential rotation of domains of different mass, which restores crystallinity.
The periodic formation and reunion of multiple domains also explains the different behavior of the two order parameters S and ψ6 for large clusters (Fig. 4c and d). S characterizes global positional order and hence is more sensitive to defects and polycrystallinity. Thus, S keeps declining as the cluster size grows and multiple domains form. In contrast, ψ6 is a more local measurement of order; it stays flat for larger R as long as the cluster keeps a hexagonally ordered core. Both S and ψ6 show large temporal fluctuations even for a single cluster (reflected by the large error bars), as domains periodically break and reunite.
4 Conclusions
In this study, we experimentally report the predicted “layering transition” of particles with magnetic dipoles in a rotating magnetic field. To the best of our knowledge, this is the first such report. We confirm that this structural transition is dictated by a dynamic transition at a single particle level, from synchronous to asynchronous rotation. This physical system contrasts with the much-studied alternative system of paramagnetic particles, for which the particle motion is decoupled from the magnetic moment, and hence for which single particle dynamics is not relevant. Going beyond confirmation of what had already been predicted, we have demonstrated a plethora of dynamic patterns: edge shear melting, dislocation generation and recombination, and periodic domain dynamics, all arising from hydrodynamic interactions between rotating spheres that can be understood from simple scaling arguments. The same physical ideas may extend to the behavior of nanocrystals under mechanical shear,39 whose lattice distortions are interesting yet difficult to measure at the atomic level, but are described here from direct experiments using particles that are large enough to image in situ optically. Meanwhile, we also envision that the current methodology can be applied to the directed self-assembly of magnetic nanoparticles.2 Although they are one or two orders of magnitude smaller than the particles used in the current study, they can be made of pure magnetic materials rather than a thin shell and hence have sufficiently strong attraction to balance thermal randomization.Rotating fields represent the simplest time-dependent field. Extension to multiaxial fields is anticipated to generate more interesting dynamics, not only at the single particle level but also on larger scales. Regarding the magnetic particles themselves, extending spheres studied here to anisotropic shapes should bring another dimension to the problem, in the future.40,41 The interplay between the dipolar interactions and anisotropic shapes should give rise to crystals with new symmetries.42,43 The directional coating method used in this study is compatible with the rapidly expanding repertoire of colloids with nonspherical shapes, as methods are known how to introduce magnetic coatings onto them afterwards.44 New interesting physics and applications should be anticipated.
Acknowledgements
We thank Gregory Grason and Amir Azadi for discussions. This work was supported by the U.S. Department of Energy, Division of Materials Science, under Award no. DE-FG02-07ER46471 through the Frederick Seitz Materials Research Laboratory at the University of Illinois at Urbana-Champaign.Notes and references
- S. Jäger and S. H. L. Klapp, Soft Matter, 2011, 7, 6606–6616 RSC
.
- M. Wang, L. He and Y. Yin, Mater. Today, 2013, 16, 110–116 CrossRef CAS PubMed
- J. E. Martin, Composites, Part A, 2005, 36, 545–548 CrossRef PubMed
- P. S. Doyle, J. Bibette, A. Bancaud and J. L. Viovy, Science, 2002, 295, 2237 CrossRef CAS PubMed
- D. H. Read and J. E. Martin, Adv. Funct. Mater., 2010, 20, 1577–1584 CrossRef CAS
- J. Kim, S. E. Chung, S.-E. Choi, H. Lee, J. Kim and S. Kwon, Nat. Mater., 2011, 10, 747–752 CrossRef CAS PubMed
- P. Tierno, Phys. Chem. Chem. Phys., 2014, 16, 23515 RSC
- A. P. Hynninen and M. Dijkstra, Phys. Rev. Lett., 2005, 94, 138303 CrossRef
- J. W. Swan, J. L. Bauer, Y. Liu and E. M. Furst, Soft Matter, 2014, 10, 1102–1109 RSC
- D. Du, D. Li, M. Thakur and S. L. Biswal, Soft Matter, 2013, 9, 6867–6875 RSC
- J. Yan, M. Bloom, S. C. Bae, E. Luijten and S. Granick, Nature, 2012, 491, 578–581 CrossRef CAS PubMed
- N. Osterman, I. Poberaj, J. Dobnikar, D. Frenkel, P. Ziherl and D. Babić, Phys. Rev. Lett., 2009, 103, 228301 CrossRef CAS
- J. Dobnikar, A. Snezhko and A. Yethiraj, Soft Matter, 2013, 9, 3693–3704 RSC
- P. Tierno, R. Muruganathan and T. M. Fischer, Phys. Rev. Lett., 2007, 98, 028301 CrossRef
- A. Weddemann, F. Wittbracht, B. Eickenberg and A. Hütten, Langmuir, 2010, 26, 19225–19229 CrossRef CAS PubMed
- J. Černák and G. Helgesen, Phys. Rev. E: Stat., Nonlinear, Soft Matter Phys., 2008, 78, 061401 CrossRef
- N. Casic, S. Schreiber, P. Tierno, W. Zimmermann and T. M. Fischer, Europhys. Lett., 2010, 90, 58001 CrossRef
- B. A. Grzybowski, H. A. Stone and G. M. Whitesides, Nature, 2000, 405, 1033–1036 CrossRef CAS PubMed
- G. Kokot, A. Snezhko and I. S. Aranson, Soft Matter, 2013, 9, 6757–6760 RSC
- B. H. McNaughton, K. A. Kehbein, J. N. Anker and R. Kopelman, J. Phys. Chem. B, 2006, 110, 18958–18964 CrossRef CAS PubMed
- S. Jäger, H. Stark and S. H. L. Klapp, J. Phys.: Condens. Matter, 2013, 25, 195104 CrossRef PubMed
- A. Walther and A. H. E. Müller, Soft Matter, 2008, 4, 663–668 RSC
- I. Sinn, P. Kinnunen, S. N. Pei, R. Clarke, B. H. McNaughton and R. Kopelman, Appl. Phys. Lett., 2011, 98, 024101 CrossRef PubMed
- R. Besseling, L. Isa, E. R. Weeks and W. C. K. Poon, Adv. Colloid Interface Sci., 2009, 146, 1–17 CrossRef CAS PubMed
- K. Zhao and T. G. Mason, Phys. Rev. Lett., 2009, 103, 208302 CrossRef
- K. J. Strandburg, Rev. Mod. Phys., 1988, 60, 161–207 CrossRef CAS
- M. Klinkigt, R. Weeber, S. Kantorovich and C. Holm, Soft Matter, 2013, 9, 3535–3546 RSC
- A. I. Abrikosov, S. Sacanna, A. P. Philipse and P. Linse, Soft Matter, 2013, 9, 8904–8913 RSC
- J. Yan, S. C. Bae and S. Granick, Adv. Mater. Search PubMed
- A. J. Goldman, R. G. Cox and H. Brenner, Chem. Eng. Sci., 1967, 22, 637–651 CrossRef CAS
- K. Drescher, K. C. Leptos, I. Tuval, T. Ishikawa, T. J. Pedley and R. E. Goldstein, Phys. Rev. Lett., 2009, 102, 168101 CrossRef
- J. Schwarz-Linek, C. Valeriani, A. Cacciuto, M. E. Cates, D. Marenduzzo, A. N. Morozov and W. C. K. Poon, Proc. Natl. Acad. Sci. U. S. A., 2012, 109, 4052–4057 CrossRef CAS PubMed
- Y. L. Wu, D. Derks, A. van Blaaderen and A. Imhof, Proc. Natl. Acad. Sci. U. S. A., 2009, 106, 10564–10569 CrossRef CAS PubMed
-
D. R. Nelson, Defects and Geometry in Condensed Matter Physics, Cambridge University Press, Cambridge, England, 2001 Search PubMed
- W. T. M. Irvine, M. J. Bowick and P. M. Chaikin, Nat. Mater., 2012, 11, 948–951 CrossRef CAS PubMed
- V. Nosenko, G. E. Morfill and P. Rosakis, Phys. Rev. Lett., 2011, 106, 155002 CrossRef CAS
- G. M. Grason, Phys. Rev. Lett., 2010, 105, 045502 CrossRef
- A. Azadi and G. M. Grason, Phys. Rev. E: Stat., Nonlinear, Soft Matter Phys., 2012, 85, 031604 CrossRef
- J. R. Greer and J. T. M. De Hosson, Prog. Mater. Sci., 2011, 56, 654–724 CrossRef CAS PubMed
- S. Sacanna, D. J. Pine and G.-R. Yi, Soft Matter, 2013, 9, 8096–8106 RSC
- R. M. Erb, J. Segmehl, M. Charilaou, J. F. Loffler and A. R. Studart, Soft Matter, 2012, 8, 7604–7609 RSC
- S. Kantorovich, E. Pyanzina and F. Sciortino, Soft Matter, 2013, 9, 6594–6603 RSC
- S. C. Glotzer and M. J. Solomon, Nat. Mater., 2007, 6, 557–562 CrossRef PubMed
- J. Yan, K. Chaudhary, S. C. Bae, J. A. Lewis and S. Granick, Nat. Commun., 2013, 4, 1516 CrossRef PubMed
Footnote |
| † Electronic supplementary information (ESI) available: Supplementary Movies 1–6. See DOI: 10.1039/c4sm01962h |
| This journal is © The Royal Society of Chemistry 2015 |