
 Open Access Article
 This Open Access Article is licensed under a
 Creative Commons Attribution 3.0 Unported Licence
Predicting finite-temperature properties of crystalline carbon dioxide from first principles with quantitative accuracy†
Yonaton N.
Heit
,
Kaushik D.
Nanda‡
and
Gregory J. O.
Beran
 *
*
Department of Chemistry, University of California, Riverside, California 92521, USA. E-mail: gregory.beran@ucr.edu; Tel: +1-951-827-7869
First published on 29th September 2015
Abstract
Molecular crystal structures, thermodynamics, and mechanical properties can vary substantially with temperature, and predicting these temperature-dependencies correctly is important for many practical applications in the pharmaceutical industry and other fields. However, most electronic structure predictions of molecular crystal properties neglect temperature and/or thermal expansion, leading to potentially erroneous results. Here, we demonstrate that by combining large basis set second-order Møller–Plesset (MP2) or even coupled cluster singles, doubles, and perturbative triples (CCSD(T)) electronic structure calculations with a quasiharmonic treatment of thermal expansion, experimentally observable properties such as the unit cell volume, heat capacity, enthalpy, entropy, sublimation point and bulk modulus of phase I crystalline carbon dioxide can be predicted in excellent agreement with experiment over a broad range of temperatures. These results point toward a promising future for ab initio prediction of molecular crystal properties at real-world temperatures and pressures.
1 Introduction
Moving beyond 0 K to predict molecular crystal structures and properties at finite temperatures represents the next frontier in modeling organic materials. Instead of predicting a multitude of potential crystal polymorphs at 0 K, can we tell a pharmaceutical chemist if the desired drug formulation is thermodynamically favored at room temperature? Or can we predict the polymorphic phase diagram over a broad range of temperatures and pressures? The unexpected appearance of a new, more stable polymorph of a drug can have dire consequences for its stability or bioavailability, sometimes even forcing the drug's removal from the market until a new formulation can be developed.1–3When manufacturing a drug tablet, the rapid decompression which occurs immediately after compaction of the drug powder can lead to a variety of defects or even catastrophic failure of the tablet.4 Mechanical properties like the Young's modulus and the bulk modulus of a molecular crystal provide important insights into the bulk behavior of pharmaceutical powders during the tabletting process.5–7 Given that such mechanical properties can exhibit sizable temperature dependence, can we predict them at the relevant temperatures?
Crystal structure prediction has undergone rapid advances over the past several decades, with a number of successful predictions in the blind tests of crystal structure prediction,8–13 improved optimization algorithms14–22 for identifying stable crystal packing motifs, and major advances in dispersion-corrected density functional theory (DFT)23–31 and fragment-based electronic structure methods32–45 that enable the routine application of high-accuracy quantum mechanical methods to organic crystals. Molecular crystal lattice energies can now be predicted to within sub-kJ mol−1 accuracy in certain cases,39 or within a few kJ mol−1 more routinely.25,26,30,31,41,46
The next generation of molecular crystal modeling needs to move beyond 0 K lattice energies and structures, and predict crystal structures and properties at the finite temperatures and pressures where most real-world experimental applications occur. Progress in this direction has already been made. For example, DFT studies of high-pressure molecular crystal phases have become routine, and Hirata and co-workers have recently predicted the phase boundary for phase I and phase III carbon dioxide with second-order Møller–Plesset perturbation theory (MP2).33,34 They have also used similar calculations to simulate various properties and spectroscopic features in ice,47,48 carbon dioxide,35,49 and other systems.33 Reilly and Tkatchenko used harmonic free energy estimates with many-body dispersion-corrected density functional theory to rationalize the experimental preference for form I aspirin over form II.50 However, most such studies, particularly those based on ab initio methods beyond DFT, rely on structures optimized without consideration of temperature. The volume of a molecular crystal unit cell often expands by several percent between 0 K and room temperature, with substantial impacts on many crystal properties.
Capturing these finite temperature effects is challenging. Molecular dynamics and Monte Carlo simulations provide a conceptually straightforward means of accessing these finite-temperature properties that has proved effective for studying organic crystal free energies/phase diagrams,19,20,51–54 and nucleation/growth55–58 at the force field level. However, achieving the requisite accuracy in larger, non-rigid molecules with force fields remains a major challenge. On the other hand, the comparatively high computational cost of more accurate electronic structure methods makes extensive configurational sampling infeasible in most cases.
Instead, we demonstrate here that coupling large-basis second-order MP2 and coupled cluster singles, doubles and perturbative triples (CCSD(T)) electronic structure calculations with the quasi-harmonic approximation enables one to predict a wide variety of properties of crystalline carbon dioxide (phase I) with unprecedented accuracy. The quasi-harmonic approximation has a long-history in materials modeling, but to our knowledge, this study represents the first time it has been combined with electronic structure calculations that approach the ab initio limit for molecular crystals.
Carbon dioxide is much smaller than typical organic compounds, of course. It also exhibits weaker many-body interactions than many larger and/or polar molecules. Nevertheless, it makes an excellent test case for several reasons: a wealth of experimental data exists against which the predictions can be tested, its small molecular size makes it feasible to assess the accuracy that can be obtained with calculations which approach the ab initio limit, and it has also been the subject of many earlier DFT59–62 and smaller-basis MP2 studies.34,35,49
We show that extrapolated complete basis set MP2 and CCSD(T) calculations predict the crystal volume within 2%, the heat capacity within 0.2R (<5% for T = 50–190 K), the sublimation enthalpy within 1.5 kJ mol−1, and the sublimation entropy within 2 J mol−1 K−1 (2%), all over a temperature range spanning 200 K. CCSD(T) predicts the sublimation point of dry ice (194.7 K) to within 6 K. In contrast to previous difficulties in modeling the bulk modulus of crystalline CO2,35 we predict both its magnitude and temperature dependence in excellent agreement with experiment. Overall, the ability to achieve quantitative accuracy for a broad spectrum of molecular crystal properties in phase I carbon dioxide provides much cause for optimism in the future extension of finite-temperature predictions to larger, more chemically interesting species.
2 Theory and methods
The structure of phase I carbon dioxide at a given temperature T and pressure P was predicted by minimizing the Gibbs free energy G(T, P) = Uel + PV + Fvib(T) with respect to both the atomic positions in the unit cell and the unit cell parameters. Here, Uel is the internal electronic energy, PV is the pressure–volume contribution, and Fvib represents the Helmholtz vibrational free energy contribution. The phonon frequencies were estimated as a function of the crystal volume using the quasiharmonic approximation (QHA).The electronic energy and phonons were computed using the fragment-based hybrid many-body interaction (HMBI) model,40,41,63,64 which allows one to perform high-level MP2 or coupled cluster calculations on periodic systems like molecular crystals with reasonable computational cost. HMBI decomposes the intermolecular interactions in a crystal according to a many-body expansion,
| Uel = EQM1-body + EQMSR 2-body + EMMLR 2-body + EMMmany-body | (1) |
The important intramolecular (1-body) and short-range pairwise (SR 2-body) interactions were treated with quantum mechanics (QM), while the generally weaker long-range pairwise (LR 2-body) and many-body contributions in eqn (1) were approximated with the Amoeba polarizable molecular mechanics (MM) force field. In practice, the short-range 2-body QM treatment includes interactions involving molecules in the unit cell and in nearby periodic image cells, while the MM terms capture the long-range periodicity of the crystal via Ewald summation.
The harmonic phonons used to evaluate Fvib were computed on a 3 × 3 × 3 Monkhorst–Pack grid in a 3 × 3 × 3 supercell. Fragment methods like HMBI enable lattice dynamic calculations at many k points in reciprocal space with trivial additional effort beyond the Γ-point-only phonons.32,65 The Grüneisen parameters were computed via finite difference.26
Substantial computational savings were obtained by exploiting the Pa![[3 with combining macron]](https://www.rsc.org/images/entities/char_0033_0304.gif) space group symmetry of phase I CO2 throughout.66 Symmetry reduces the number of two-body dimer calculations required from ∼100 to 5–9 (depending on the pressure). It also reduces the number of degrees of freedom in the geometry optimization from 42 to two: the lattice constant a and the C
space group symmetry of phase I CO2 throughout.66 Symmetry reduces the number of two-body dimer calculations required from ∼100 to 5–9 (depending on the pressure). It also reduces the number of degrees of freedom in the geometry optimization from 42 to two: the lattice constant a and the C![[double bond, length as m-dash]](https://www.rsc.org/images/entities/char_e001.gif) O bond length.
O bond length.
All QM contributions were calculated with either density-fitted MP2 (ref. 67–70) or CCSD(T)71,72 in the Dunning aug-cc-pVXZ basis sets (abbreviated as aXZ here)73,74 using Molpro 2012.75,76 A counterpoise correction for basis set superposition error77 was employed for each two-body dimer calculation. The energies, gradients, and Hessian elements were all extrapolated to the complete basis set (CBS) limit using a two-point TQ extrapolation of both the Hartree–Fock78 and correlation energy contributions.79 Energies and gradients at the CCSD(T)/CBS limit were estimated by correcting the MP2/CBS limit values with the difference between CCSD(T) and MP2, ΔCCSD(T) ≈ CCSD(T) − MP2, computed in the aug-cc-pVDZ basis set. MP2 phonons were used to evaluate Fvib in the CCSD(T) calculations. The MM contributions in eqn (1) were computed using the Amoeba force field and Tinker 6.3.80 Intermolecular force field parameters for CO2 were generated using Poltype version 1.1.3.81
Once the crystal structures were obtained as a function of temperature and pressure, various thermodynamic properties were computed using standard expressions from statistical mechanics. Ideal gas behavior was assumed for the vapor phase. Additional methodological details are provided in the ESI.†
The relative rigidity and lack of many-body polarization effects makes carbon dioxide a good candidate for simple, fixed charge force field models, though the importance of many-body dispersion effects has been noted.82 For comparison with the electronic structure results, the predictions here were repeated using the empirical CO2 potential of Cygan and co-workers.83 This flexible, three-point model includes standard harmonic stretch and bend terms, point-charge electrostatics, and Lennard-Jones dispersion/repulsion terms. It was particularly parameterized to reproduce vibrational spectra, which should help it capture the phonon contributions. The carbon dioxide quadrupole moment also proves important for modeling its solid state,84 and the point charges in this force field generate a molecular quadrupole of −4.22 D Å, in good agreement with the experimental value of −4.27 ± 0.18 D Å.85 Additional test calculations with the TraPPE force field,86 which uses the same functional form but slightly different empirical parameters, produced similar results (not presented here). Of course, many other CO2 potentials exist, and a more elaborate or physical potential (e.g.ref. 87) might perform better than the particular one chosen here.
3 Results and discussion
The next sections compare the predicted and experimental values for thermal expansion, thermodynamic properties, and the bulk modulus. All predicted values plotted in figures here are tabulated in the ESI.†3.1 Thermal expansion
To begin, we predict the thermal expansion of the CO2 lattice at atmospheric pressure by optimizing the quasiharmonic Gibbs free energy at a series of different temperatures. At 1 atm, the PV term only contributes ∼0.01 kJ mol−1 to the overall energy, so it was neglected here. Fig. 1 compares these predictions against experimental results from Manzhelii et al.,88 Krupskii et al.,89 and the low-temperature fit (20–114 K) of Keesom and Köhler.90,91 In a small aug-cc-pVDZ basis set, MP2 substantially underbinds the crystal, leading to a substantial over-estimation of the unit cell volume. As we approach the complete-basis-set (CBS) limit, however the MP2 prediction improves dramatically, with MP2/CBS underestimating the cell volume by only 2–3%. Fortuitously, the slightly smaller aug-cc-pVQZ basis performs even better, with predicted volumes lying within ∼0.5% of experiment.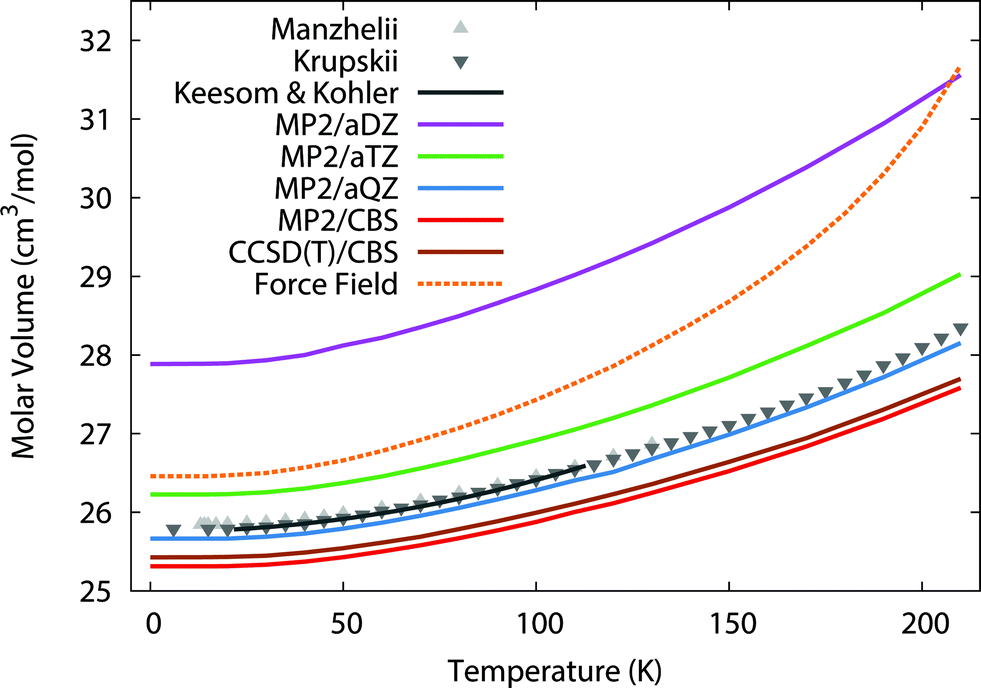 | ||
| Fig. 1 Predicted thermal expansion of the CO2(s) unit cell compared to the experimental values88–91 in gray. | ||
The errors are nearly constant across the entire temperature range. For instance, MP2/CBS underestimates the volume by 0.5 cm3 mol−1 (2%) at low temperatures, and this error increases to only 0.7 cm3 mol−1 (3%) at the sublimation point (194.7 K). Most of the error is present already in the lowest temperature results, which suggests it largely stems from the underlying fragment-based electronic structure treatment, rather than from the quasiharmonic approximation. The treatment of phonon dispersion via lattice dynamics is also important here. Using Γ-point frequencies only causes the model to underestimate the rate of thermal expansion noticeably (see ESI†).
One might hope to obtain further improvements by moving beyond second-order perturbation theory to the CCSD(T) level. However, previous work indicates that correlation energy contributions beyond second-order perturbation theory are small in crystalline CO2, with the lattice energy shifting by only ∼0.3 kJ mol−1 between MP2 and CCSD(T).41 Here, refining the thermal expansion predictions at the CCSD(T)/CBS level (with the free energy computed as the sum of CCSD(T) internal energies and MP2 vibrational free energy contributions) reduces the errors by only 0.1 cm3 mol−1. Nevertheless, these results show that large-basis electronic structure calculations plus the quasiharmonic approximation model the temperature dependence of the carbon dioxide unit cell volume very reliably all the way up to the sublimation point.
For comparison, the force field potential performs quite well at low temperature, predicting a cell volume that is roughly on par with the MP2/aug-cc-pVTZ calculation with orders of magnitude lower computational cost. However, as the temperature increases, the force field model expands the crystal volume much too rapidly.
3.2 Thermodynamic properties
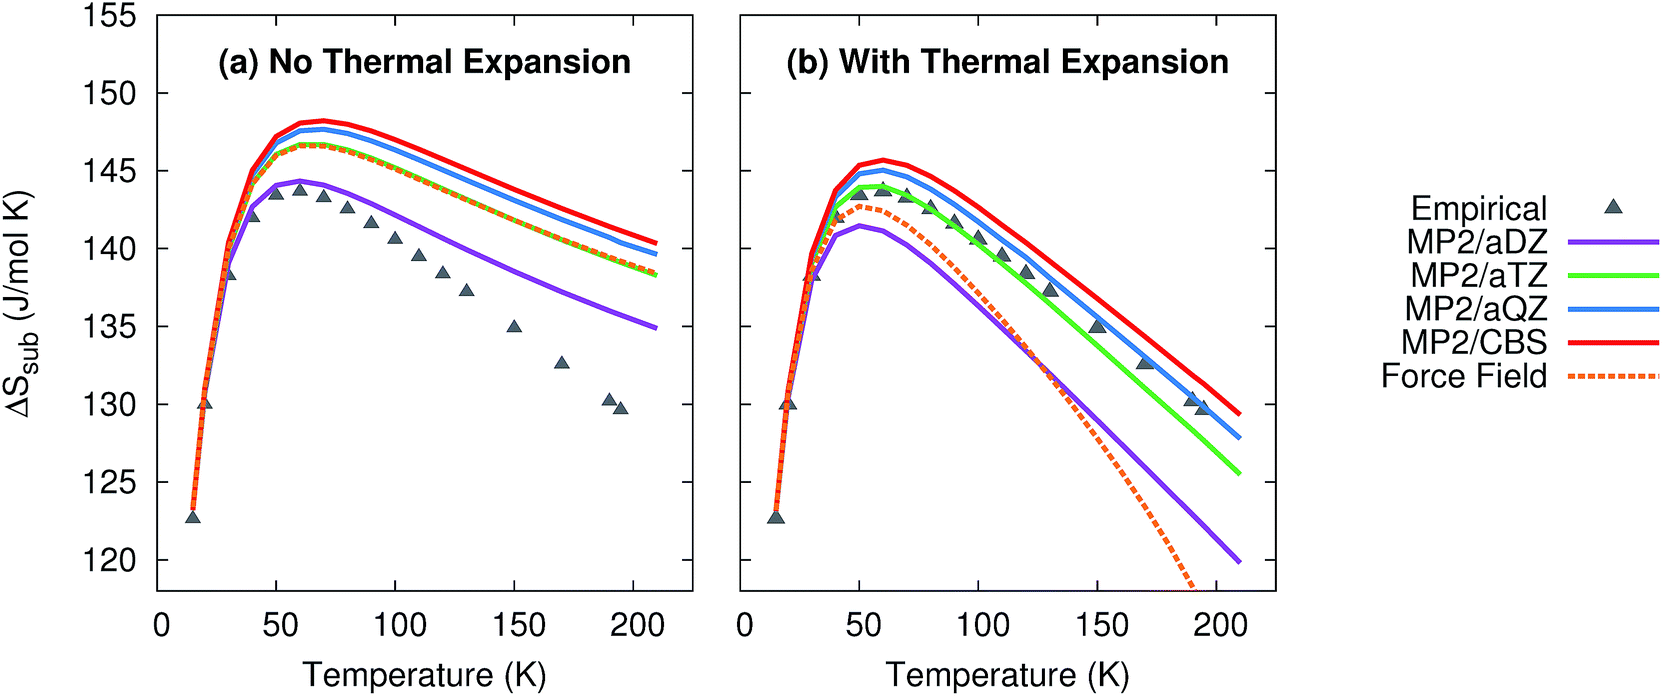
Given the excellent treatment of thermal expansion, we next investigate the model's ability to predict thermodynamic properties such as the heat capacity and the enthalpies and entropies of sublimation. Such properties are critical to determining polymorph stability at finite temperatures. For each of these properties, predictions were made with and without the thermal expansion provided by the quasiharmonic approximation.Fig. 2 plots the enthalpy of sublimation at 1 atm relative to the experimentally-derived ΔHsub determined by Azreg-Aïnou.92 Azreg-Aïnou derived these values using fits to the experimentally observed heat capacity and vapor pressure data, ideal gas partition functions, various small corrections for gas imperfection, and other details.
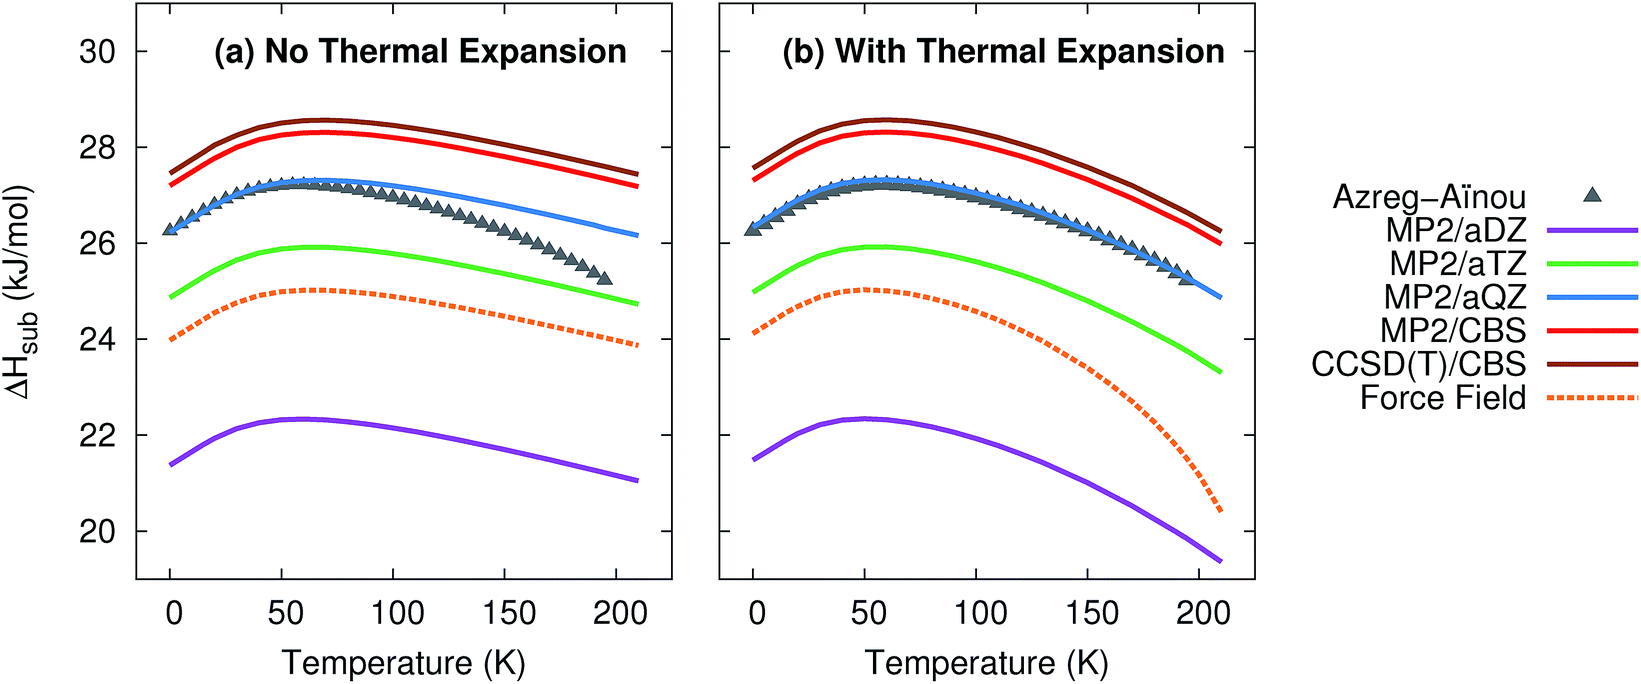 | ||
| Fig. 2 Predicted enthalpies of sublimation at 1 atm (a) neglecting thermal expansion and (b) with quasiharmonic thermal expansion, relative to the empirical data of Azreg-Aïnou.92 | ||
The sublimation enthalpy is dominated by the crystal lattice energy. The zero-point and thermal enthalpy corrections account for only ∼10% (at low temperature) to ∼25% or more (at the sublimation point) of the total sublimation enthalpy. Accordingly, the sublimation enthalpy should behave similarly to the lattice energy with regard to the basis set: small-basis MP2 underestimates the CO2 lattice energy significantly, but using large basis sets mostly corrects this error.40,41 As expected, small basis sets predict a sublimation enthalpy that is too small, while MP2/aug-cc-pVQZ fortuitously predicts a sublimation enthalpy in almost perfect agreement with experiment. Extrapolating to the complete-basis-set limit produces a sublimation enthalpy that overestimates the experimental value by only 1.0–1.1 kJ mol−1. CCSD(T)/CBS binds crystalline CO2 slightly more,41 which increases the sublimation enthalpy further, to a value 1.3–1.4 kJ mol−1 too large. This accuracy is near the limit of what is achievable with modern electronic structure theory. Errors in the lattice energy of 1–2 kJ mol−1 represent a best-case scenario for practical molecular crystal calculations,39,41 while errors of several kJ mol−1 are more typical.25,26,30,31,46
Fig. 2 also highlights how the approximate treatment of anharmonicity and thermal expansion via the quasiharmonic approximation proves essential to capturing the proper temperature dependence above 50 K. Without the quasiharmonic approximation, the theoretical calculations substantially overestimate the sublimation enthalpy at higher temperatures. When the quasiharmonic approximation is employed, however, the calculations obtain the correct curvature across a 200 K temperature range. Both the MP2/CBS and CCSD(T)/CBS results predict the maximum in the sublimation enthalpy at 59 K, in excellent agreement with the 58.829 K reported by Azreg-Aïnou.92
Once again, the force field model used here performs almost as well as the MP2/aug-cc-pVTZ results at low temperatures or when thermal expansion is neglected. However, the exaggerated thermal expansion seen in Fig. 1 is reflected in poor prediction of the sublimation enthalpy at warmer temperatures.
Given the high accuracy of the MP2 and CCSD(T) sublimation enthalpy predictions as a function of temperature, it is not surprising that the isochoric heat capacity, CV, is also predicted reliably (Fig. 3). Note that CCSD(T) results are not provided because CCSD(T) phonons are unavailable.† For the heat capacity, all models perform fairly well. Neglecting thermal expansion fortuitously causes small aug-cc-pVDZ basis MP2 to out-performs what should be the more accurate large basis calculations relative to the experimental values of Krupskii et al.89 and Manzhelii et al.88 When thermal expansion is included, on the other hand, the accuracy of the predictions does improve with increasing basis set, as one generally expects.
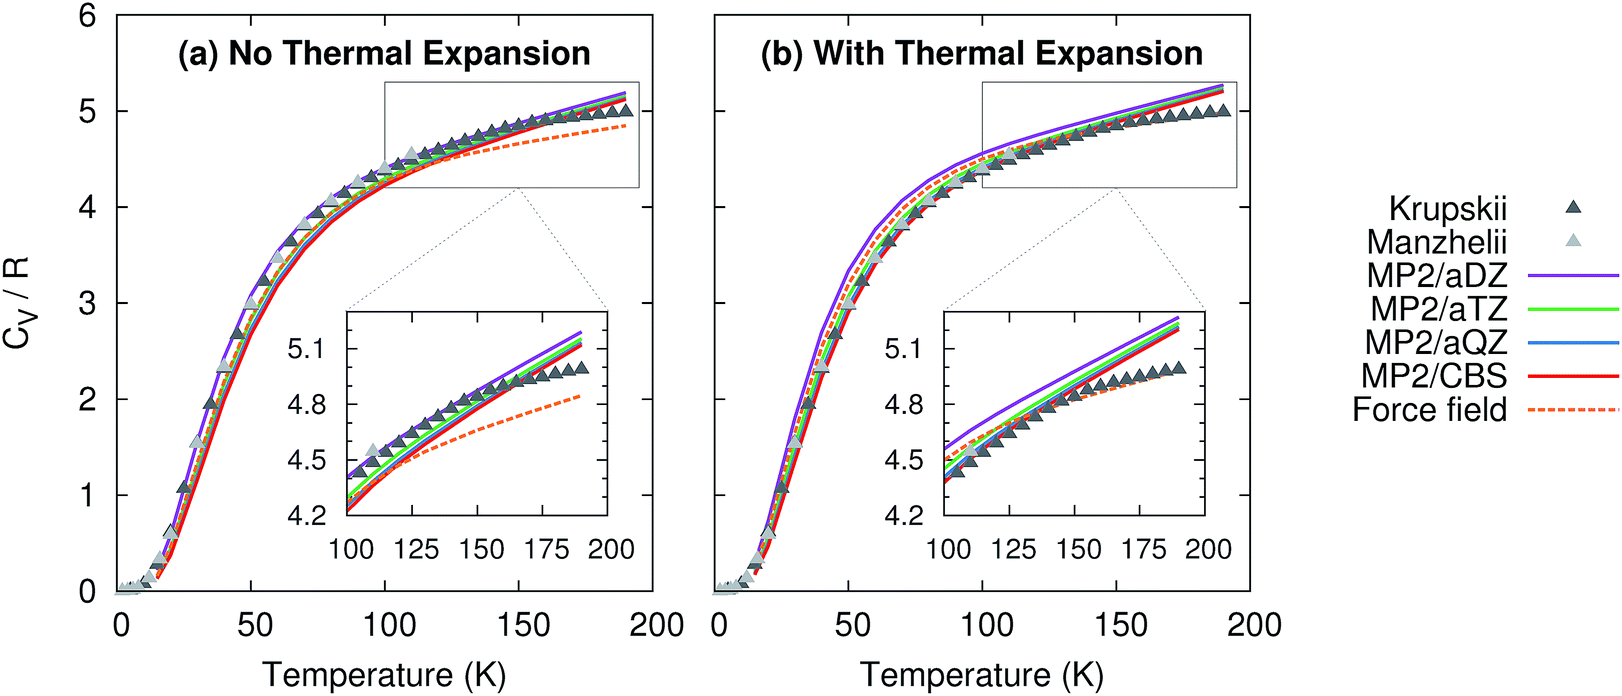 | ||
| Fig. 3 Predicted isochoric heat capacity (a) neglecting thermal expansion and (b) with quasiharmonic thermal expansion relative to the experimental data of Krupskii et al.89 and Manzhelii et al.88 | ||
Similar to previously published small-basis MP2 results,35 we find that MP2 underestimates the heat capacity slightly at low temperature. Errors of 1–1.5 J mol−1 K−1 (0.1–0.2R) are observed below 50 K. However, the results here perform better than the earlier MP2 ones at moderate temperatures (e.g. ∼50–150 K), with errors typically well below 1 J mol−1 K−1 (0.1R) in the range 50–150 K. At higher temperatures, the predictions begin to deviate more noticeably from the experimental data, probably due to increased anharmonicity in the phonons. This suggests that one might expect larger deviations from the correct temperature-dependence of the sublimation enthalpy at higher temperatures. Nevertheless, on the whole, MP2 predicts the heat capacity accurately across a fairly wide temperature range.
For comparison, the force field model behaves similarly to MP2/aug-cc-pVDZ and aug-cc-pVTZ at low and intermediate temperatures, but it asymptotes more quickly than the MP2 heat capacities at higher temperatures. This actually leads to a slightly better prediction of the heat capacity near 200 K when thermal expansion is included. Of course, this result is somewhat fortuitous, given the problems seen earlier in the volume and sublimation enthalpy.
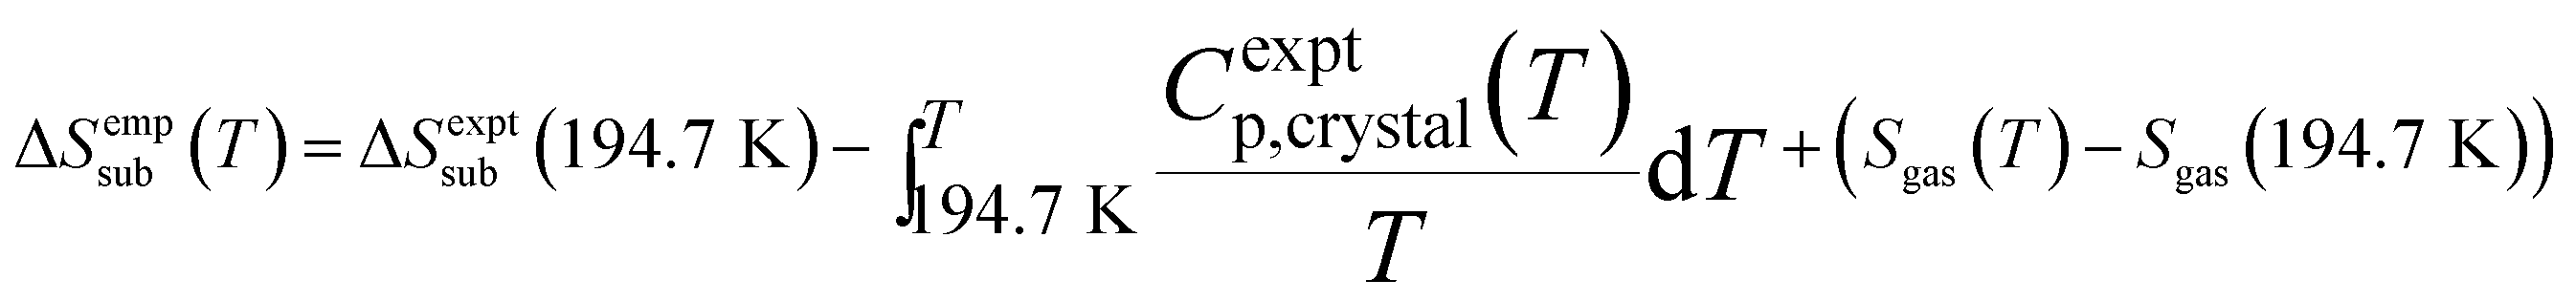
Entropy also plays a critical role in phase stability. The entropy of sublimation at the sublimation point (T = 194.7 K) is well-known,93 but we are not aware of any existing tabulation of the experimental sublimation entropy as a function of temperature. Accordingly, we derived an empirical sublimation entropy from existing experimental data according to:
 | (2) |
This expression relates the sublimation entropy at a given temperature to the experimental value at 194.7 K plus corrections for how the entropies of the crystal and the gas change as a function of temperature. The changes in the entropy of the crystal were computed via integration of the experimental isobaric heat capacities,93 while the gas contributions were evaluated using ideal gas partition functions and the experimentally determined rotational constant94 and vibrational frequencies.95 See the ESI† for details.
As shown in Fig. 4, the quasiharmonic treatment of thermal expansion proves critical to obtaining the correct temperature dependence of the entropy. Without thermal expansion, MP2/CBS overestimates the sublimation entropy above 50 K by up to 9%. In contrast, including thermal expansion dramatically reduces the errors, predicting the sublimation entropy to within 1–2% throughout the 200 K temperature range. For comparison, without thermal expansion, the force field mimics MP2/aug-cc-pVTZ. However, once thermal expansion is included, the force field predicts an entropy of sublimation that decreases much too rapidly at higher temperatures.
 | ||
| Fig. 4 Predicted entropies of sublimation at 1 atm (a) neglecting thermal expansion and (b) with quasiharmonic thermal expansion, relative to the data empirically derived from experiment. | ||
Finally, the sublimation point can be predicted by combining the enthalpy and entropy of sublimation to determine the temperature where ΔGsub = 0. As shown in Table 1, small aug-cc-pVDZ basis MP2 calculations underestimate the sublimation temperature by 30 K. Increasing the basis set, however, allows one to predict the experimental sublimation temperature of 194.7 K within 5 K (MP2/CBS) or 6 K (CCSD(T)/CBS) when thermal expansion is included. The CCSD(T) enthalpy and entropy of sublimation at 194.7 K are predicted to within 1.4 kJ mol−1 (6%) and 1.9 J mol−1 K−1 (1%), respectively.
| No thermal expansion | With thermal expansion | |||||
|---|---|---|---|---|---|---|
| T sub (K) | ΔHsub (194.7 K) (kJ mol−1) | ΔSsub (194.7 K) (J mol−1 K−1) | T sub (K) | ΔHsub (194.7 K) (kJ mol−1) | ΔSsub (194.7 K) (J mol−1 K−1) | |
| a Using MP2/CBS frequencies and thermal contributions. b Identical to the MP2/CBS value. | ||||||
| Force field | 172.9 | 24.0 | 139.2 | 183.4 | 21.5 | 116.9 |
| MP2/aug-cc-pVDZ | 157.1 | 21.2 | 135.7 | 163.6 | 19.8 | 122.2 |
| MP2/aug-cc-pVTZ | 178.9 | 24.9 | 139.3 | 185.3 | 23.7 | 127.8 |
| MP2/aug-cc-pVQZ | 187.1 | 26.3 | 140.6 | 193.4 | 25.3 | 130.0 |
| MP2/CBS | 193.2 | 27.3 | 141.4 | 199.2 | 26.0 | 131.5 |
| CCSD(T)/CBSa | 194.9 | 27.6 | 201.0 | 26.6 | ||
| Giauque and Egan93 | 194.7 | 25.2 | 129.6 | |||
If one neglects thermal expansion, CCSD(T)/CBS predicts a sublimation temperature of 194.9 K, which agrees almost perfectly with the experimental temperature. However, this accuracy results from fortuitous error cancellation—the ΔHsub and ΔSsub values at 194.7 K are both 9–10% too large. The force field predicts sublimation temperature of 172.9 K without thermal expansion, or 183.4 K with thermal expansion. As before, these values are similar to those obtained from MP2/aug-cc-pVTZ. One should note, however, that in the case where thermal expansion is included, the force field enthalpy and entropy of sublimation are both underestimated considerably to produce the relatively good estimate for the sublimation temperature.
Once again, these sublimation point predictions reiterate the importance of modeling thermal expansion. More importantly, they hint toward a future where high-quality ab initio prediction of phase diagrams as a function of both temperature and pressure may be routine.
3.3 Bulk modulus
Mechanical properties like the bulk modulus are also of considerable interest for many applications. To obtain the bulk modulus, one typically measures the crystal volume as a function of pressure, and then fits the resulting data to an equation of state, treating the isothermal bulk modulus at zero pressure (B0), its first pressure derivative (B′0), and the unit cell volume at zero pressure (V0) as adjustable parameters. Many equations of state exist, including the third-order Birch–Murnaghan96 and Vinet97 equations. Non-linear least squares fits to these equations of state can be problematic, with the resulting fit parameters being ill-constrained (i.e. a wide range of parameters produce comparably good fits) and highly correlated.98,99 The resulting parameters depend strongly on the reference volume at zero pressure (V0), especially when using the Birch–Murnaghan equation of state.98 This challenge is particularly acute at room temperature, where crystalline carbon dioxide does not exist at zero pressure, and V0 must be obtained via extrapolation from finite-pressure volumes. Hence, considerable uncertainty surrounds the experimental bulk modulus parameters for CO2.88,89,98–104Theory can predict the pressure–volume data at a given temperature to fit the equation of state, and it can predict the zero-pressure unit cell volume V0via direct geometry optimization. This latter feature enables one to validate the V0 obtained in a fit or even constrain V0, if necessary, in order to extract B0 and B′0. Previous theoretical studies have predicted a variety of bulk modulus values,35,59,60,62 though the difficulty in computing these parameters reliably has been noted.35 These earlier studies either neglected thermal expansion35,59,62 or omitted van der Waals dispersion,59,60 which is significant for CO2.49,62 Here, we demonstrate that the combination of high-level electronic structure calculations and a quasiharmonic treatment predicts B0 and B′0 in excellent agreement with the best experimental values across a wide range of temperatures.
Pressure versus volume curves were calculated by optimizing the crystal geometry under a series of external pressures ranging from 0–10 GPa (0–20 GPa for 296 K) at 0 K, 130 K, 190 K, and 296 K under the quasiharmonic approximation. Analogous calculations were also performed at 0 K without the quasiharmonic vibrational contribution Fvib. As a representative example, Fig. 5 compares the experimental and room-temperature MP2/CBS predicted pressure versus volume curves with and without the inclusion of quasiharmonic thermal expansion. Inclusion of thermal expansion proves critical to reproducing the experimental pressure/volume data. Differences between the curves with and without thermal expansion persist even at 20 GPa, where one might have hoped that the high external pressure would obviate the need to treat thermal expansion.
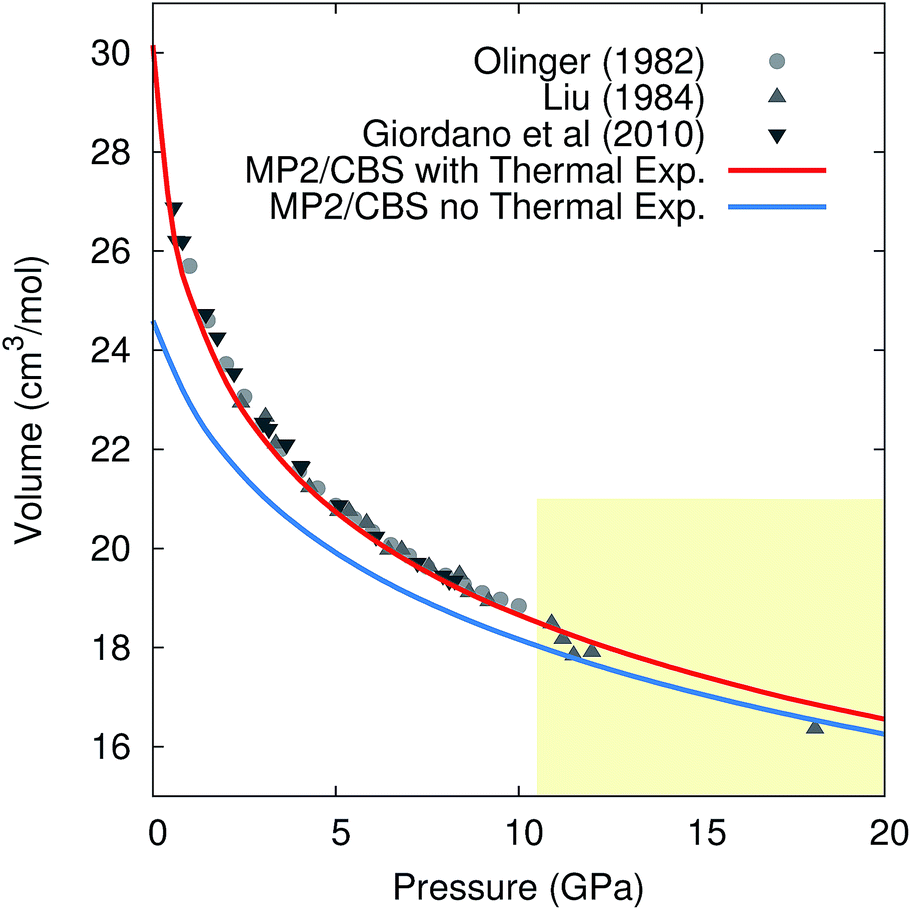 | ||
| Fig. 5 Comparison of the experimental and predicted MP2/CBS pressure versus volume curves at 296 K, with and without quasiharmonic thermal expansion. Note that the drop in the experimental volumes above 10 GPa (shaded region) is believed to reflect a transition to phase III,105 while the calculations presented are for phase I throughout. | ||
For each temperature and level of theory, the values of V0, B0, and B′0 were extracted via non-linear least squares fitting to the Vinet equation of state,
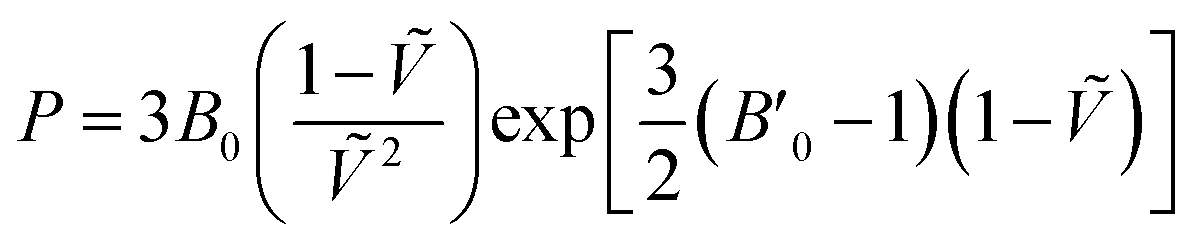 | (3) |
Fig. 6 compares the predicted values of B0 and B′0 obtained here to previously reported theoretical and experimental values. Without the quasiharmonic approximation, the bulk modulus parameters obtained here are similar to earlier predictions using MP2/aug-cc-pVTZ by Li and co-workers35 and various dispersion-corrected density functional calculations.62 However, the bulk modulus shrinks several-fold upon heating to room temperature, and the treatment of thermal expansion provided by the quasiharmonic approximation is required to capture that.
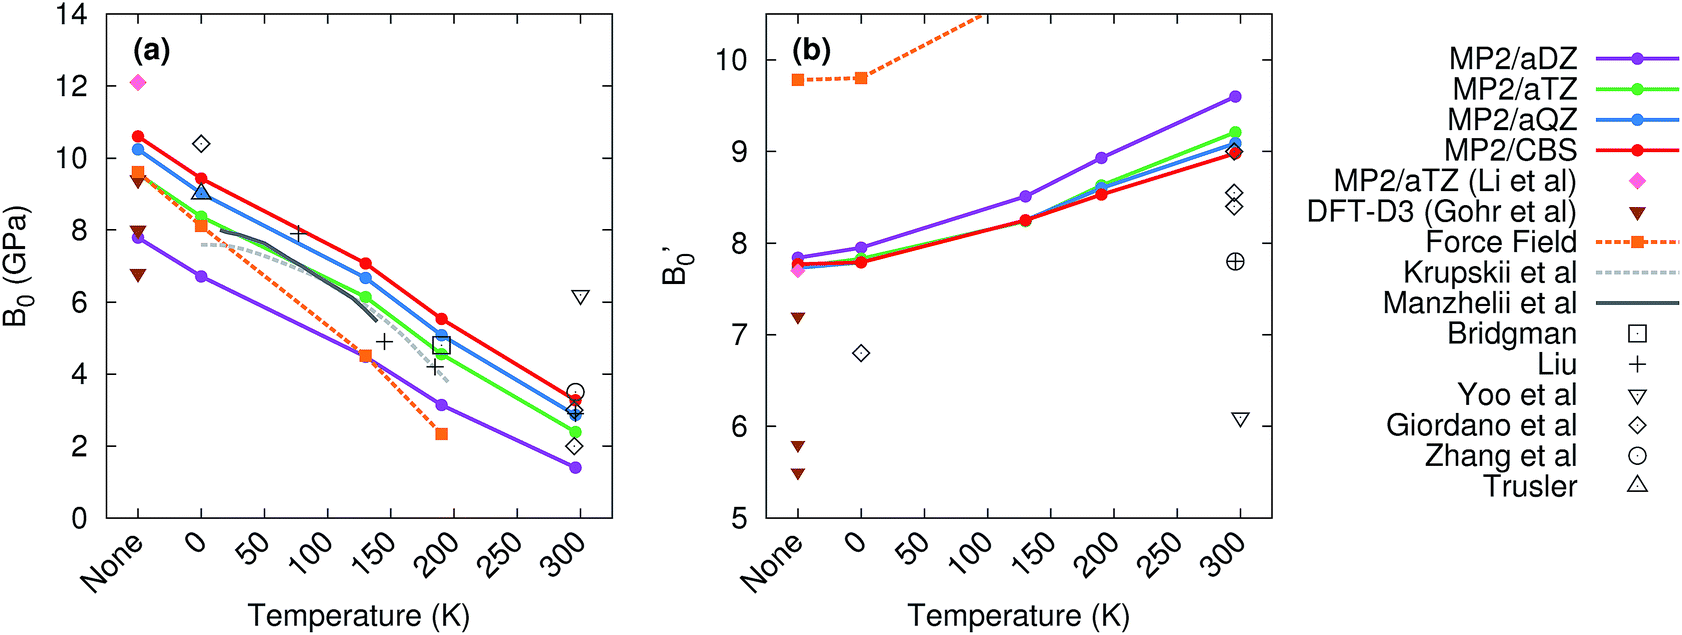 | ||
| Fig. 6 Experimental (gray) and predicted (colored) values of the (a) bulk modulus B0 and (b) its first pressure derivative B′0. The label ‘‘none’’ in the figures refers to calculations which neglect temperature and the quasiharmonic approximation entirely. | ||
Basis set effects are also fairly important for the bulk modulus—the MP2 B0 value increases by 30–130% (depending on temperature) from a small aug-cc-pVDZ basis to the complete basis set limit. The pressure derivative B′0 is less sensitive to basis set. Correlation beyond second-order perturbation theory proves relatively unimportant here. At 190 K, switching from MP2 to CCSD(T) increases V0 by 0.1 cm3 mol−1, increases B0 by 0.2 GPa, and does not alter B′0 (see Table S2 in the ESI†).
The experimental bulk modulus data exhibits considerable scatter, but the bulk moduli B0 predicted here are consistent with most of the literature data across all temperatures (Fig. 6). Less experimental data exists for the first-pressure derivative B′0, but values predicted here are in good agreement with the available experimental ones. MP2/CBS overestimates the reported room temperature experimental values of B′0 by 5–15%, but the predicted value lies within the typical experimental error bars. For instance, the MP2/CBS predictions of B0 = 3.3 GPa and B′0 = 9.0 at 296 K are in excellent agreement with the Vinet equation of state fit by Giordano et al.,99 which found B0 = 3 ± 1 GPa and B′0 = 8.4 ± 0.8. The MP2 predictions are also consistent with the Vinet fits to the Olinger101 and Liu98 experimental P–V curves reported by Giordano et al.,99 which exhibit even larger uncertainties. Moreover, the MP2 predictions compare well with experimental bulk modulus values at other temperatures, including those from Krupskii et al.,89 Manzhelii et al.,88 Bridgman,100 Liu,98 and Trusler.103
The experimentally obtained B0 = 6.2 GPa and B′0 = 6.1 values at 300 K reported by Yoo et al.102 are considerable outliers with respect to both our theoretical predictions and the other experimental values. Ref. 102 provides few details of the data or fitting procedure used for phase I, but their reported zero-pressure volume V0 = 25.1 cm3 mol−1 is substantially smaller than the values of ∼30 ± 2 cm3 mol−1 found by Giordano et al.,99 31.4 cm3 mol−1 inferred by Liu,98 and 30.1 cm3 mol−1 predicted by MP2/CBS geometry optimization. In fact, their room-temperature V0 is smaller than the experimental volume of 25.8 cm3 mol−1 at 6 K.89 Therefore, these bulk modulus values probably reflect a spurious fit to the experimental data.
For comparison, the force field predicts a reasonable bulk modulus without temperature or at 0 K (where only zero-point effects are included), but it exaggerates the thermal expansion and predicts that the bulk modulus decreases much more rapidly with temperature than experiments or the MP2 calculations indicate. Similarly, the first pressure derivative of the bulk modulus is overestimated and increases too quickly with temperature in the force field model. Note too that at 296 K, the CO2 crystal proved unbound with the force field model, and no reasonable fit could be found to the Vinet equation of state.
In the end, the electronic structure results here demonstrate that theory can provide a powerful tool for predicting properties such as the bulk modulus, which can be difficult to extract reliably from experiment. The calculations here provide support for the room-temperature bulk moduli obtained by Giordano et al. and others, while simultaneously suggesting that some reported values are unlikely. Furthermore, theory can be used to identify a plausible experimental zero-pressure volume, which is often a key step in extracting bulk modulus parameters from experiment. Finally, the treatment of thermal expansion proves critical to predicting the correct the temperature-dependence of the bulk modulus parameters.
4 Conclusions
In summary, we are rapidly transitioning into an era where electronic structure theory can directly predict a wide range of experimentally observable molecular crystal properties under practical temperature and pressure conditions. As shown here, the combination of accurate electronic structure theory calculations and a quasiharmonic treatment of thermal expansion enables one to predict crystal structures, thermodynamics, and mechanical properties for phase I carbon dioxide in excellent agreement with experiment. While the simple force field considered here behaves very well at low temperatures and predicts results on roughly par with those from MP2/aug-cc-pVTZ, the electronic structure calculations provide substantially improved agreement with experiment at higher temperatures.The performance of the quasiharmonic approximation seen here does start to degrade at higher temperatures, so it remains to be seen how well it performs in larger crystals which are stable at room temperature and above. Still, the excellent performance seen here up to 200 K (or room temperature for the bulk modulus) for carbon dioxide provides considerable cause for optimism. Of course, the increased anharmonicity found in larger, more flexible organic molecules will also create new challenges for the simple quasiharmonic approximation used here.
The quantum mechanical calculations here are made feasible by fragment-based electronic structure methods, which make MP2 and even coupled cluster calculations computationally affordable for molecular crystals. Although the extrapolated complete-basis MP2 and CCSD(T) calculations employed on CO2 here would be much more computationally challenging for a pharmaceutical crystal, in many cases one can probably obtain useful predictions using a lower level of theory. MP2/aug-cc-pVTZ already predicts many of the properties in reasonable agreement with experiment, albeit with several-fold less computational effort than the larger-basis results. It may provide a useful level of theory for modeling crystals of larger molecules. Continuing algorithmic developments and decreasing costs of computer hardware will hopefully make finite-temperature predictions on chemically interesting organic molecular crystals routine in the near future.
Acknowledgements
Funding for this work from the National Science Foundation (CHE-1362465) and supercomputer time from XSEDE (TG-CHE110064) are gratefully acknowledged.References
- S. R. Chemburkar, J. Bauer, K. Deming, H. Spiwek, K. Patel, J. Morris, R. Henry, S. Spanton, W. Dziki, W. Porter, J. Quick, P. Bauer, J. Donaubauer, B. A. Narayanan, M. Soldani, D. Riley and K. Mcfarland, Org. Process Res. Dev., 2000, 4, 413–417 CrossRef CAS.
- J. Bauer, S. Spanton, R. Quick, J. Quick, W. Dziki, W. Porter and J. Morris, Pharm. Res., 2001, 18, 859–866 CrossRef CAS.
- A. S. Raw, M. S. Furness, D. S. Gill, R. C. Adams, F. O. Holcombe and L. X. Yu, Adv. Drug Delivery Rev., 2004, 56, 397–414 CrossRef CAS PubMed.
- C.-Y. Wu, B. Hancock, A. Mills, A. Bentham, S. Best and J. Elliott, Powder Technol., 2008, 181, 121–129 CrossRef CAS.
- D. Singhal and W. Curatolo, Adv. Drug Delivery Rev., 2004, 56, 335–347 CrossRef CAS PubMed.
- V. Mazel, V. Busignies, H. Diarra and P. Tchoreloff, J. Pharm. Sci., 2013, 102, 4009–4014 CrossRef CAS PubMed.
- M. Egart, I. Ilic, B. Jankovic, N. Lah and S. Srcic, Int. J. Pharm., 2014, 472, 347–355 CrossRef CAS PubMed.
- G. M. Day, W. D. S. Motherwell, H. L. Ammon, S. X. M. Boerrigter, R. G. Della Valle, E. Venuti, A. Dzyabchenko, J. D. Dunitz, B. Schweizer, B. P. van Eijck, P. Erk, J. C. Facelli, V. E. Bazterra, M. B. Ferraro, D. W. M. Hofmann, F. J. J. Leusen, C. Liang, C. C. Pantelides, P. G. Karamertzanis, S. L. Price, T. C. Lewis, H. Nowell, A. Torrisi, H. A. Scheraga, Y. A. Arnautova, M. U. Schmidt and P. Verwer, Acta Crystallogr., Sect. B: Struct. Sci., 2005, 61, 511–527 CAS.
- G. M. Day, T. G. Cooper, A. J. Cruz-Cabeza, K. E. Hejczyk, H. L. Ammon, S. X. M. Boerrigter, J. S. Tan, R. G. Della Valle, E. Venuti, J. Jose, S. R. Gadre, G. R. Desiraju, T. S. Thakur, B. P. van Eijck, J. C. Facelli, V. E. Bazterra, M. B. Ferraro, D. W. M. Hofmann, M. A. Neumann, F. J. J. Leusen, J. Kendrick, S. L. Price, A. J. Misquitta, P. G. Karamertzanis, G. W. A. Welch, H. A. Scheraga, Y. A. Arnautova, M. U. Schmidt, J. van de Streek, A. K. Wolf and B. Schweizer, Acta Crystallogr., Sect. B: Struct. Sci., 2009, 65, 107–125 CAS.
- M. A. Neumann, F. J. J. Leusen and J. Kendrick, Angew. Chem., Int. Ed., 2008, 47, 2427–2430 CrossRef CAS PubMed.
- D. A. Bardwell, C. S. Adjiman, Y. A. Arnautova, E. Bartashevich, S. X. M. Boerrigter, D. E. Braun, A. J. Cruz-Cabeza, G. M. Day, R. G. Della Valle, G. R. Desiraju, B. P. van Eijck, J. C. Facelli, M. B. Ferraro, D. Grillo, M. Habgood, D. W. M. Hofmann, F. Hofmann, K. V. J. Jose, P. G. Karamertzanis, A. V. Kazantsev, J. Kendrick, L. N. Kuleshova, F. J. J. Leusen, A. V. Maleev, A. J. Misquitta, S. Mohamed, R. J. Needs, M. A. Neumann, D. Nikylov, A. M. Orendt, R. Pal, C. C. Pantelides, C. J. Pickard, L. S. Price, S. L. Price, H. A. Scheraga, J. van de Streek, T. S. Thakur, S. Tiwari, E. Venuti and I. K. Zhitkov, Acta Crystallogr., Sect. B: Struct. Sci., 2011, 67, 535–551 CAS.
- A. V. Kazantsev, P. G. Karamertzanis, C. S. Adjiman, C. C. Pantelides, S. L. Price, P. T. A. Galek, G. M. Day and A. J. Cruz-Cabeza, Int. J. Pharm., 2011, 418, 168–178 CrossRef CAS PubMed.
- J. Kendrick, F. J. J. Leusen, M. A. Neumann and J. van de Streek, Chem.–Eur. J., 2011, 17, 10736–10744 CrossRef CAS.
- B. C. Revard, W. W. Tipton and R. G. Hennig, Top. Curr. Chem., 2014, 345, 181–222 CrossRef CAS PubMed.
- C. W. Glass, A. R. Oganov and N. Hansen, Comput. Phys. Commun., 2006, 175, 713–720 CrossRef CAS.
- Q. Zhu, A. R. Oganov, C. W. Glass and H. T. Stokes, Acta Crystallogr., Sect. B: Struct. Sci., 2012, 68, 215–226 CrossRef CAS PubMed.
- D. C. Lonie and E. Zurek, Comput. Phys. Commun., 2011, 182, 372–387 CrossRef CAS.
- Y. Wang and Y. Ma, J. Chem. Phys., 2014, 140, 040901 CrossRef PubMed.
- P. Raiteri, R. Martonák and M. Parrinello, Angew. Chem., Int. Ed., 2005, 44, 3769–3773 CrossRef CAS PubMed.
- P. G. Karamertzanis, P. Raiteri, M. Parrinello, M. Leslie and S. L. Price, J. Phys. Chem. B, 2008, 112, 4298–4308 CrossRef CAS PubMed.
- A. V. Kazantsev, P. G. Karamertzanis, C. S. Adjiman and C. C. Pantelides, J. Chem. Theory Comput., 2011, 7, 1998–2016 CrossRef CAS.
- H. P. G. Thompson and G. M. Day, Chem. Sci., 2014, 5, 3173–3182 RSC.
- J. van de Streek and M. A. Neumann, Acta Crystallogr., Sect. B: Struct. Sci., 2010, 66, 544–558 CAS.
- S. Grimme, J. Antony, S. Ehrlich and H. Krieg, J. Chem. Phys., 2010, 132, 154104 CrossRef PubMed.
- J. Moellmann and S. Grimme, J. Phys. Chem. C, 2014, 118, 7615–7621 CAS.
- A. Otero-de-la Roza and E. R. Johnson, J. Chem. Phys., 2012, 137, 054103 CrossRef CAS PubMed.
- A. Otero-de-La-Roza, B. H. Cao, I. K. Price, J. E. Hein and E. R. Johnson, Angew. Chem., Int. Ed., 2014, 53, 7879–7882 CrossRef CAS PubMed.
- R. A. DiStasio, O. A. von Lilienfeld and A. Tkatchenko, Proc. Natl. Acad. Sci. U. S. A., 2012, 109, 14791–14795 CrossRef CAS PubMed.
- N. Marom, R. A. DiStasio, V. Atalla, S. Levchenko, A. M. Reilly, J. R. Chelikowsky, L. Leiserowitz and A. Tkatchenko, Angew. Chem., Int. Ed., 2013, 52, 6629–6632 CrossRef CAS PubMed.
- A. M. Reilly and A. Tkatchenko, J. Phys. Chem. Lett., 2013, 4, 1028–1033 CrossRef CAS PubMed.
- A. M. Reilly and A. Tkatchenko, J. Chem. Phys., 2013, 139, 024705 CrossRef PubMed.
- S. Hirata, J. Chem. Phys., 2008, 129, 204104 CrossRef PubMed.
- S. Hirata, K. Gilliard, X. He, J. Li and O. Sode, Acc. Chem. Res., 2014, 47, 2721–2730 CrossRef CAS PubMed.
- J. Li, O. Sode, G. A. Voth and S. Hirata, Nat. Commun., 2013, 4, 2647 Search PubMed.
- J. Li, O. Sode and S. Hirata, J. Chem. Theory Comput., 2015, 11, 224–229 CrossRef CAS.
- S. J. Nolan, P. J. Bygrave, N. L. Allan and F. R. Manby, J. Phys.: Condens. Matter, 2010, 22, 074201 CrossRef CAS PubMed.
- C. R. Taylor, P. J. Bygrave, J. N. Hart, N. L. Allan and F. R. Manby, Phys. Chem. Chem. Phys., 2012, 14, 7739–7743 RSC.
- M. J. Gillan, D. Alfè, P. J. Bygrave, C. R. Taylor and F. R. Manby, J. Chem. Phys., 2013, 139, 114101 CrossRef CAS PubMed.
- J. Yang, W. Hu, D. Usvyat, D. Matthews, M. Schutz and G. K.-L. Chan, Science, 2014, 345, 640–643 CrossRef CAS PubMed.
- G. J. O. Beran and K. Nanda, J. Phys. Chem. Lett., 2010, 1, 3480–3487 CrossRef CAS.
- S. Wen and G. J. O. Beran, J. Chem. Theory Comput., 2011, 7, 3733–3742 CrossRef CAS.
- K. Nanda and G. J. O. Beran, J. Phys. Chem. Lett., 2013, 4, 3165–3169 CrossRef CAS.
- S. Wen and G. J. O. Beran, J. Chem. Theory Comput., 2012, 8, 2698–2705 CrossRef CAS.
- S. Wen and G. J. O. Beran, Cryst. Growth Des., 2012, 12, 2169–2172 CAS.
- G. J. O. Beran, S. Wen, K. Nanda, Y. Huang and Y. Heit, Top. Curr. Chem., 2014, 345, 59–93 CrossRef CAS PubMed.
- J. G. Brandenburg and S. Grimme, Top. Curr. Chem., 2014, 345, 1–23 CrossRef CAS PubMed.
- X. He, O. Sode, S. S. Xantheas and S. Hirata, J. Chem. Phys., 2012, 137, 204505 CrossRef PubMed.
- K. Gilliard, O. Sode and S. Hirata, J. Chem. Phys., 2014, 140, 174507 CrossRef PubMed.
- O. Sode, M. Keceli, K. Yagi and S. Hirata, J. Chem. Phys., 2013, 138, 074501 CrossRef PubMed.
- A. M. Reilly and A. Tkatchenko, Phys. Rev. Lett., 2014, 113, 055701 CrossRef PubMed.
- S. L. Price, Acc. Chem. Res., 2009, 42, 117–126 CrossRef CAS PubMed.
- T.-Q. Yu and M. Tuckerman, Phys. Rev. Lett., 2011, 107, 3–6 Search PubMed.
- M. J. Schnieders, J. Baltrusaitis, Y. Shi, G. Chattree, L. Zheng, W. Yang and P. Ren, J. Chem. Theory Comput., 2012, 8, 1721–1736 CrossRef CAS PubMed.
- J. Park, I. Nessler, B. Mcclain, D. Macikenas, J. Baltrusaitis and M. J. Schnieders, J. Chem. Theory Comput., 2014, 10, 2781–2791 CrossRef CAS.
- N. Duff and B. Peters, J. Chem. Phys., 2011, 135, 134101 CrossRef PubMed.
- J. Anwar and D. Zahn, Angew. Chem., Int. Ed., 2011, 50, 1996–2013 CrossRef CAS PubMed.
- M. Salvalaglio, T. Vetter, F. Giberti, M. Mazzotti and M. Parrinello, J. Am. Chem. Soc., 2012, 134, 17221–17233 CrossRef CAS PubMed.
- M. Salvalaglio, T. Vetter, M. Mazzotti and M. Parrinello, Angew. Chem., Int. Ed., 2013, 52, 13369–13372 CrossRef CAS PubMed.
- S. A. Bonev, F. Gygi, T. Ogitsu and G. Galli, Phys. Rev. Lett., 2003, 91, 065501 CrossRef CAS PubMed.
- L. Gracia, M. Marqués, A. Beltrán, A. M. Pendás and J. M. Recio, J. Phys.: Condens. Matter, 2004, 16, S1263–S1270 CrossRef CAS.
- J. Sun, D. D. Klug, R. Martonák, J. A. Montoya, M.-S. Lee, S. Scandolo and E. Tosatti, Proc. Natl. Acad. Sci. U. S. A., 2009, 106, 6077–6081 CrossRef CAS PubMed.
- S. Gohr, S. Grimme, T. Söhnel, B. Paulus and P. Schwerdtfeger, J. Chem. Phys., 2013, 139, 174501 CrossRef PubMed.
- G. J. O. Beran, J. Chem. Phys., 2009, 130, 164115 CrossRef PubMed.
- K. Nanda and G. J. O. Beran, J. Chem. Phys., 2012, 137, 174106 CrossRef PubMed.
- K. D. Nanda, PhD thesis, University of California, Riverside, 2013, https://escholarship.org/uc/item/2qv949f5, accessed August 10, 2015.
- Y. Heit and G. J. O. Beran, J. Comput. Chem., 2014, 35, 2205–2214 CrossRef CAS PubMed.
- B. I. Dunlap, J. Chem. Phys., 1983, 78, 3140–3142 CrossRef CAS.
- F. Weigend, M. Häser, H. Patzelt and R. Ahlrichs, Chem. Phys. Lett., 1998, 294, 143–152 CrossRef CAS.
- M. W. Feyereisen, G. Fitzgerald and A. Komornicki, Chem. Phys. Lett., 1993, 208, 359–363 CrossRef CAS.
- F. Weigend, Phys. Chem. Chem. Phys., 2002, 4, 4285–4291 RSC.
- K. Raghavachari, G. Trucks, J. A. Pople and M. Head-Gordon, Chem. Phys. Lett., 1989, 157, 479–483 CrossRef CAS.
- J. D. Watts, J. Gauss and R. J. Bartlett, J. Chem. Phys., 1993, 98, 8718–8733 CrossRef CAS.
- T. H. Dunning, J. Chem. Phys., 1989, 90, 1007–1023 CrossRef CAS.
- F. Weigend, A. Köhn and C. Hättig, J. Chem. Phys., 2002, 116, 3175–3183 CrossRef CAS.
- H.-J. Werner, P. J. Knowles, G. Knizia, F. R. Manby, M. Schütz, P. Celani, T. Korona, R. Lindh, A. Mitrushenkov, G. Rauhut, K. R. Shamasundar, T. B. Adler, R. D. Amos, A. Bernhardsson, A. Berning, D. L. Cooper, M. J. O. Deegan, A. J. Dobbyn, F. Eckert, E. Goll, C. Hampel, A. Hesselmann, G. Hetzer, T. Hrenar, G. Jansen, C. Köppl, Y. Liu, A. W. Lloyd, R. A. Mata, A. J. May, S. J. McNicholas, W. Meyer, M. E. Mura, A. Nicklass, D. P. O'Neill, P. Palmieri, D. Peng, K. Pflüger, R. Pitzer, M. Reiher, T. Shiozaki, H. Stoll, A. J. Stone, R. Tarroni, T. Thorsteinsson and M. Wang, MOLPRO, version 2012.1, a package of ab initio programs, see http://www.molpro.net75 Search PubMed.
- H.-J. Werner, P. J. Knowles, G. Knizia, F. R. Manby and M. Schütz, WIREs Comput. Mol. Sci., 2012, 2, 242–253 CrossRef CAS.
- S. F. Boys and F. Bernardi, Mol. Phys., 1970, 19, 553–566 CrossRef CAS.
- A. Karton and J. M. L. Martin, Theor. Chem. Acc., 2006, 115, 330–333 CrossRef CAS.
- T. Helgaker, W. Klopper, H. Koch and J. Noga, J. Chem. Phys., 1997, 106, 9639–9646 CrossRef CAS.
- J. W. Ponder, TINKER v6.3, 2014, http://dasher.wustl.edu/tinker/, accessed August 10, 2015 Search PubMed.
- J. C. Wu, G. Chattree and P. Ren, Theor. Chem. Acc., 2012, 131, 1138 CrossRef PubMed.
- K. Yu and J. R. Schmidt, J. Chem. Phys., 2012, 136, 034503 CrossRef PubMed.
- R. T. Cygan, V. N. Romanov and E. M. Myshakin, J. Phys. Chem. C, 2012, 116, 13079–13091 CAS.
- G. Perez-Sanchez, D. Gonzalez-Salgado, M. M. Pineiro and C. Vega, J. Chem. Phys., 2013, 138, 084506 CrossRef CAS PubMed.
- C. Graham, D. Imrie and R. Raab, Mol. Phys., 1998, 93, 49–56 CrossRef CAS.
- J. J. Potoff and J. I. Siepman, AIChE J., 2001, 47, 1676–1682 CrossRef CAS.
- J. G. McDaniel and J. R. Schmidt, J. Phys. Chem. A, 2013, 117, 2053–2066 CrossRef CAS PubMed.
- V. G. Manzhelii, A. M. Tolkachev, M. I. Bagatskii and E. I. Voitovich, Phys. Status Solidi B, 1971, 44, 39–49 CrossRef CAS.
- I. N. Krupskii, A. I. Prokhvatilov, A. I. Erenburg and A. S. Barylnik, Fiz. Nizk. Temp., 1982, 8, 533 CAS.
- W. H. Keesom and J. W. L. Köhler, Physica, 1934, 1, 655–658 CrossRef CAS.
- A. Curzon, Physica, 1972, 59, 733 CrossRef CAS.
- M. Azreg-Aïnou, Monatsh. Chem., 2005, 136, 2017–2027 CrossRef.
- W. F. Giauque and C. J. Egan, J. Chem. Phys., 1937, 5, 45 CrossRef CAS.
- G. Herzberg, Electronic Spectra and Electronic Structure of Polyatomic Molecules, D. Van Nostrand Company, Inc, 1966 Search PubMed.
- T. Shimanouchi, Tables of Molecular Vibrational Frequencies, United States Department of Commerce, 1972, vol. 1 Search PubMed.
- F. Birch, J. Geophys. Res., 1978, 83, 1257–1268 CrossRef CAS.
- P. Vinet, J. R. Smith, J. Ferrante and J. H. Rose, Phys. Rev. B: Condens. Matter Mater. Phys., 1987, 35, 1945–1953 CrossRef CAS.
- L. Liu, Earth Planet. Sci. Lett., 1984, 71, 104–110 CrossRef CAS.
- V. M. Giordano, F. Datchi, F. A. Gorelli and R. Bini, J. Chem. Phys., 2010, 133, 144501 CrossRef PubMed.
- P. W. Bridgman, Proc. Am. Acad. Arts Sci., 1938, 72, 207–225 CrossRef CAS.
- B. Olinger, J. Chem. Phys., 1982, 77, 6255–6258 CrossRef CAS.
- C. Yoo, H. Kohlmann, H. Cynn, M. Nicol, V. Iota and T. LeBihan, Phys. Rev. B: Condens. Matter Mater. Phys., 2002, 65, 1–6 Search PubMed.
- J. P. Martin Trusler, J. Phys. Chem. Ref. Data, 2011, 40, 043105 CrossRef.
- J. S. Zhang, S. R. Shieh, J. D. Bass, P. Dera and V. Prakapenka, Appl. Phys. Lett., 2014, 104, 141901 CrossRef.
- K. Aoki, H. Yamawaki, M. Sakashita, Y. Gotoh and K. Takemura, Science, 1994, 263, 356–358 CAS.
Footnotes |
| † Electronic supplementary information (ESI) available: Additional methodological details, optimized structures, and tables of the predicted properties. See DOI: 10.1039/c5sc03014e |
| ‡ Present address: Department of Chemistry, University of Southern California, Los Angeles, CA 90089-0482, USA. |
| This journal is © The Royal Society of Chemistry 2016 |